
Sonic Price Forecast: Sonic Labs to launch AI platform Spark as S breaks out
- Sonic extends gains above the recently broken trendline, with the 50-day EMA providing immediate support.
- Sonic Labs’ Spark AI platform to support building and deployment of Web3 applications using natural language.
- The MACD indicator maintains a buy signal, encouraging traders to seek exposure despite the 100-day EMA capping price movement.
Sonic (S) price exhibits a robust bullish structure, trading at $0.37 on Thursday, as altcoins in the broader cryptocurrency market flash early bull run signals. Although Sonic has pulled back slightly from $0.39, its highest level in the past month, it remains resilient. The bullish setup holds as the Layer-1 protocol token stays above two key levels: a recently broken trendline resistance and the demand zone at around $0.36.
Sonic Labs announces AI platform Spark
Sonic Labs has announced plans to launch Spark, an Artificial Intelligence (AI) development platform that enables anyone to build and deploy full-stack Web3 applications without requiring expertise in coding languages.
Users will be able to transform their innovative ideas into functional smart contracts. From Decentralized Finance (DeFi) protocols, non-fungible token (NFT) marketplaces, to other decentralized applications (dApps), Spark will bring them into existence using natural language.
Spark is powered by Google’s Gemini Large Language Model (LLM), ensuring that users have access to “state-of-the-art reasoning, code generation, and real-time debugging.”
Sonic Labs said that “Spark expands the developer pool, unlocks rapid on-chain experimentation, captures billions in free AI research and development (R&D), and places Sonic at the leading edge of both blockchain and AI.”
Spark is currently in development, with early access expected to start soon.
Sonic price reacted to the news, extending the uptrend to an intraday high of $0.39. However, it has declined, trading at around $0.37 at the time of writing.
Technical outlook: Can Sonic extend the uptrend?
Sonic price holds above support provided by the 50-day Exponential Moving Average (EMA) at $0.36 and the dotted descending trendline on the daily chart below.
A buy signal triggered on Tuesday by the Moving Average Convergence Divergence (MACD) indicator reinforces the bullish grip. If the blue MACD line remains above the red signal line and the green histograms continue to expand above the zero line, the path of least resistance will hold upward, encouraging traders to seek exposure.
Traders will look out for Sonic’s price potential to break above the 100-day EMA resistance at $0.41 to ascertain the uptrend’s strength before increasing buying pressure. Key milestones beyond this level include the supply zone at $0.50, which was tested as support in early May, and the hurdle at $0.63, also tested in May but as resistance.
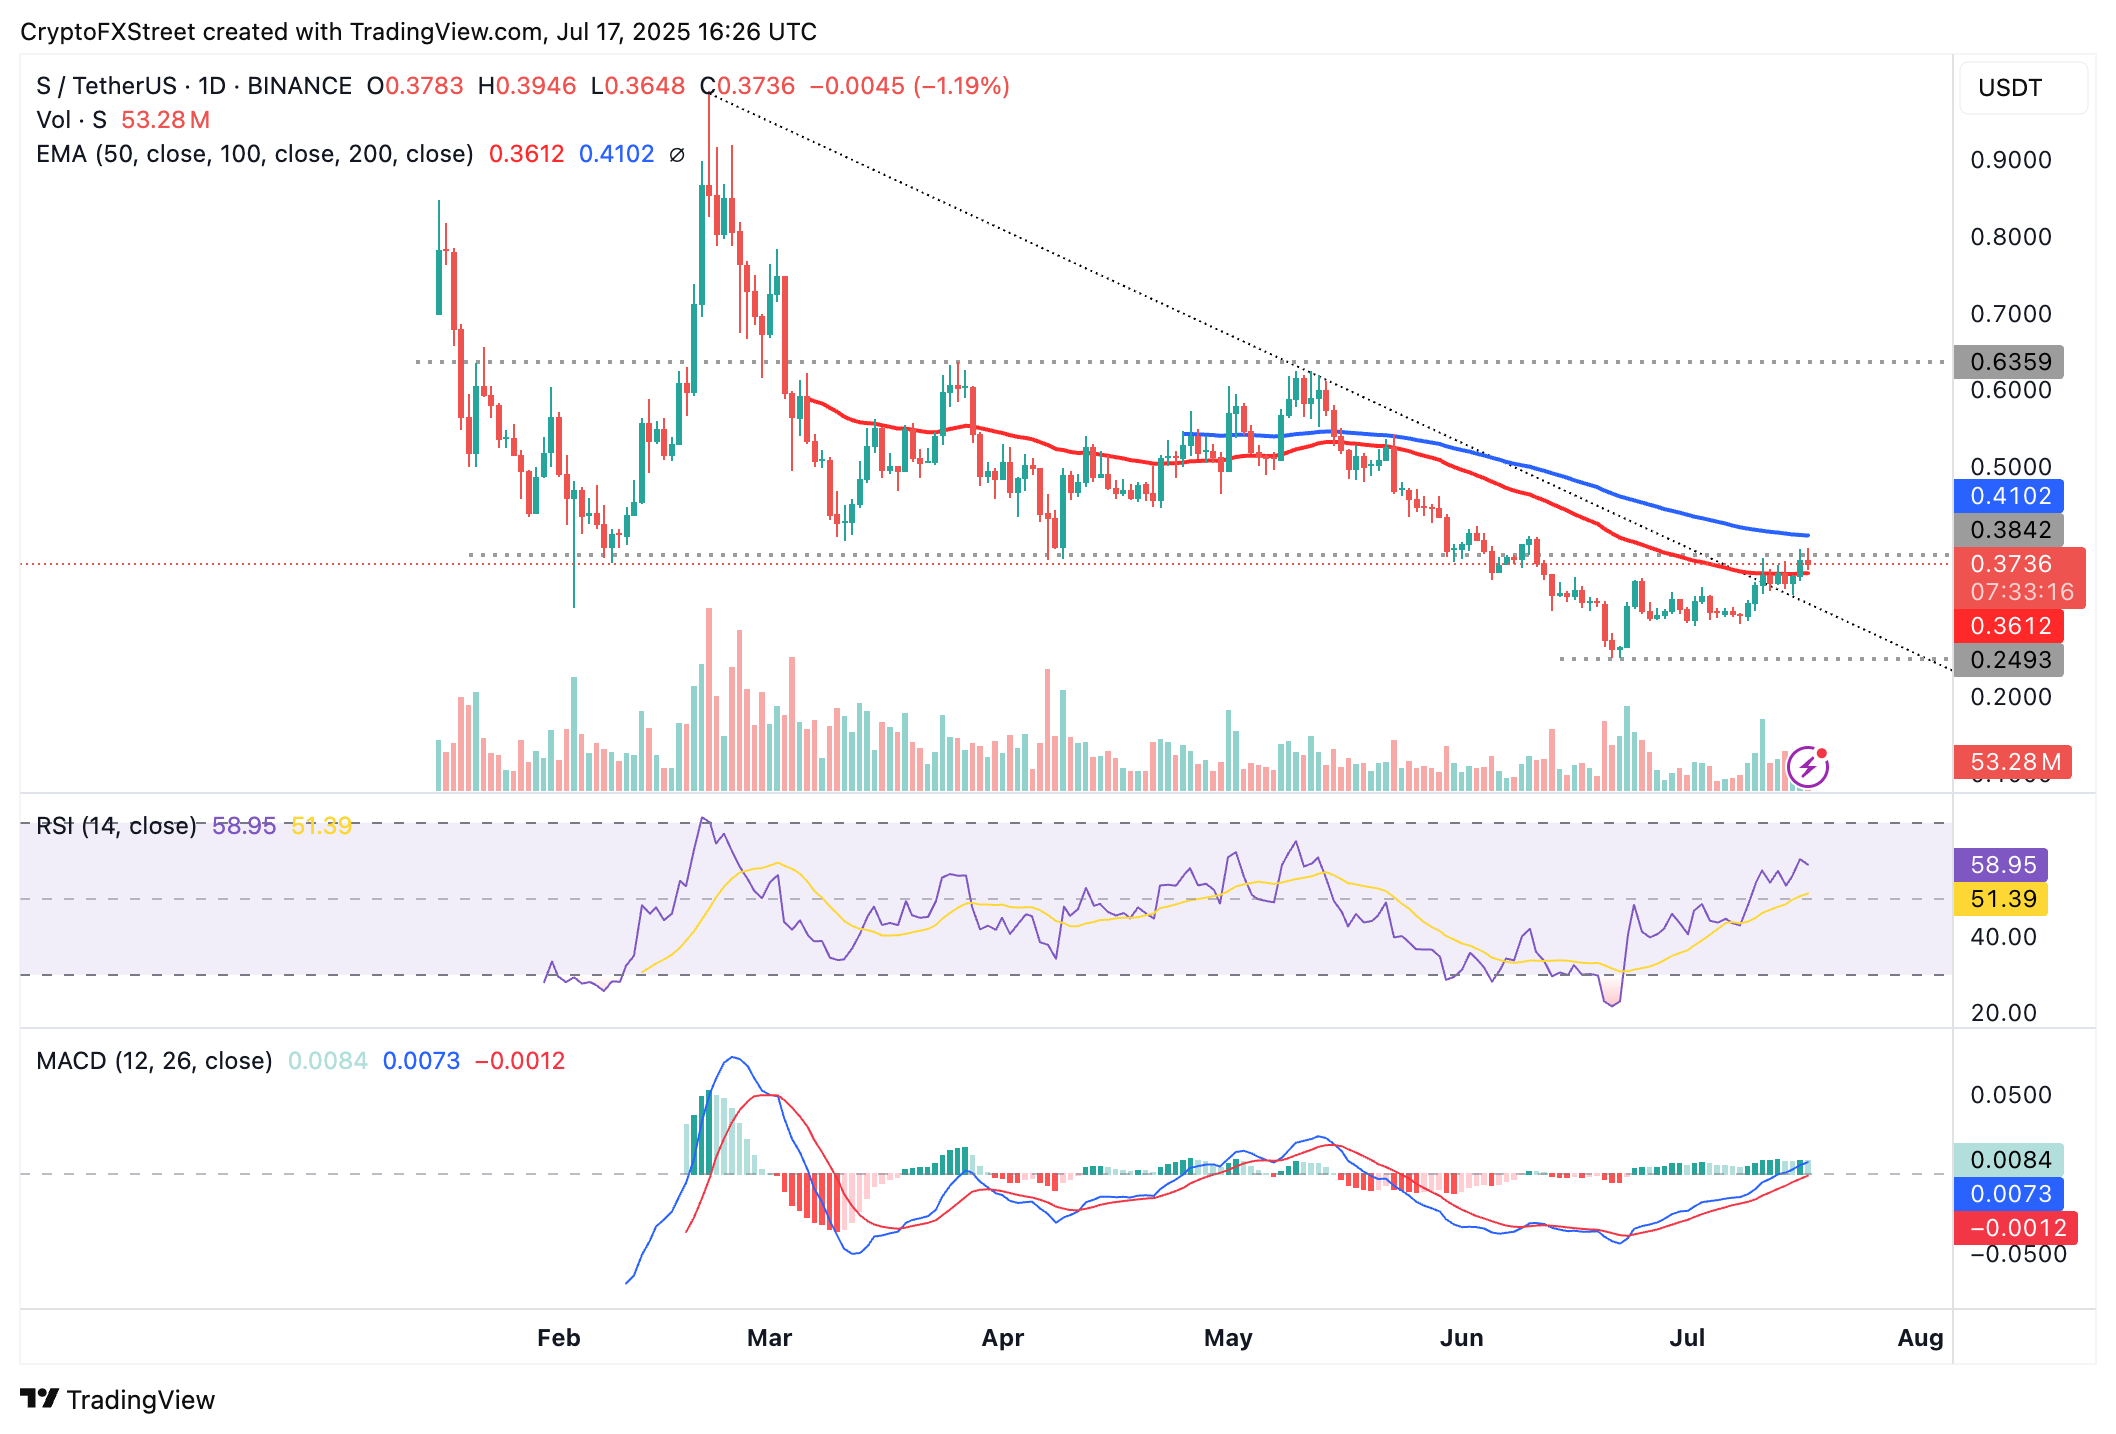
S/USDT daily chart
On the contrary, the downward-looking Relative Strength Index (RSI) at 58 indicates that buying pressure is fading, increasing the likelihood of Sonic's price falling below the 50-day EMA support at $0.36. If selling pressure overwhelms the bulls, the correction could accelerate toward the June 22 support at $0.24.
Cryptocurrency prices FAQs
Token launches influence demand and adoption among market participants. Listings on crypto exchanges deepen the liquidity for an asset and add new participants to an asset’s network. This is typically bullish for a digital asset.
A hack is an event in which an attacker captures a large volume of the asset from a DeFi bridge or hot wallet of an exchange or any other crypto platform via exploits, bugs or other methods. The exploiter then transfers these tokens out of the exchange platforms to ultimately sell or swap the assets for other cryptocurrencies or stablecoins. Such events often involve an en masse panic triggering a sell-off in the affected assets.
Macroeconomic events like the US Federal Reserve’s decision on interest rates influence crypto assets mainly through the direct impact they have on the US Dollar. An increase in interest rate typically negatively influences Bitcoin and altcoin prices, and vice versa. If the US Dollar index declines, risk assets and associated leverage for trading gets cheaper, in turn driving crypto prices higher.
Halvings are typically considered bullish events as they slash the block reward in half for miners, constricting the supply of the asset. At consistent demand if the supply reduces, the asset’s price climbs.
Recommended Articles


