

Ethereum CrossX Indicators Flashes Buy As Insitution Accumulates, Analyst Says Brace For $4,000

Source Newsbtc

New reports indicate that the Ethereum (ETH) CrossX indicator is flashing strong buy signals, suggesting a potential breakout toward $4,000. As the market transitions from selling to buying, on-chain data shows that institutional investors are heavily accumulating ETH tokens, indicating a shift in sentiment. 

Institutions Load Up On ETH As Buy Signal Flashes

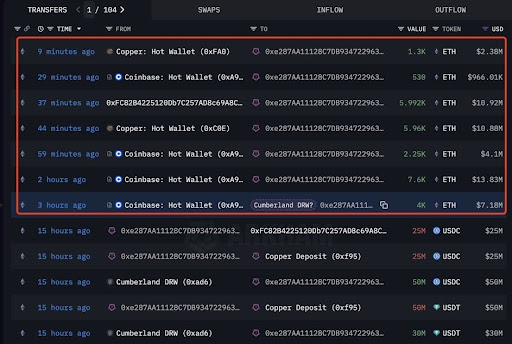
On-chain analytics platform, Lookonchain, has identified a notable increase in Ethereum accumulation, largely driven by institutional whales. Over the course of three hours, a wallet address reportedly associated with the trading firm Cumberland DRW withdrew a staggering 27,632 ETH, worth approximately $50.24 million. This transfer was made from major exchanges, including Coinbase, Copper and Binance.

The wallet’s activity involved multiple high-value transfers, such as a 7,600 ETH withdrawal worth $13.83 million from Coinbase, a 5,992 ETH withdrawal worth $10.92 million from Copper and Binance, and an additional 5,960 ETH transfer valued at $10.88 million from Copper. 
Ethereum

Notably, the receiving wallet, 0ex287AA111…, was consistently used across all transactions, suggesting coordinated accumulation rather than a typical trading activity. Historically, large-scale withdrawals from Ethereum exchanges have preceded price surges, as they significantly reduce sell-side liquidity and indicate a longer-term holding pattern by investors. 

Amid this growing institutional accumulation, the Ethereum CrossX Indicator, as noted by Ezy Bitcoin on X, has recently flashed a strong buy signal. This reinforces the notion that institutional interest is rising, signaling an increase in demand and potentially setting the stage for further upward price movement. 

Ethereum CrossX Indicator Suggests $4,000 Surge Ahead

Shedding more light on Ezy Bitcoin’s report, the CrossX indicator, which officially triggered a buy signal for Ethereum, is signaling a potential surge above $4,000 for the altcoin’s price. The market expert highlights that this is the first signal seen in nearly six months and, historically, has often preceded significant price action and explosive moves. 

The CrossX Indicator, a tool used to detect high-probability trend reversals based on volume, price action, and divergence patterns, has shown remarkable accuracy in past cycles. As seen in the analyst’s weekly chart, previous buy signals were followed by rallies that took ETH to new local highs.

Now, with Ethereum’s price rebounding off recent lows and a fresh Bullish Divergence in place, the same rally pattern may be unfolding again. If history repeats, ETH could be gearing up for a run beyond $3,000, with the possibility of testing the $4,200 range by year’s end. 

According to CoinMarketCap’s data, Ethereum is currently trading at $1,803, reflecting a yearly decline of 43.10%. A potential rise to $4,200 would represent a staggering 132.95% increase, bringing Ethereum (ETH) closer to its present all-time high of over $4,800.

Ethereum
Disclaimer: For information purposes only. Past performance is not indicative of future results.
placeholder
ECB Policy Outlook for 2026: What It Could Mean for the Euro’s Next MoveWith the ECB likely holding rates steady at 2.15% and the Fed potentially extending cuts into 2026, EUR/USD may test 1.20 if Eurozone growth proves resilient, but weaker growth and an ECB pivot could pull the pair back toward 1.13 and potentially 1.10.
Author  Mitrade
Dec 26, 2025
With the ECB likely holding rates steady at 2.15% and the Fed potentially extending cuts into 2026, EUR/USD may test 1.20 if Eurozone growth proves resilient, but weaker growth and an ECB pivot could pull the pair back toward 1.13 and potentially 1.10.
placeholder
Financial Markets 2026: Volatility Catalysts in Gold, Silver, Oil, and Blue-Chip Stocks—A CFD Trader's OutlookGet a comprehensive financial market 2026 outlook exploring key economic drivers, volatility catalysts in gold, oil and stocks, and what the evolving economic outlook means for cfd trading strategies and risk management on global markets.
Author  Rachel Weiss
May 15, Fri
Get a comprehensive financial market 2026 outlook exploring key economic drivers, volatility catalysts in gold, oil and stocks, and what the evolving economic outlook means for cfd trading strategies and risk management on global markets.
placeholder
Gold gains momentum to near $4,400 as Fed hike expectations drop despite Us-Iran tensionsGold price (XAU/USD) gains momentum to around $4,395 during the early Asian trading hours on Monday. The precious metal extends the rally as cooling US inflation data has dampened expectations for the US Federal Reserve (Fed) interest rate hike. 
Author  FXStreet
Aug 17, Mon
Gold price (XAU/USD) gains momentum to around $4,395 during the early Asian trading hours on Monday. The precious metal extends the rally as cooling US inflation data has dampened expectations for the US Federal Reserve (Fed) interest rate hike. 
placeholder
Australian Dollar gains as US Dollar struggles amid fading Fed rate hike betsAUD/USD extends its gains for the third successive day, trading around 0.7110 during the Asian hours on Tuesday. The currency pair continues to appreciate as the US Dollar (USD) remains subdued amid fading expectations for further rate hikes by the Federal Reserve (Fed).
Author  FXStreet
22 hours ago
AUD/USD extends its gains for the third successive day, trading around 0.7110 during the Asian hours on Tuesday. The currency pair continues to appreciate as the US Dollar (USD) remains subdued amid fading expectations for further rate hikes by the Federal Reserve (Fed).
placeholder
WTI consolidates below $84.50, two-week top as bullish bias remains amid Hormuz standoffWest Texas Intermediate (WTI) – the benchmark US Crude Oil price – extends its consolidative price move through the first half of the European session and currently trades near the $84.25-$84.30 area, close to a two-week high set earlier this Tuesday.
Author  FXStreet
14 hours ago
West Texas Intermediate (WTI) – the benchmark US Crude Oil price – extends its consolidative price move through the first half of the European session and currently trades near the $84.25-$84.30 area, close to a two-week high set earlier this Tuesday.
goTop
quote