Onyxcoin (XCN) Soars 171% After Breakout, Shows No Signs of Slowing

Source Beincrypto

After reaching a local cycle high of $0.049 in January, XCN entered a downtrend, shedding significant value over the next few months. The decline culminated in a sharp drop to a low of $0.007 on April 7. However, that marked a turning point.

Since then, the demand for the altcoin has soared, pushing its price up 171%. With growing bullish momentum, XCN appears poised to extend these gains.

XCN Breaks Out With Bullish Momentum

Since bottoming out, XCN has rebounded strongly, breaking above a key descending resistance trend line. The breakout triggered a bullish move that has pushed the altcoin to record significant gains over the past week.

On the daily chart, XCN’s Balance of Power (BoP) supports the ongoing rally. At press time, this momentum indicator, which measures buying and selling pressures, is above zero at 0.24.
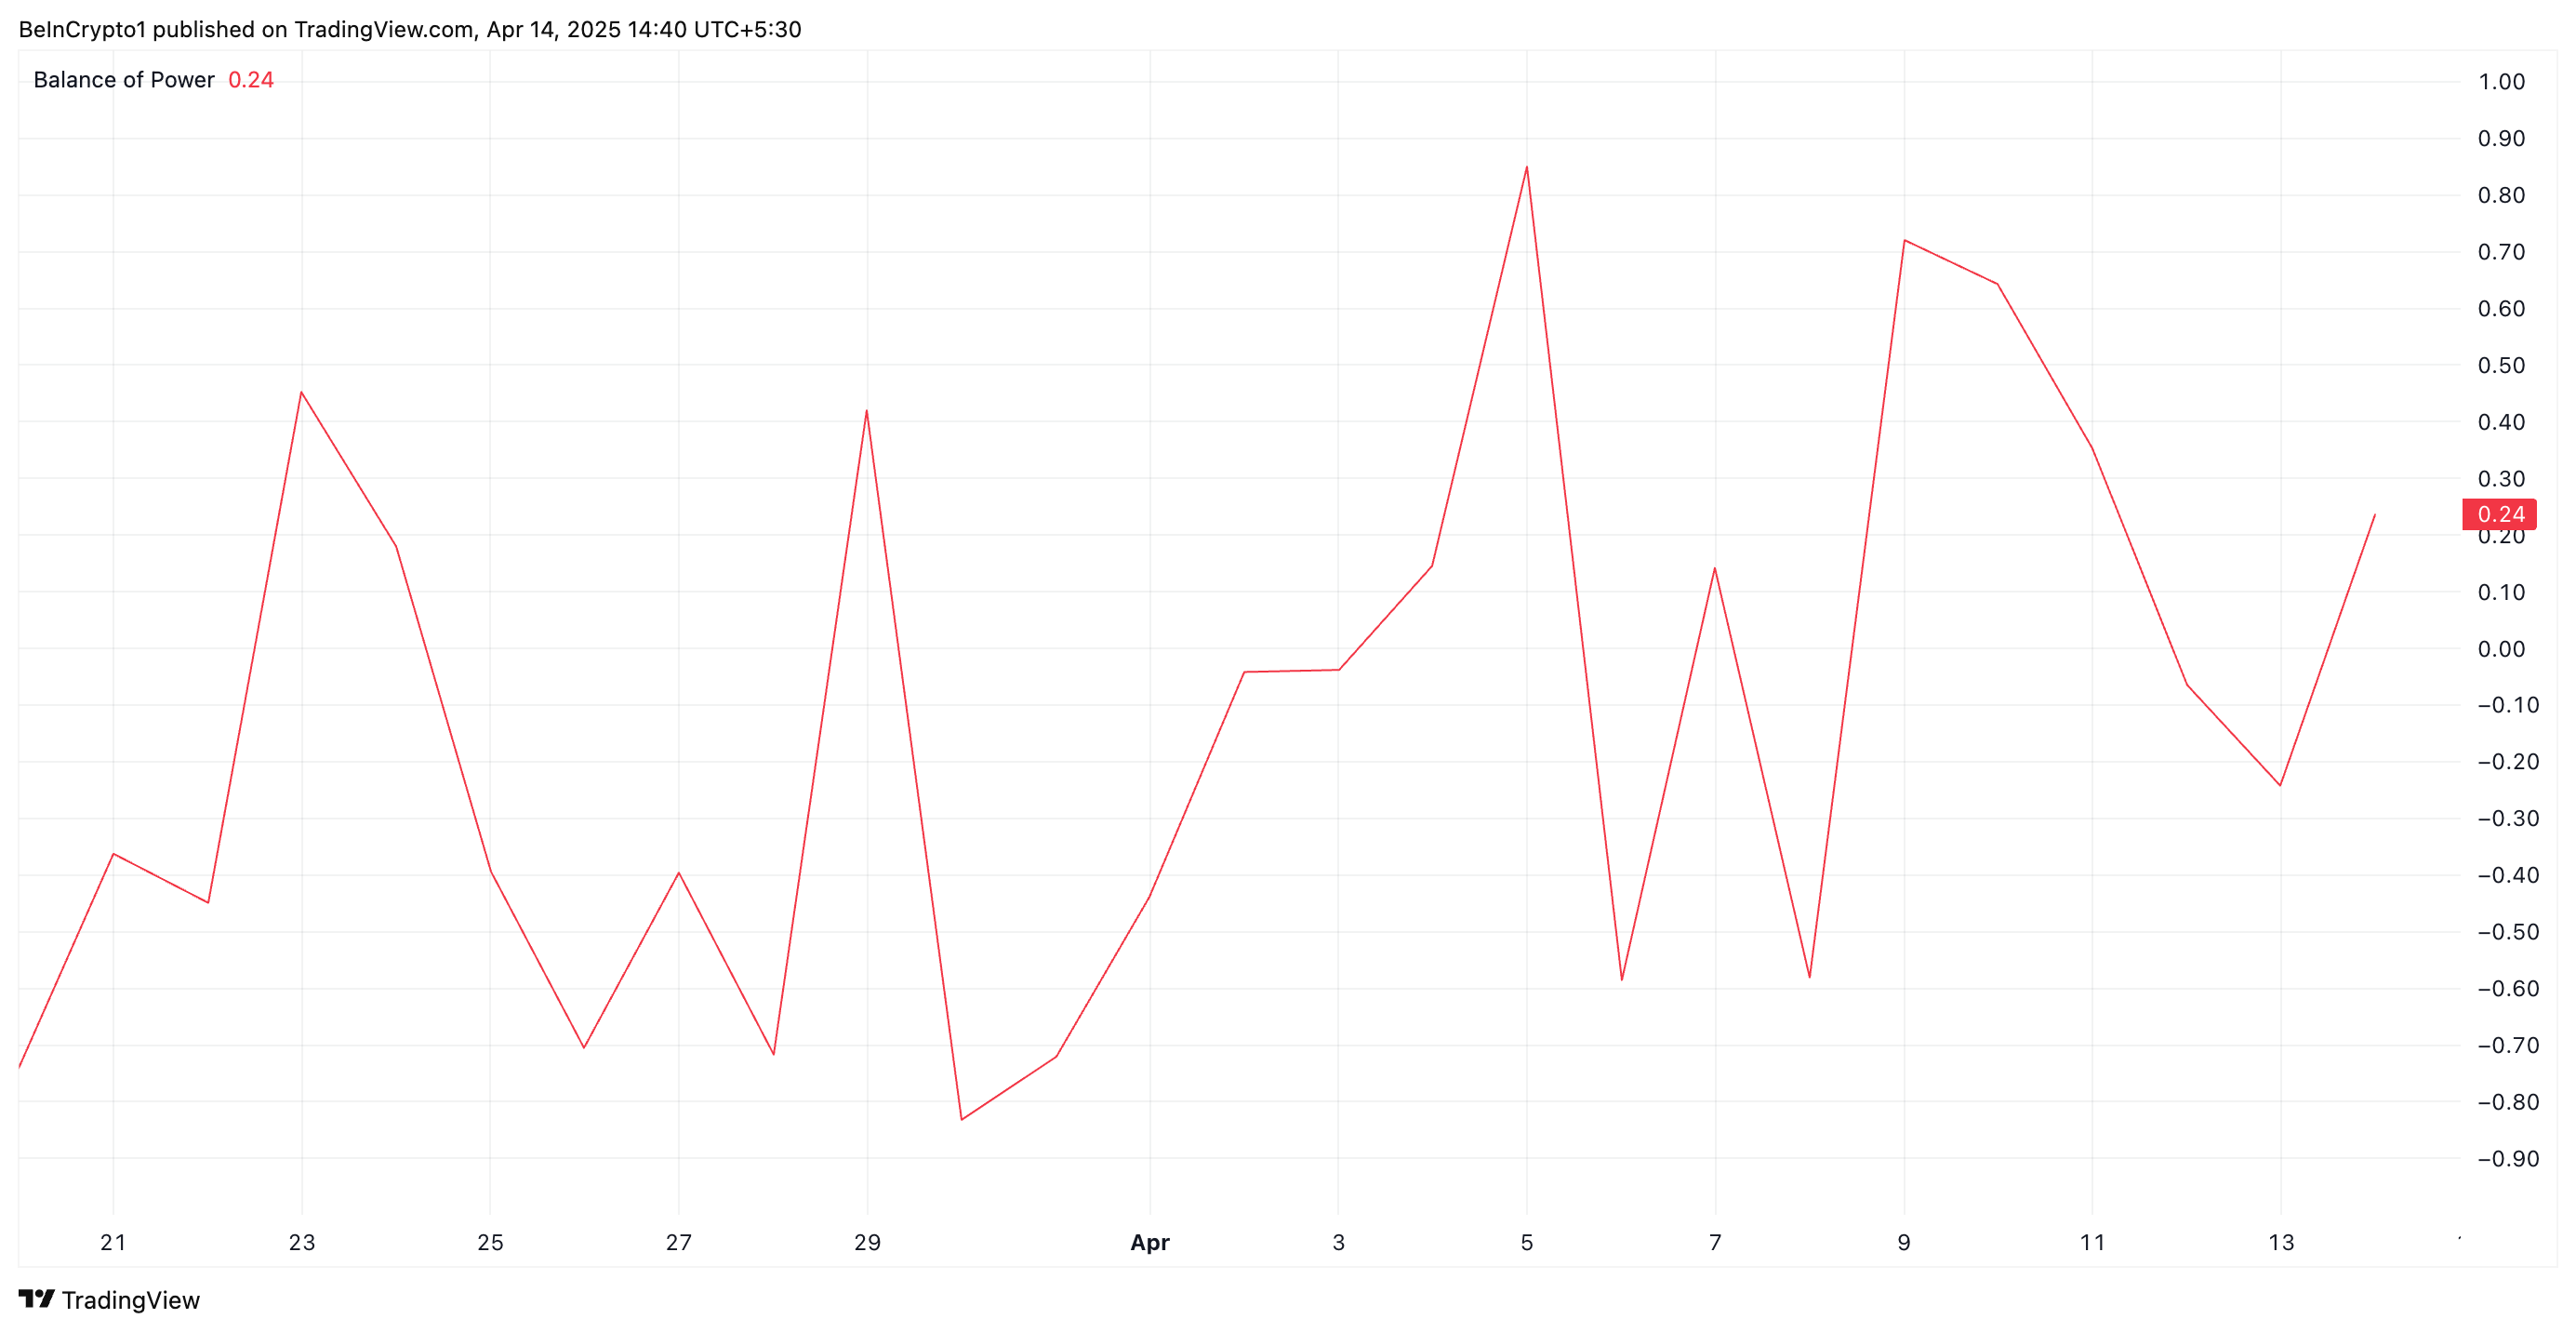
XCN BoP.XCN BoP. Source: TradingView

When an asset’s BoP is positive, it indicates that buyers are in control of the market, exerting more pressure than sellers. This is a bullish sign, suggesting that XCN’s upward price movement is being driven by strong demand. 

A consistently positive BoP for the token would indicate sustained buying momentum, which, if maintained, could lead to continued price growth.

However, XCN’s derivatives traders do not share this bullish bias. The token’s persistently negative funding rate reflects this. This stands at -0.032% at press time, highlighting the demand for short positions. 

XCN Funding Rate.XCN Funding Rate. Source: Coinglass

The funding rate is a periodic payment exchanged between long and short position holders in perpetual futures contracts. It is designed to keep the contract’s price in line with the asset’s spot price.

When the funding rate is negative like this, short position holders are paying long position holders, indicating that the market is bearish, with more traders betting on price declines.

XCN’s climbing buying pressure and negative funding rate signal a divergence between spot market sentiment and derivatives market positioning. This trend suggests that while the broader derivatives market expects a price decline, actual buying activity on the spot market is driving upward momentum, setting the stage for a short squeeze if the rally continues.

XCN Price Pushes Past 20-Day EMA, Traders Eye Continued Rally

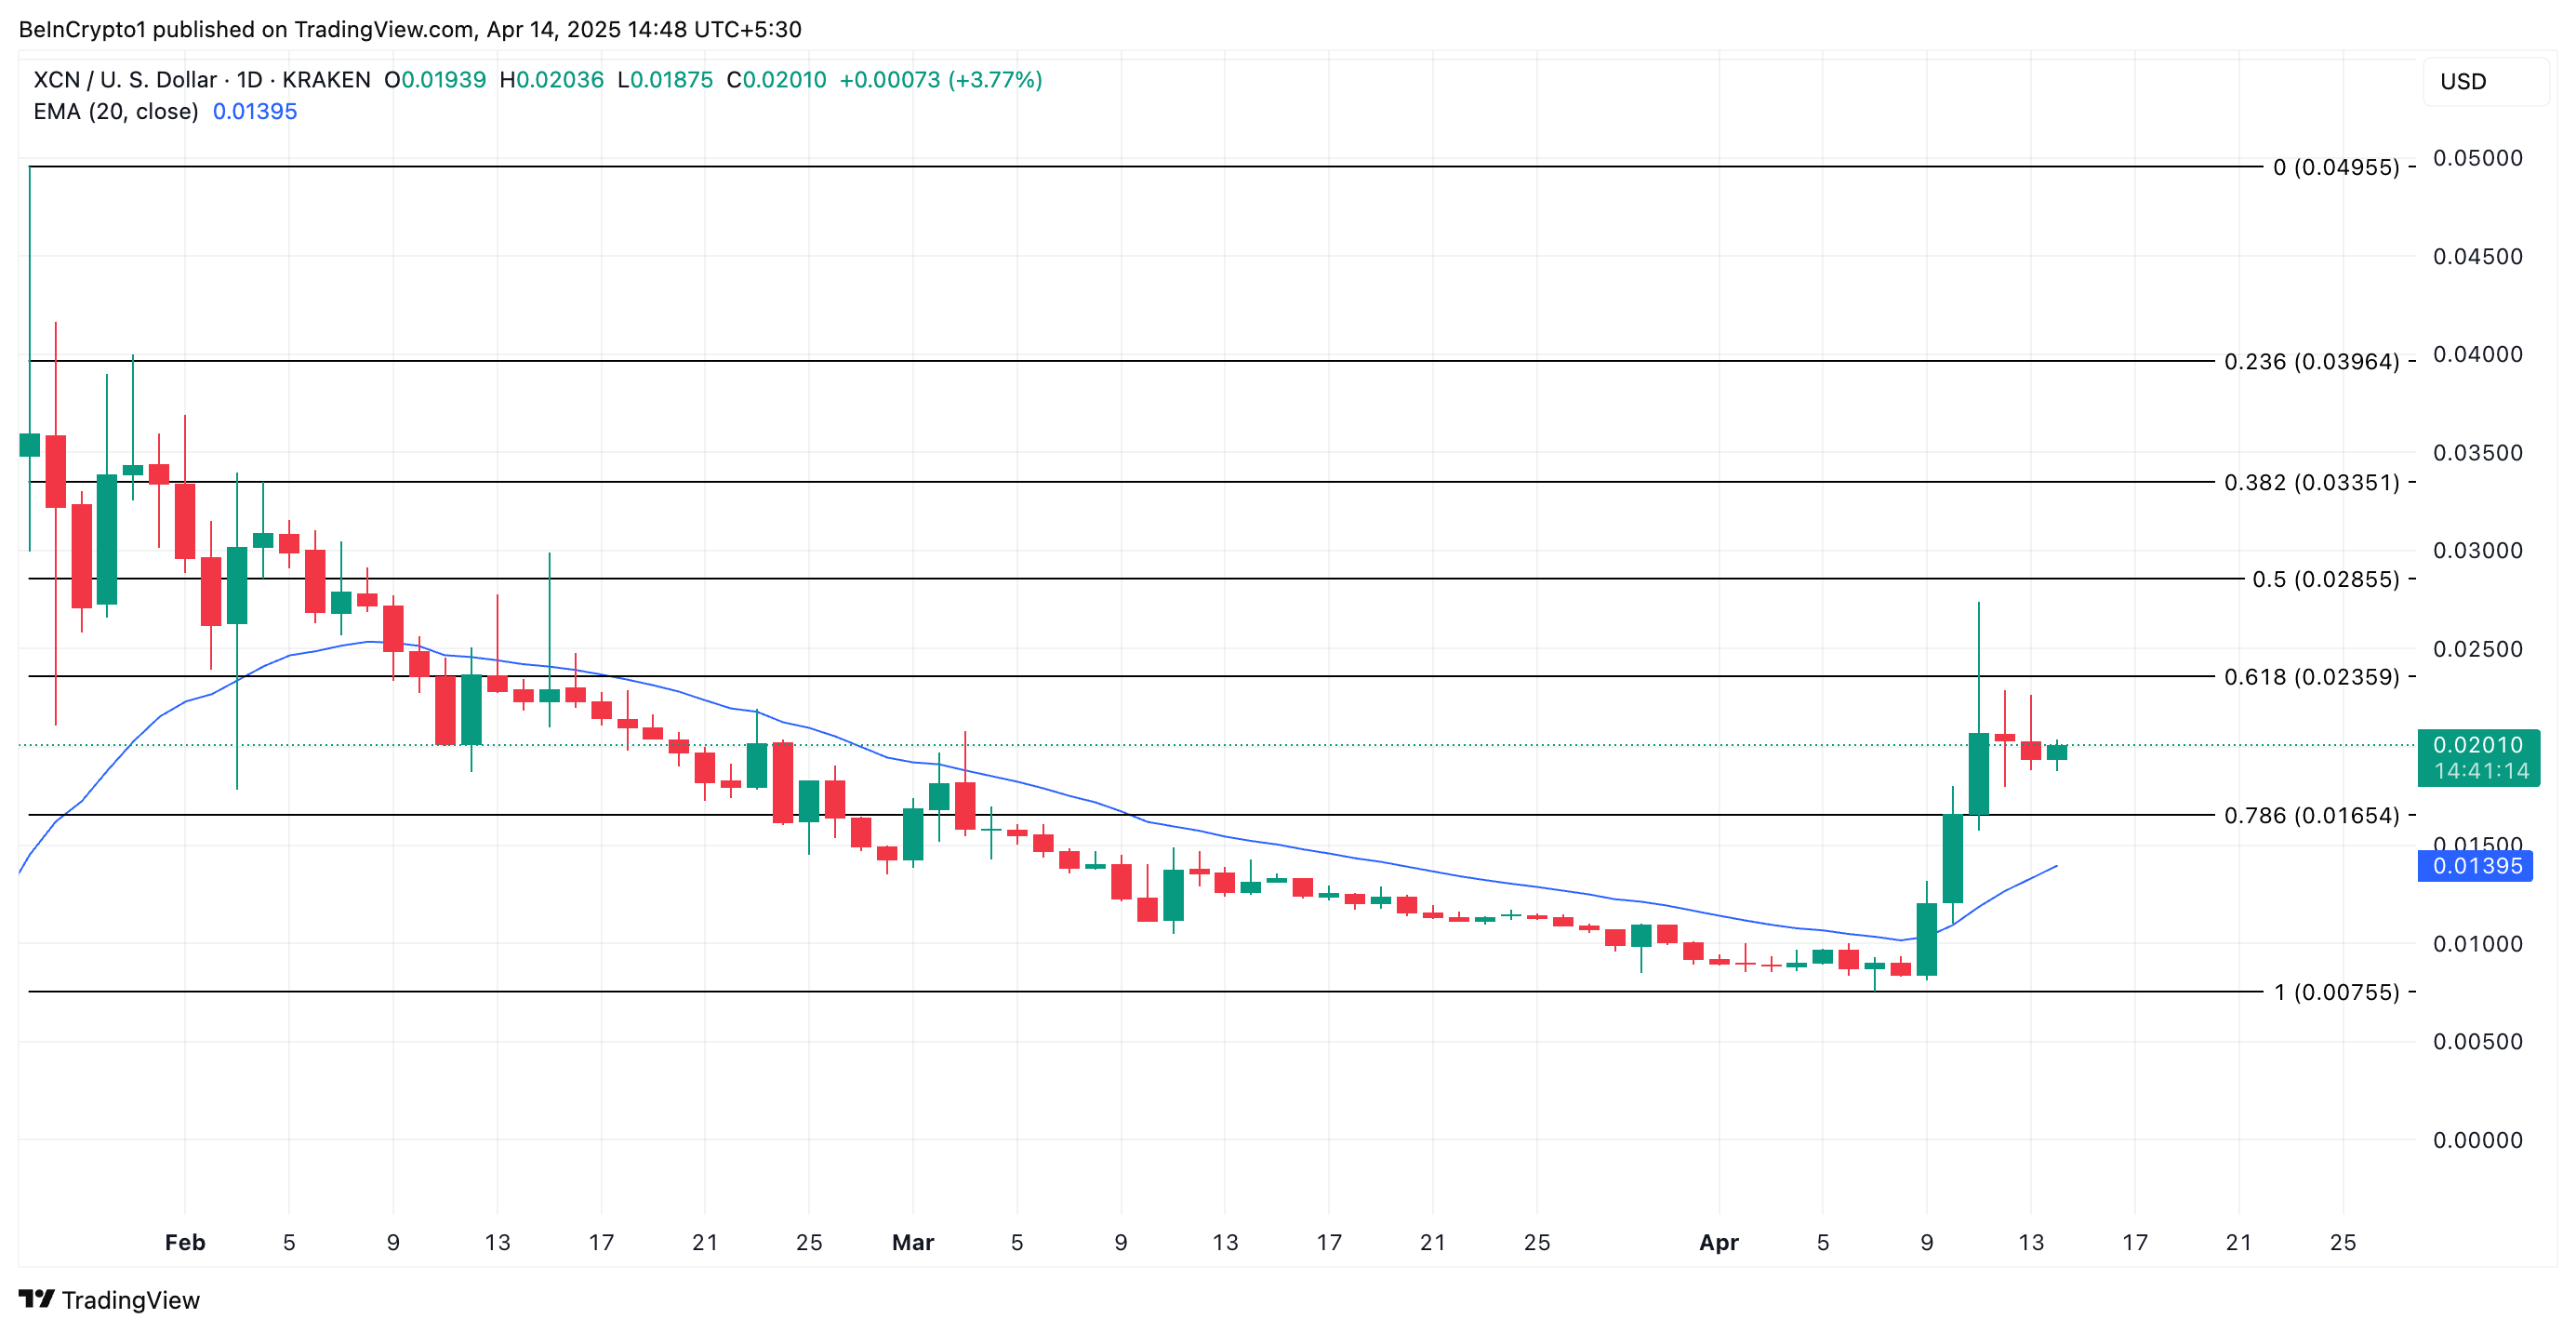
XCN’s rally over the past week has pushed its price above the 20-day exponential moving average (EMA). The 20-day EMA measures an asset’s average trading days over the past 20 trading days, giving more weight to recent prices. When the price climbs above it, it signals that buying pressure is high.

As XCN breaks above this level, it confirms that the asset is entering an uptrend. Traders often look for this type of crossover as a sign of bullish strength, indicating increased buying pressure and a possible continuation of the rally.

If XCN maintains its uptrend, it could trade at $0.023.
XCN Price Analysis.XCN Price Analysis. Source: TradingView

On the other hand, if the uptrend faces a correction, XNC could fall to $0.016.

Disclaimer: For information purposes only. Past performance is not indicative of future results.
placeholder
Top 3 gainers Brett, Story and Virtuals Protocol sparkle as Bitcoin eyes $90,000Cryptocurrencies have sustained a buoyant outlook since last week as US President Donald Trump’s tariff war was paused for 90 days, except for China, propping global markets for lifeline relief rallies.
Author  FXStreet
9 hours ago
Cryptocurrencies have sustained a buoyant outlook since last week as US President Donald Trump’s tariff war was paused for 90 days, except for China, propping global markets for lifeline relief rallies.
placeholder
Nvidia Soars 10% on $500B Supercomputer Plans While AI Tokens RNDR, TAO, and FET Rally: Why MIND of Pepe Could Be NextEven while stock markets are mired in uncertainty, AI tokens continue to mount a rebound. Behind the scenes, the crypto AI sector is exploding after fresh announcements from OpenAI and NVIDIA. Could one brainy meme coin, MIND of Pepe, outthink them all? NVIDIA and OpenAI Fuel AI Crypto Rally The AI crypto narrative is heating […]
Author  Bitcoinist
10 hours ago
Even while stock markets are mired in uncertainty, AI tokens continue to mount a rebound. Behind the scenes, the crypto AI sector is exploding after fresh announcements from OpenAI and NVIDIA. Could one brainy meme coin, MIND of Pepe, outthink them all? NVIDIA and OpenAI Fuel AI Crypto Rally The AI crypto narrative is heating […]
placeholder
Bitcoin Price Forecast: What Experts Anticipate Following The Jump Toward $85,000As Bitcoin (BTC), the leading cryptocurrency, reclaims the crucial $85,000 mark on Monday, top analysts are projecting heightened volatility in the market for the coming week.
Author  NewsBTC
10 hours ago
As Bitcoin (BTC), the leading cryptocurrency, reclaims the crucial $85,000 mark on Monday, top analysts are projecting heightened volatility in the market for the coming week.
placeholder
EUR/USD turns sideways while Trump’s erratic tariff announcements keep USD on backfootEUR/USD demonstrates a sideways trend near 1.1350 during European trading hours on Tuesday after a sharp run-up in the last few trading days. The major currency pair consolidates as the US Dollar (USD) gains a temporary cushion after remaining under pressure for over a week.
Author  FXStreet
10 hours ago
EUR/USD demonstrates a sideways trend near 1.1350 during European trading hours on Tuesday after a sharp run-up in the last few trading days. The major currency pair consolidates as the US Dollar (USD) gains a temporary cushion after remaining under pressure for over a week.
placeholder
USD/CAD Price Forecast: Support appears at 1.3850 with potential corrective reboundsThe USD/CAD pair extends its decline for the fifth consecutive session, hovering around 1.3860 during European trading on Tuesday. Daily chart technical analysis highlights a dominant bearish trend, with the pair trending lower within a descending channel formation.
Author  FXStreet
10 hours ago
The USD/CAD pair extends its decline for the fifth consecutive session, hovering around 1.3860 during European trading on Tuesday. Daily chart technical analysis highlights a dominant bearish trend, with the pair trending lower within a descending channel formation.
goTop
quote