EOS Hits Two-Month High, But Overheated Signals Suggest a Possible Cooldown
EOS’ Network native token has extended its winning streak for the third consecutive day. Its price has surged by 16% in the past 24 hours to rank as the market’s top gainer in the past day.
However, signs of overheating are beginning to emerge, raising concerns about the rally’s sustainability. In this analysis, BeInCrypto explains why the EOS token might witness a brief price pullback.
EOS Extends Gains, Climbs By Double Digits
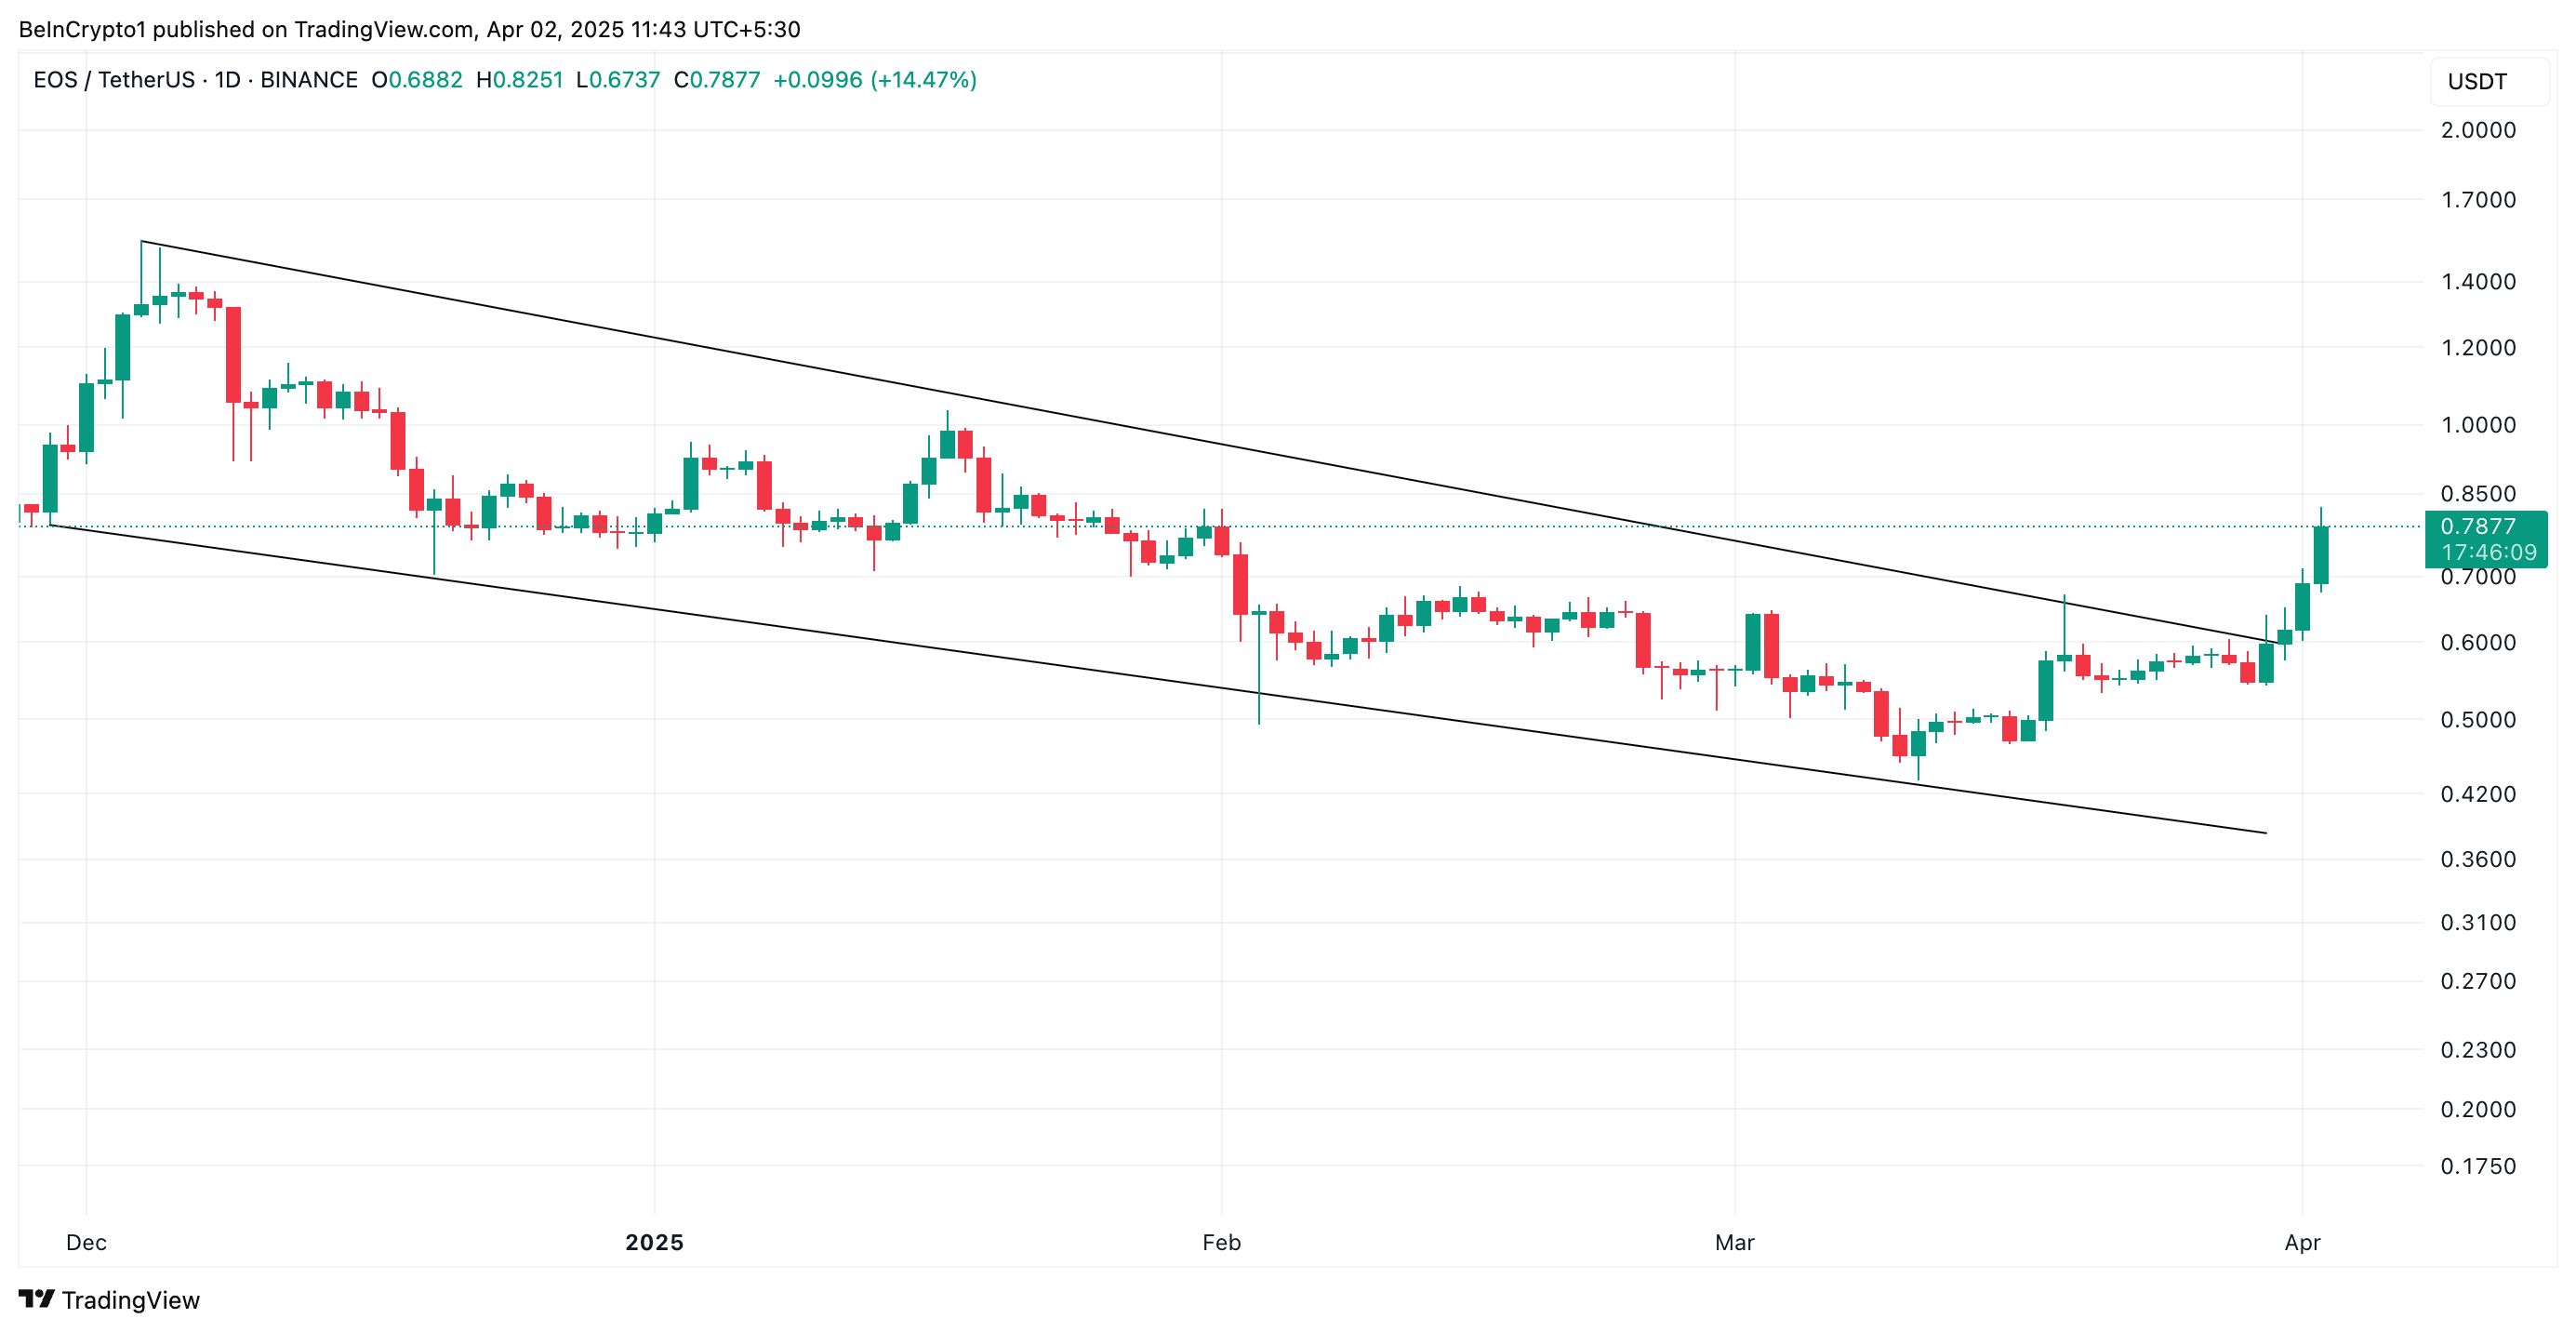
The token broke above the upper trendline of its descending channel on March 30 and has since maintained an uptrend, reaching a two-month high of $0.78 at press time.
 EOS Descending Channel. Source: TradingView
For context, this bearish channel had kept EOS trapped below the $1 mark since December 4. Between then and March 30, while trading within the channel, EOS saw its price plunge by 70%.
As the market recovered, EOS bulls regained dominance and triggered a close above the channel on March 30. Since then, EOS has maintained an uptrend, climbing 32% to trade at a two-month high of $0.78 at press time.
When an asset breaks above the upper line of its descending channel, it signals a trend reversal, indicating a shift from bearish to bullish momentum.
Overbought Signals Emerge on the Daily Chart
However, there is a catch. While EOS’ value has rocketed by double digits in the past three days, key technical indicators show overheated signals, hinting at a possible price correction in the near term.
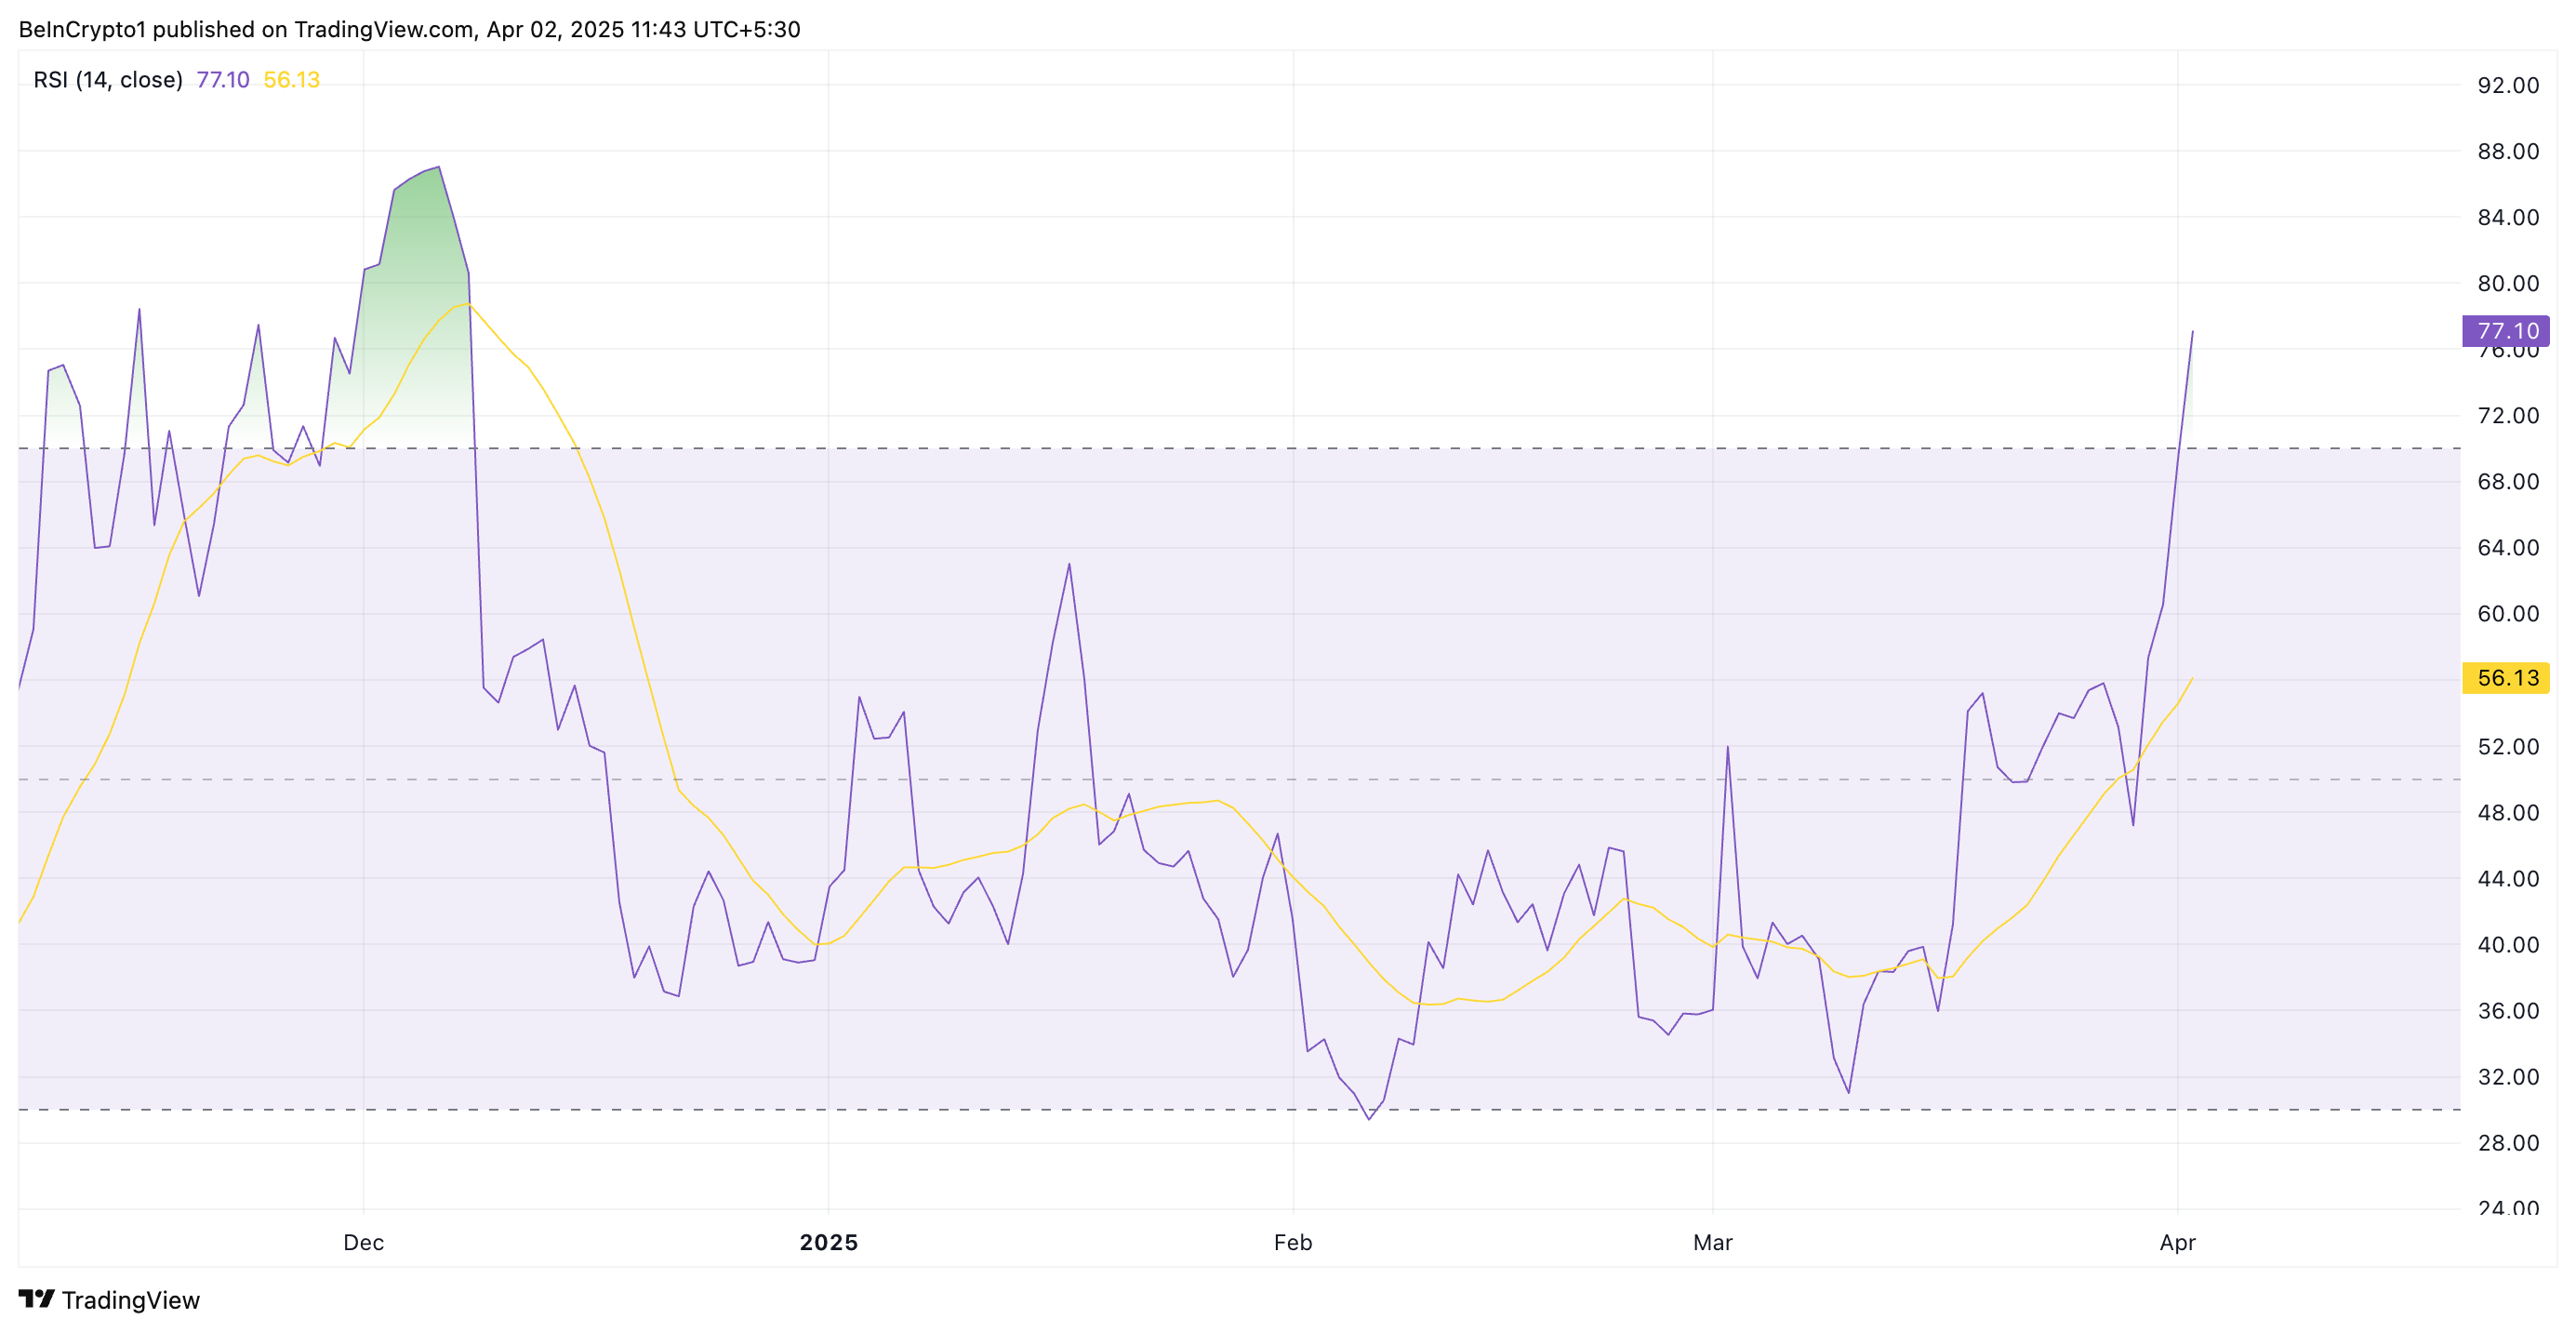
For example, at 77.10 at press time, the Relative Strength Index (RSI) readings indicate that EOS has entered the overbought territory.
 EOS RSI. Source: TradingView
The indicator measures an asset’s oversold and overbought market conditions. It ranges between 0 and 100, with values above 70 indicating that the asset is overbought and due for a decline. Conversely, values below 30 indicate that the asset is oversold and could witness a rebound.
At 77.10, EOS’ RSI flashes overbought signals. This suggests that EOS buyers may soon face exhaustion, allowing the sellers to regain dominance and trigger a correction in the current trend.
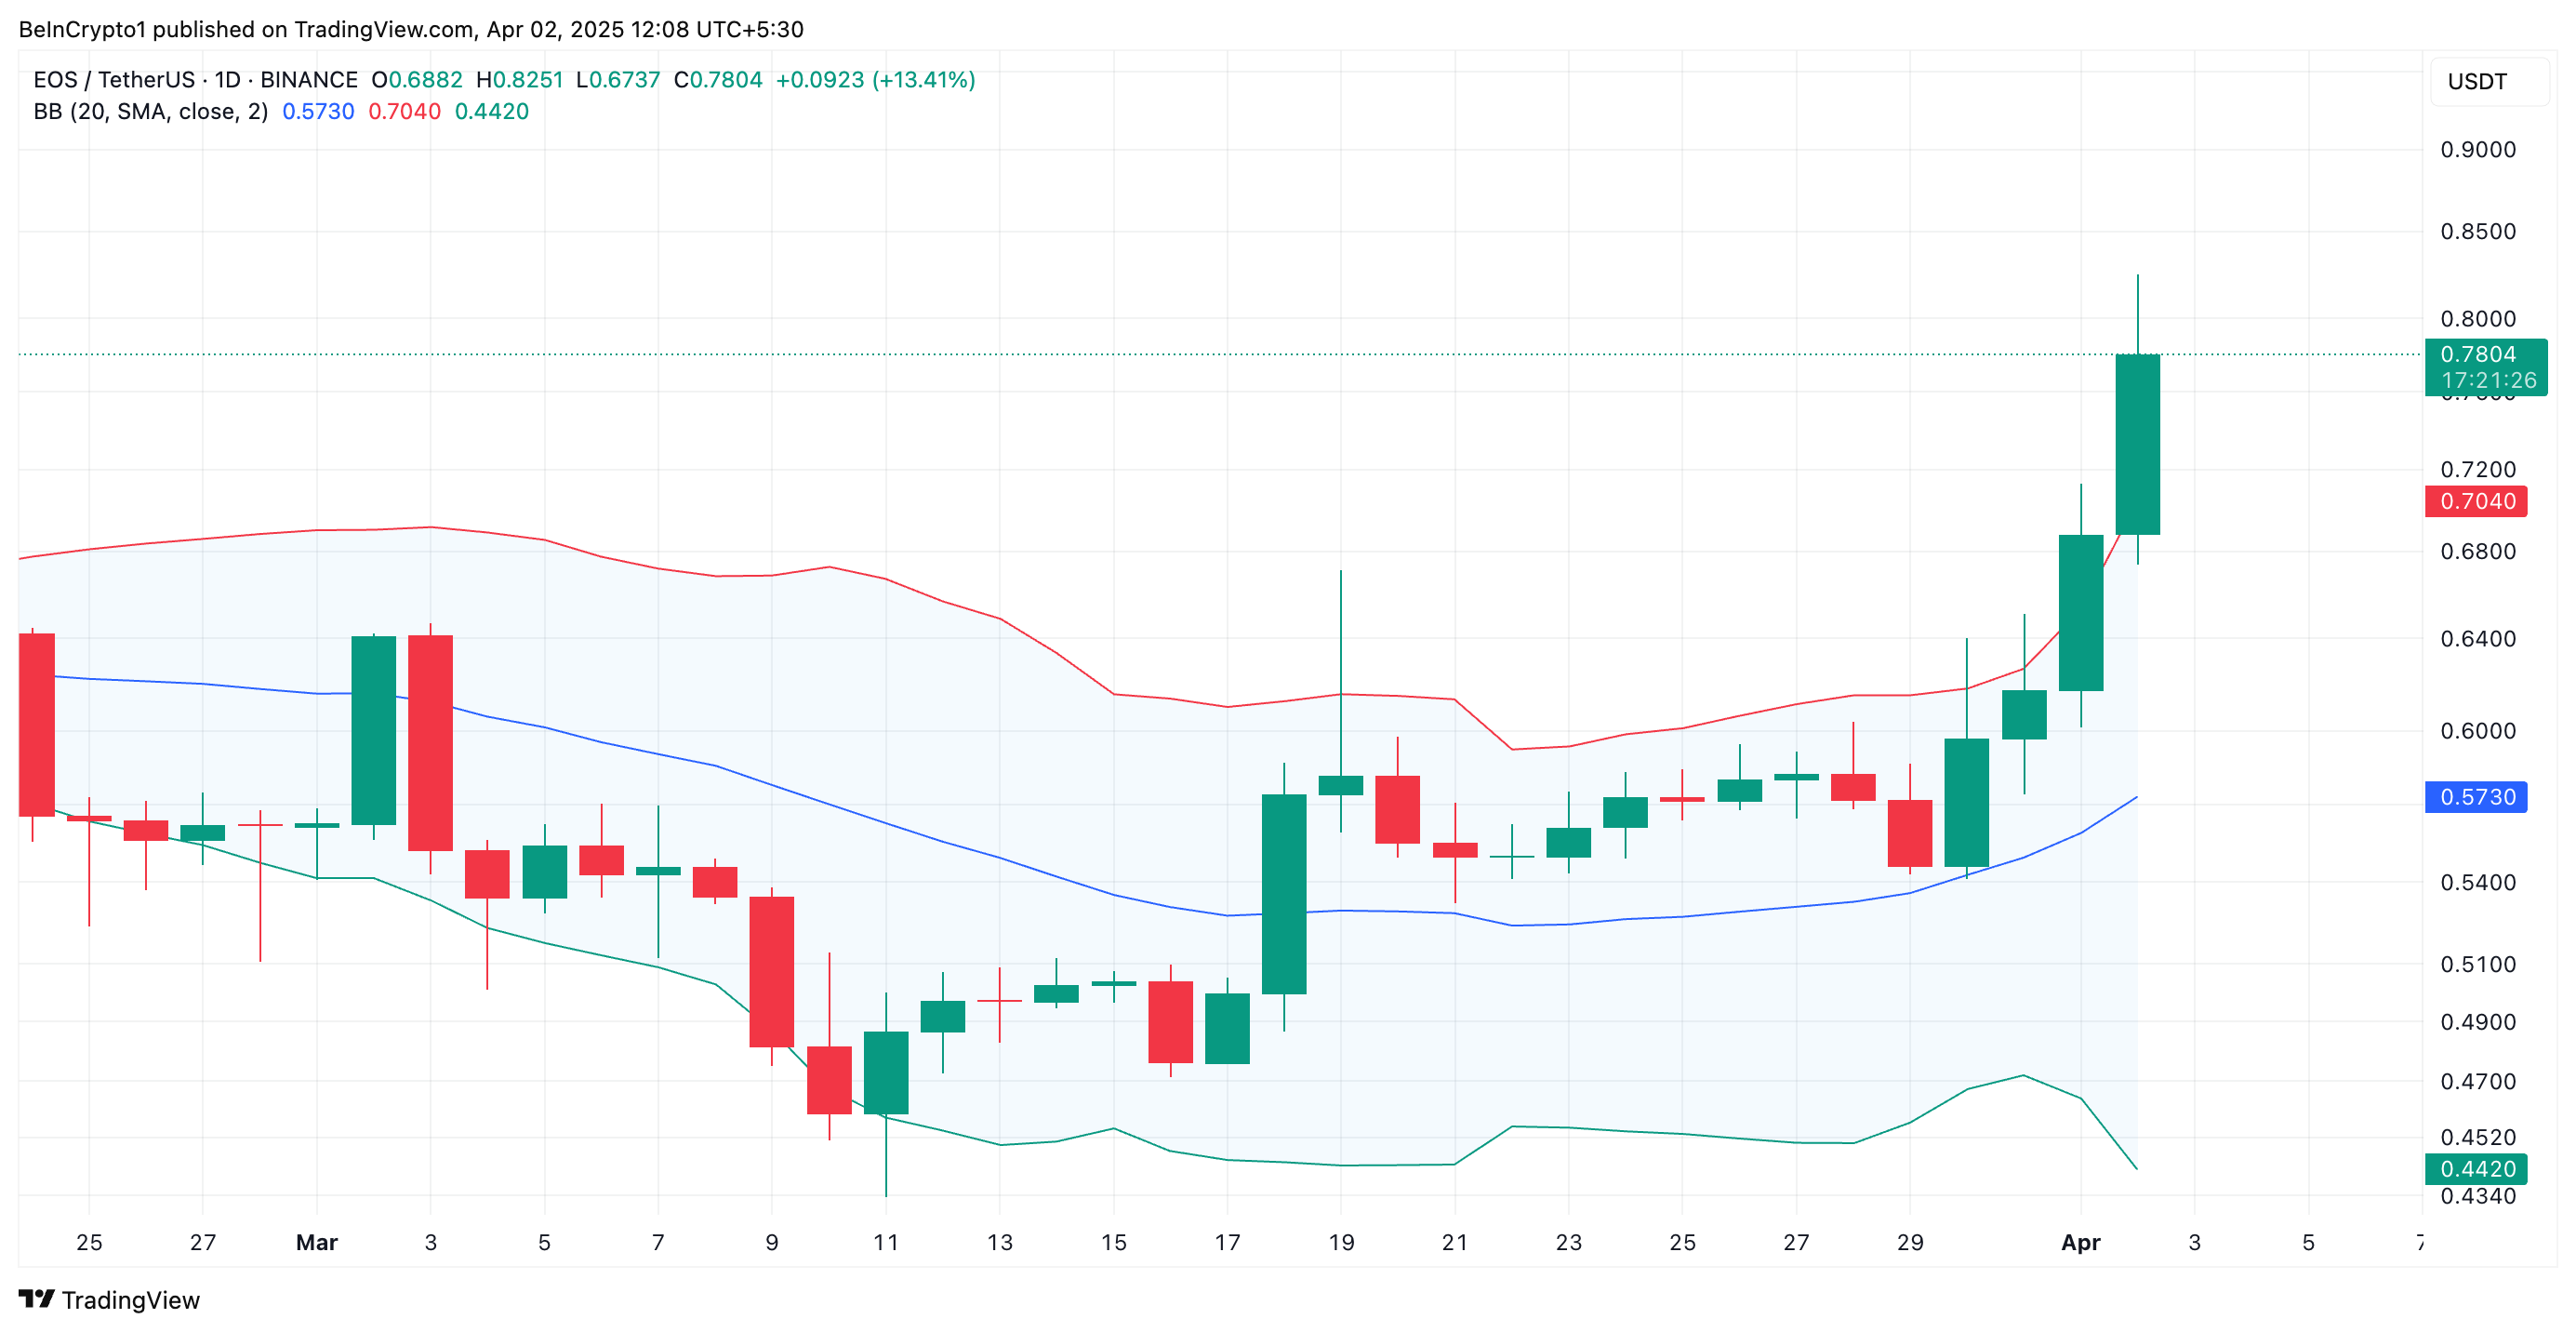
Further, EOS’ rally has pushed its price above the upper line of its Bollinger Bands (BB) indicator on the daily chart, reflecting its overbought state.
 EOS Bollinger Bands. Source: TradingView
The BB indicator measures an asset’s price volatility and identifies overbought or oversold conditions. It consists of three lines: a simple moving average (middle band) and two bands (upper and lower) representing standard deviations above and below the moving average.
When the price breaks above the upper band, it suggests a spike in volatility as the asset’s current value is moving significantly away from its average. It also indicates that the asset may be overbought and due for a price correction.
This trend confirms the likelihood of a potential pullback in EOS’ value as buyer exhaustion strengthens.
EOS Bulls Hold Firm
The technical indicators above hint at a potential cooldown. In this scenario, the altcoin could shed its recent gains and plummet toward $0.70.
However, despite the warning signs, EOS’ Aroon Up Line indicates that bullish momentum remains strong. It suggests that further upside could be possible if buying activity persists. At press time, this stands at 100%.
The Aroon indicator measures the strength and direction of a trend by tracking the time since the highest high (Aroon Up) and the lowest low (Aroon Down) over a set period.
As with EOS, when the Aroon Up line is at 100% or near it, it signals a strong uptrend. This indicates that the asset has recently hit a new high, and bullish momentum dominates. This is true of the EOS token, which trades at a two-month high and continues to see a spike in buying activity.
 EOS Price Analysis. Source: TradingView
If this trend continues, EOS could maintain its rally despite being oversold, and its price could climb to $0.81.


