
Pi Network (PI) Faces Prolonged Downtrend Despite Telegram Integration
Pi Network (PI) has been under heavy selling pressure, with its price down more than 61% over the last 30 days. Despite a recent partnership with the Telegram Crypto Wallet, PI has struggled to regain momentum, as technical indicators remain mostly bearish.
Its BBTrend has been negative for 12 consecutive days, and although the RSI has recovered slightly from oversold levels, it still sits below the neutral 50 mark. With the downtrend firmly intact and critical support levels approaching, PI’s next move will likely depend on whether buyers can step in and reverse the current trajectory.
PI BBTrend Has Been Negative For 12 Days
Pi Network (PI) continues to face bearish pressure, as reflected in its BBTrend indicator, which remains deep in negative territory at -22.34.
This is despite recent headlines about the Telegram Crypto Wallet integrating Pi Network, news that has yet to translate into sustained upward momentum.
The BBTrend hit a recent low of -41 on March 21 and has stayed negative since March 16, marking twelve consecutive days of bearish trend signals. This prolonged weakness highlights the ongoing struggle for buyers to regain control of the market.
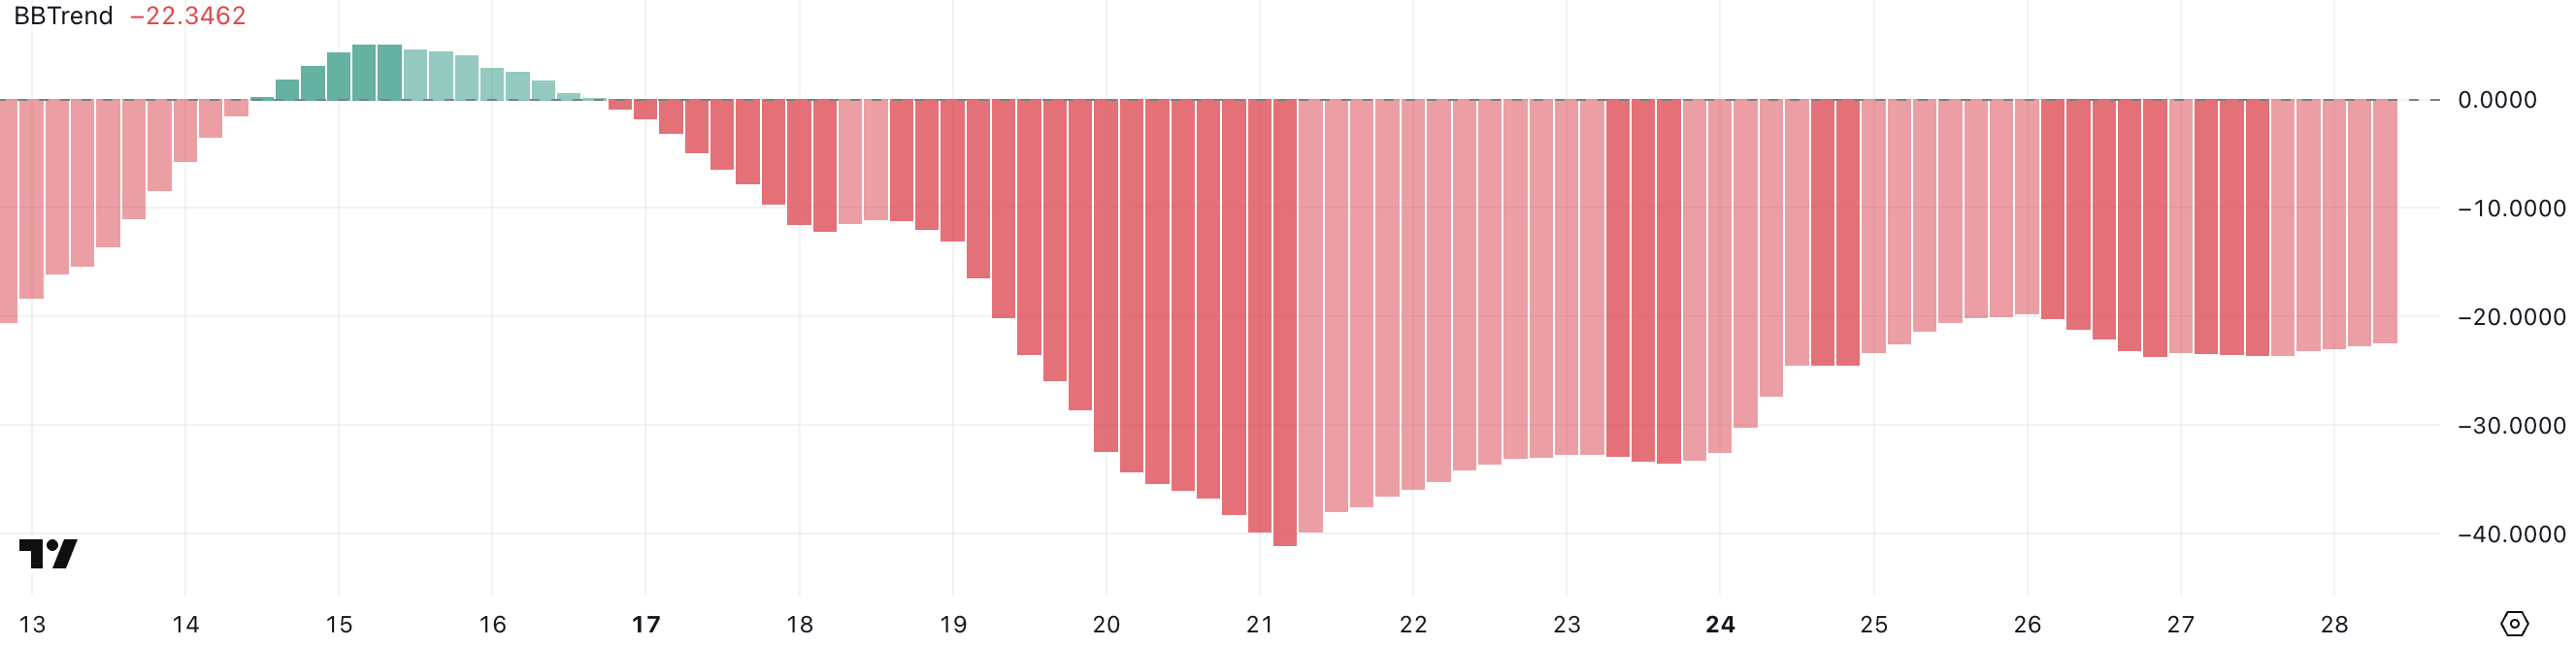 PI BBTrend. Source: TradingView.
BBTrend, or Bollinger Band Trend, is a momentum-based indicator that helps gauge the strength and direction of a trend. Positive BBTrend values indicate bullish momentum, while negative values point to bearish sentiment—the further from zero, the stronger the trend.
With PI’s BBTrend sitting at -22.34, the market remains firmly under bearish influence, even if the worst of the recent downtrend may be easing slightly from its extreme lows.
Unless this trend flips back into positive territory soon, PI’s price could remain under pressure, with buyers staying cautious despite the recent integration news.
Pi Network RSI Has Recovered From Oversold But Still Lacks Bullish Momentum
Pi Network is showing early signs of recovery in momentum, with its Relative Strength Index (RSI) rising to 40.45 after hitting 23.8 just two days ago.
While this rebound suggests a reduction in overselling pressure, PI’s RSI hasn’t crossed above the neutral 50 mark in the past two weeks—highlighting ongoing weakness in bullish conviction.
Despite the slight uptick, the market has yet to see enough strength to shift sentiment meaningfully in favor of buyers. This cautious climb could either lead to a breakout or stall into continued consolidation.
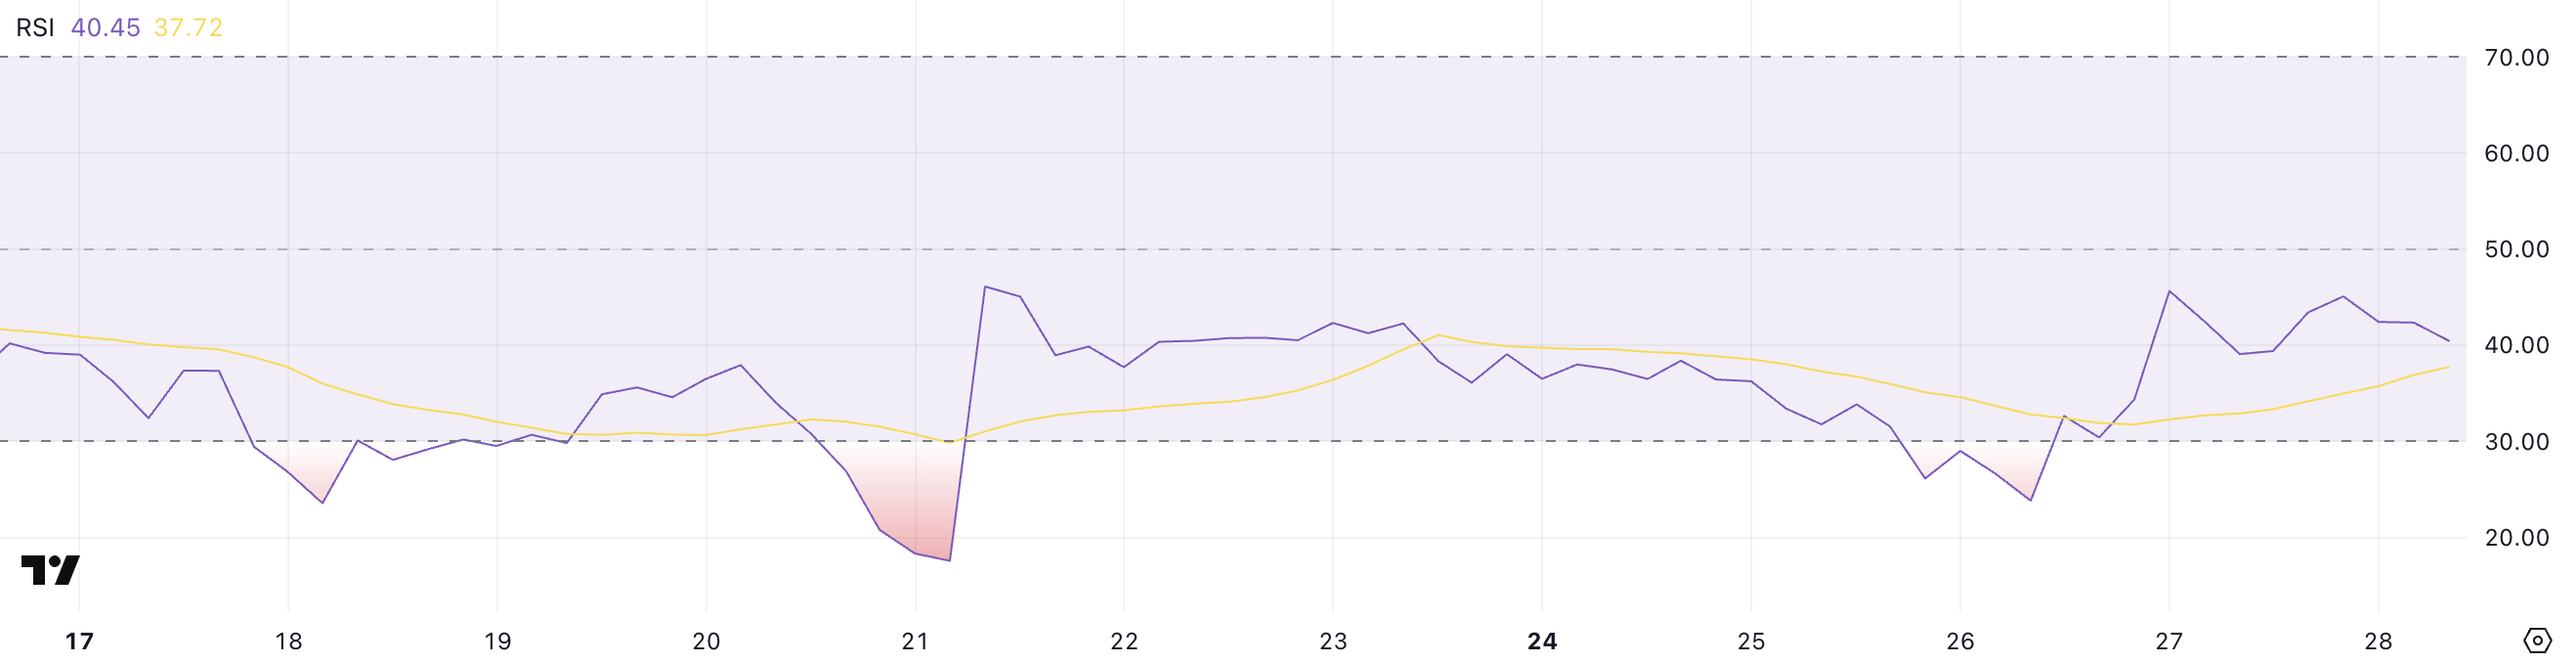 PI RSI. Source: TradingView.
The RSI, or Relative Strength Index, is a momentum oscillator that measures the speed and change of price movements. It ranges from 0 to 100, with values above 70 indicating overbought conditions and those below 30 suggesting the asset is oversold.
With PI’s RSI currently at 40.45, it’s in a neutral-to-bearish zone—no longer extremely oversold but still lacking strong buying pressure.
For a clearer trend reversal, the RSI would likely need to break above 50, which hasn’t happened in two weeks. Thus, the current move is more of a potential bottoming attempt rather than a confirmed shift.
Will PI Continue Its Correction?
PI price is currently trading within a well-established downtrend, as indicated by the alignment of its EMA (Exponential Moving Average) lines—where shorter-term EMAs remain firmly below longer-term ones.
This setup reflects persistent selling pressure, and if the correction continues, PI could revisit key support levels at $0.718, with a potential drop to $0.62 if that floor fails to hold.
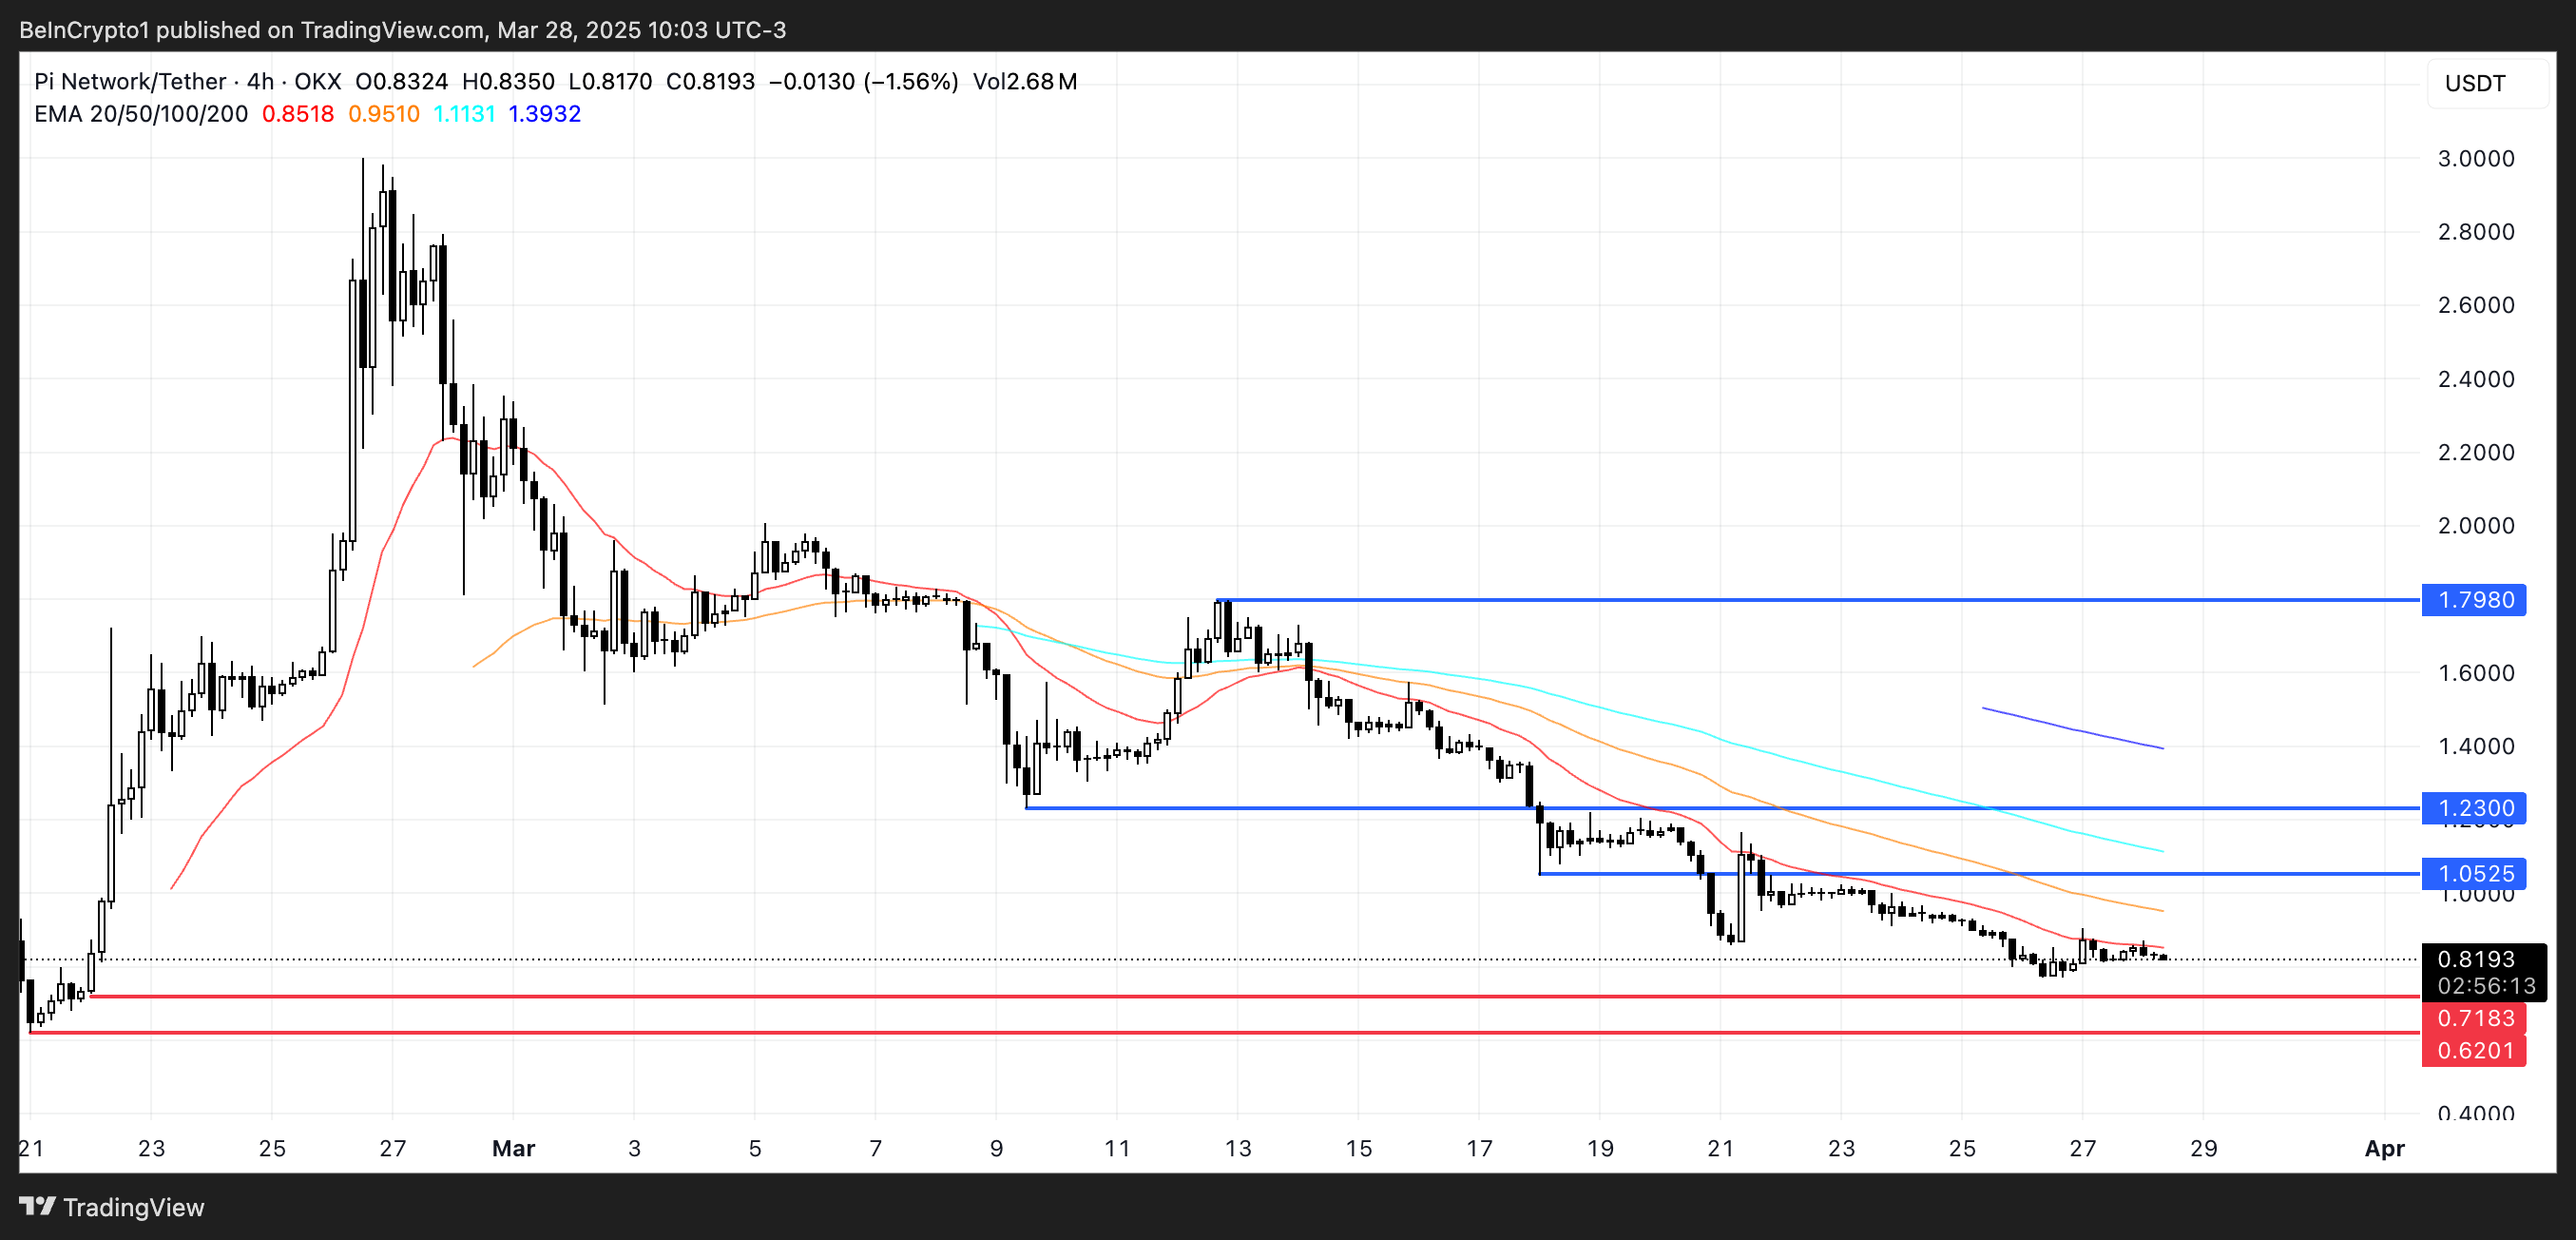 PI Price Analysis. Source: TradingView.
However, recent signs of life in the RSI hint that a short-term rebound might be brewing, offering some hope for a recovery.
If bullish momentum builds, PI could challenge resistance at $1.05 in the near term. A breakout above that level would shift sentiment and open the door for further gains, with $1.23 and even $1.79 as potential targets if the uptrend strengthens.
Recommended Articles


