


Cardano Price Forecast: ADA poised for double-digit drop amid market weakness
- Cardano price extends its decline on Friday after falling 23% this week.
- Santiment data shows ADA daily active addresses falling, indicating lower network demand.
- The technical outlook indicates ADA facing an additional double-digit decline.
Cardano (ADA) price is extending its decline by nearly 7%, trading around $0.60 on Friday after falling 23% this week. Santiment data support this decline as ADA daily active addresses are falling, and the technical outlook indicates a continued correction, with ADA potentially facing an additional double-digit decline.
Cardano bears gain momentum for a deeper dive
Cardano price faced rejection around its descending trendline (drawn by connecting multiple highs since mid-January) on February 21, and it declined 15% until Monday, closing below its weekly support level at $0.74. ADA continued its decline in the next three days by nearly 6%. At the time of writing on Friday, it continues its correction, trading around $0.59.
If ADA continues its downward momentum, it could extend the decline by nearly 16% from its current levels to retest its Feburary 3 low of $0.50.
The daily chart’s Relative Strength Index (RSI) indicator reads 28, below its oversold conditions and points downwards, indicating significant selling pressure but technically may be due for a potential reversal or bounce. However, traders should be cautious as the RSI may remain below oversold levels and continue correcting.
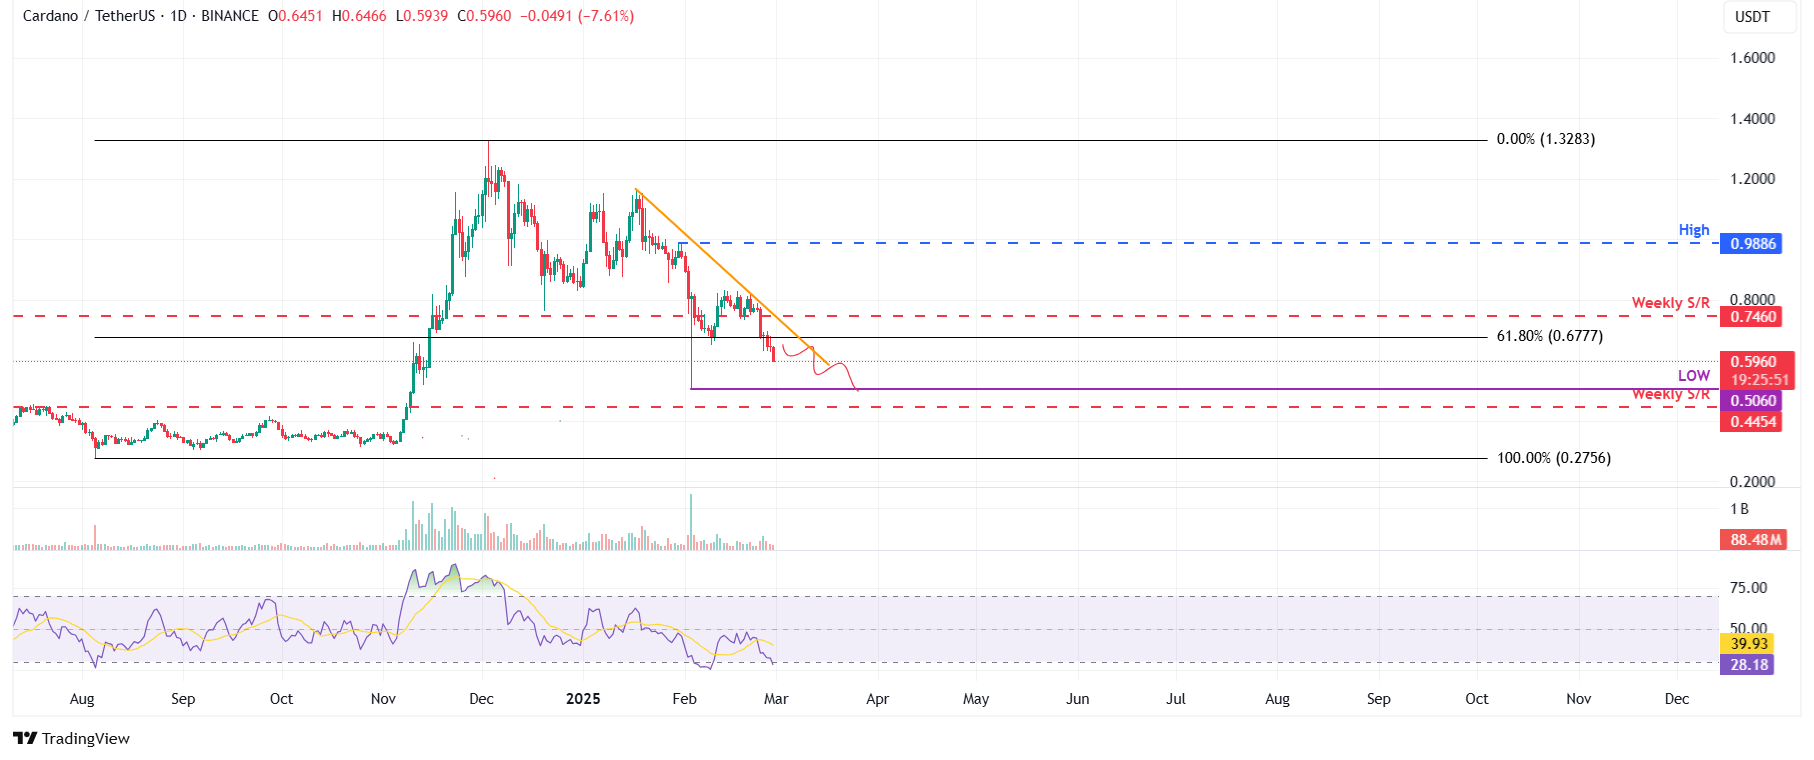
ADA/USDT daily chart
Santiment’s Daily Active Addresses index, which tracks network activity over time, also paints a bearish picture for Cardano. A rise in the metric signals greater blockchain usage, while declining addresses point to lower demand for the network.
In ADA’s case, Daily Active Addresses fell from 49,585 in early February to 24,609 on Friday, extending a downtrend starting mid-January. This indicates that demand for ADA’s blockchain usage is decreasing, which doesn’t bode well for Cardano’s price.
 [10.08.00, 28 Feb, 2025]-638763181648188515.png)
ADA daily active addresses chart. Source: Santiment
Related news
Recommended Articles


