
Ethereum Spot ETF Outflows Reach 30-Day High as Price Approaches Yearly Low
Donald Trump’s trade war tariffs have triggered significant volatility in crypto markets this week, leading to a decline in Ethereum’s value. At press time, the leading altcoin is trading at $2,347, a low last recorded in November.
With prices dropping, ETH investors have become increasingly bearish, removing their capital from the investment funds backed by the altcoin.
ETH Spot ETF Outflows Surge to 30-Day High
According to data from SosoValue, net outflows from ETH spot ETFs climbed to a 30-day high of $94.27 million on February 26. This marked the third-highest single-day net outflows since the beginning of the year, and it followed the coin’s price decline to an intraday low of $2,251.
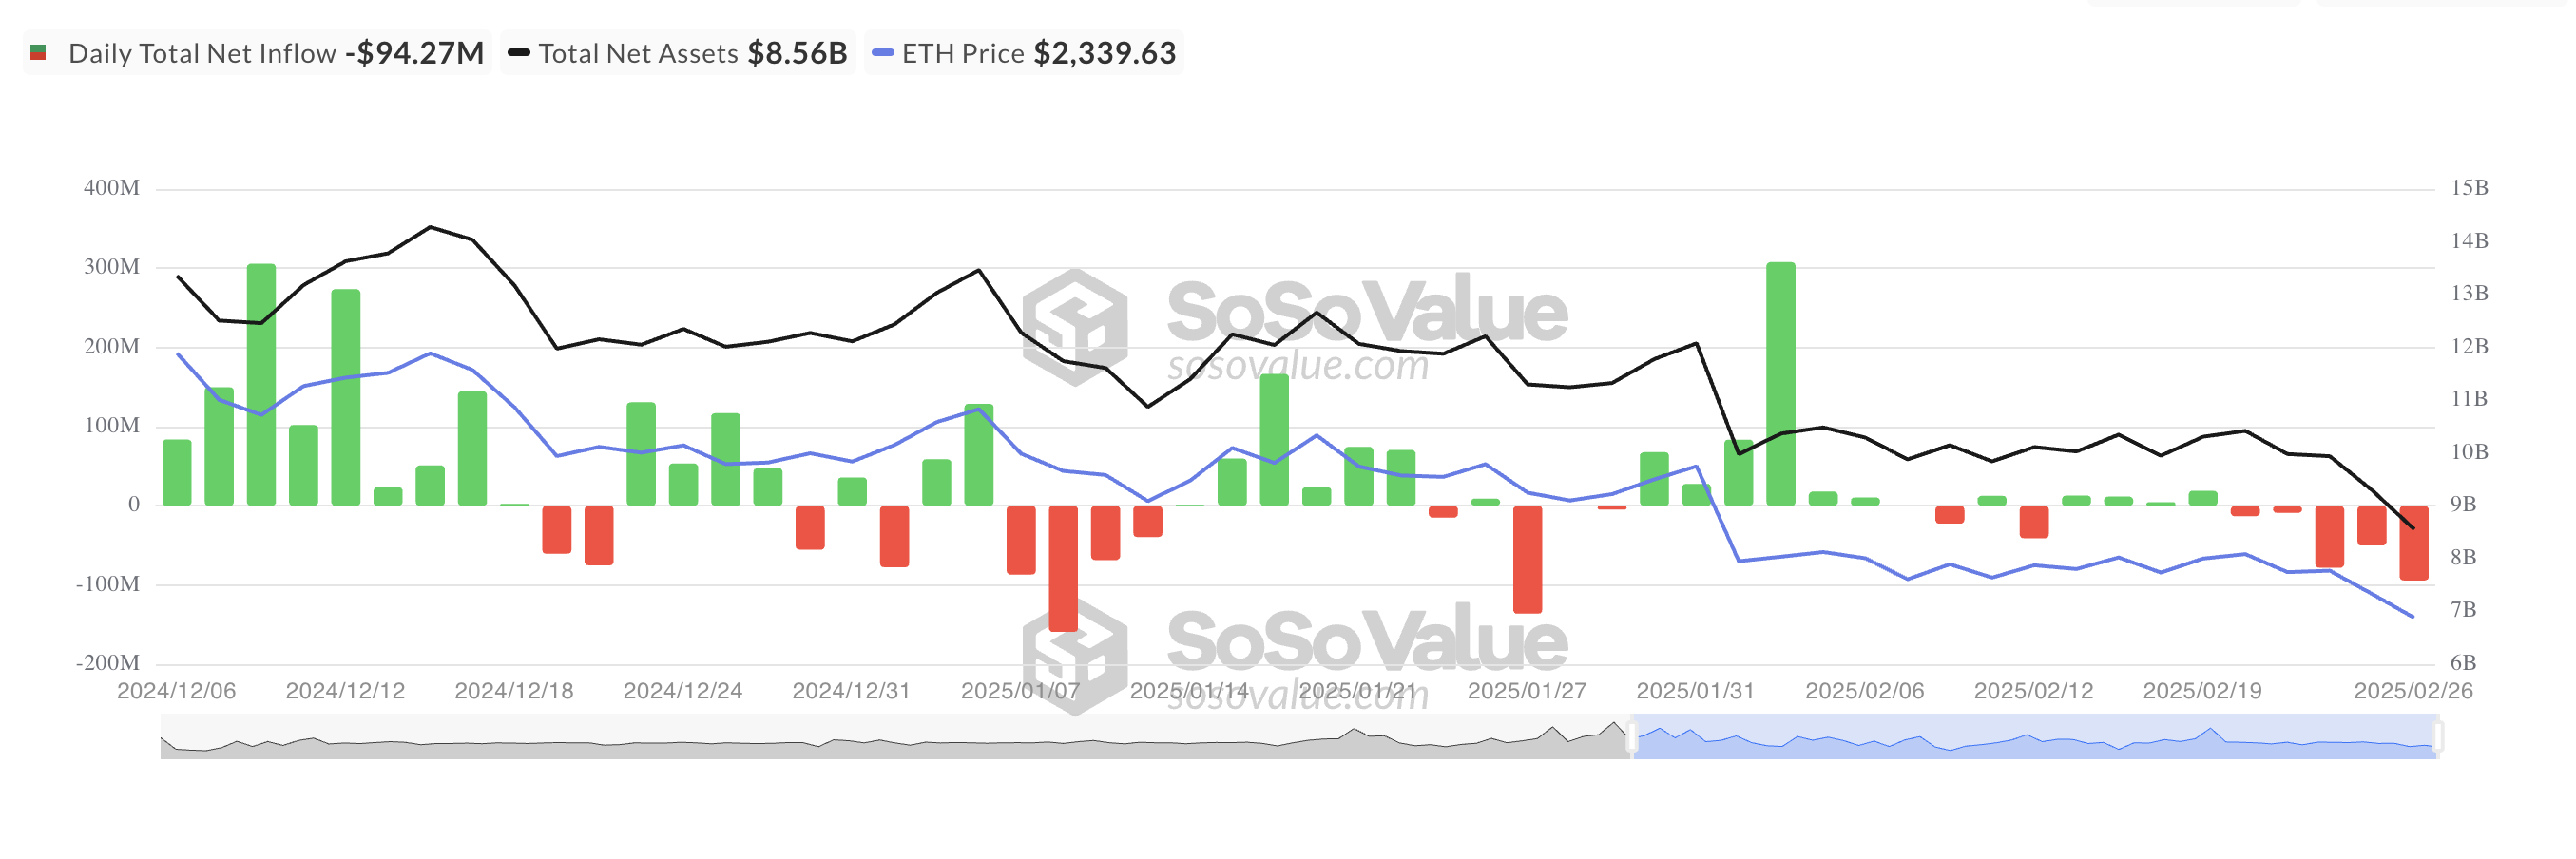 Total Ethereum Spot ETF Net Inflow. Source: SoSoValue
On Wednesday, Blackrock ETF ETHA had a single-day net outflow of $69.76 million, bringing the total net amount in US dollars that has flowed into the fund since it was first listed to $4.33 billion. Fidelity’s FETH saw the second-largest net outflow on that day, totaling $18.38 million, bringing its cumulative net inflow to $1.51 billion.
When ETH ETFs see net outflows like this, investors are withdrawing more funds than they put in, signaling reduced confidence or profit-taking. For context, ETH spot ETF investors have steadily removed their capital from these funds since February 21. Persistent outflows like this indicate bearish sentiment and put more downward pressure on ETH’s price.
Notably, ETH’s falling open interest in its futures market highlights the market-wide bearish bias against it. At press time, this sits at $20.58 billion, declining by 20% since the beginning of this week. During the same period, ETH’s price has plummeted by 17%.
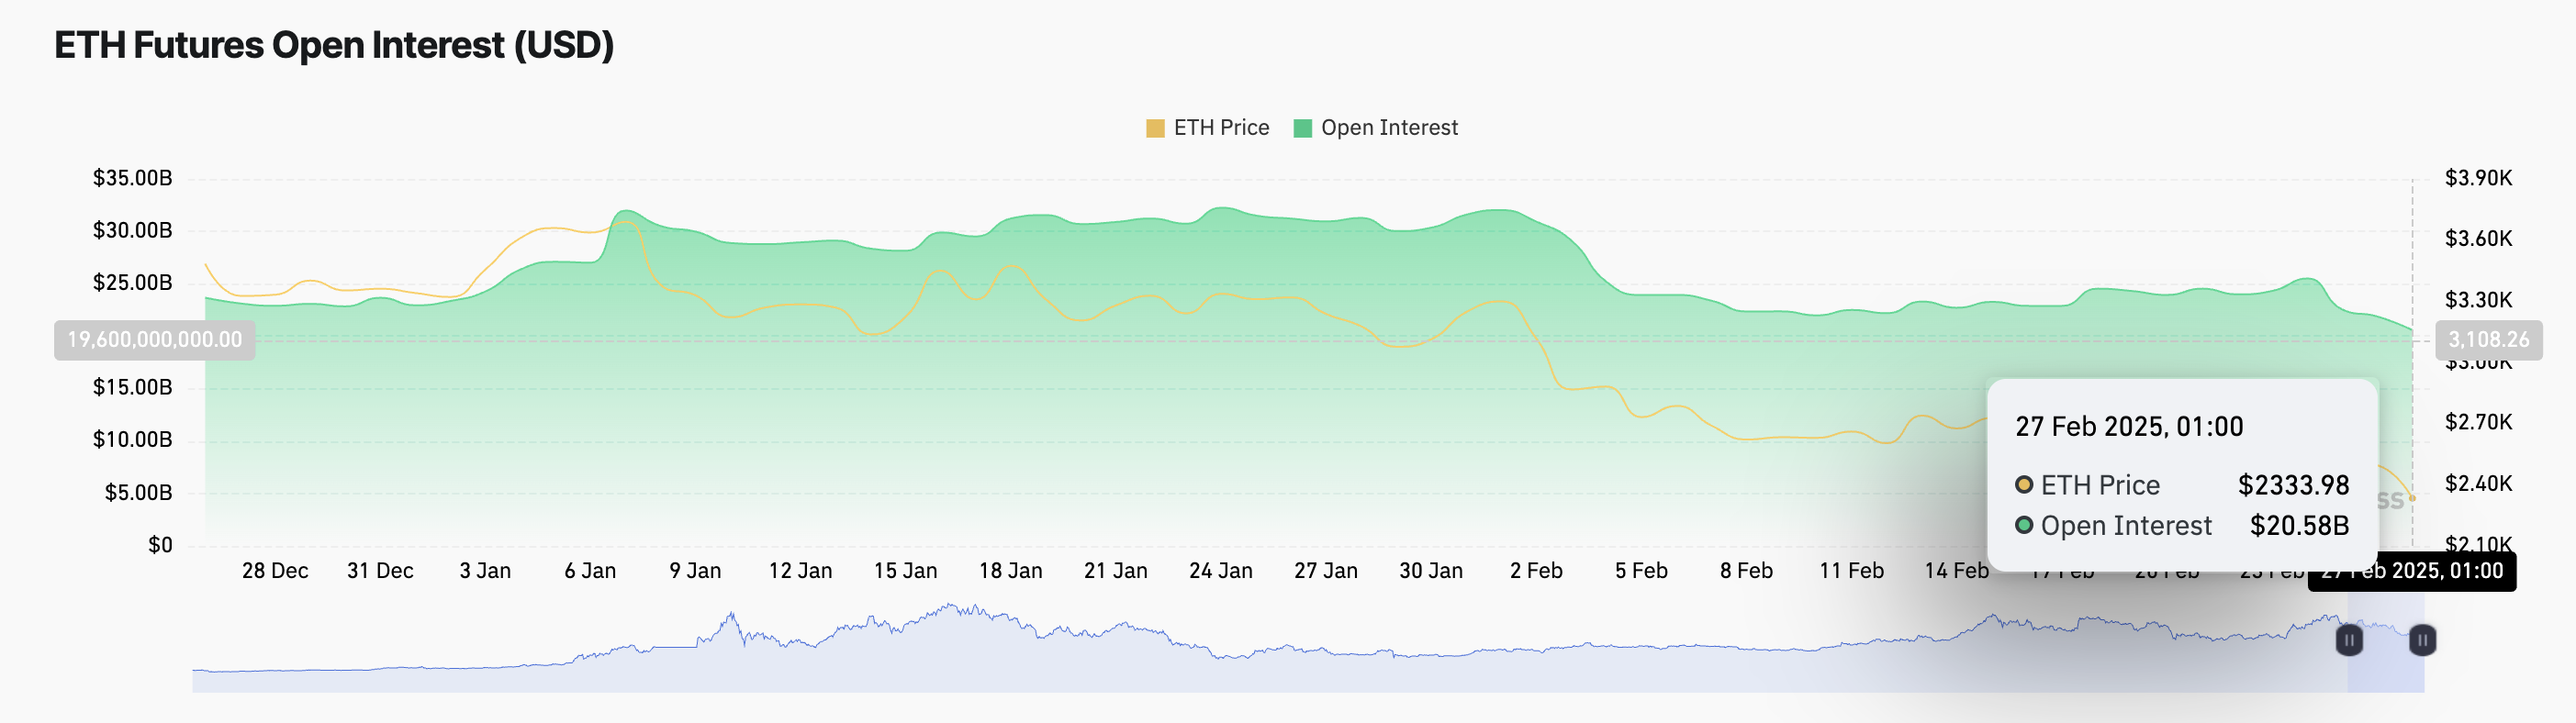 Ethereum Open Interest. Source: Coinglass
An asset’s open interest measures the total number of outstanding derivative contracts, like futures or options, that have not been settled. When it falls alongside the asset’s price, traders are closing positions rather than opening new ones.
This signals weakening market interest in ETH and hints at the likelihood of a sustained decline in its value.
ETH Breaks Key Support, Eyes Yearly Low of $2,150
On the daily chart, ETH currently trades below the lower line of the horizontal channel it has trended within for most of February. This indicates a strong support level breach and hints at potential further downside. In this scenario, ETH’s price could revisit its year-to-date low of $2,150.
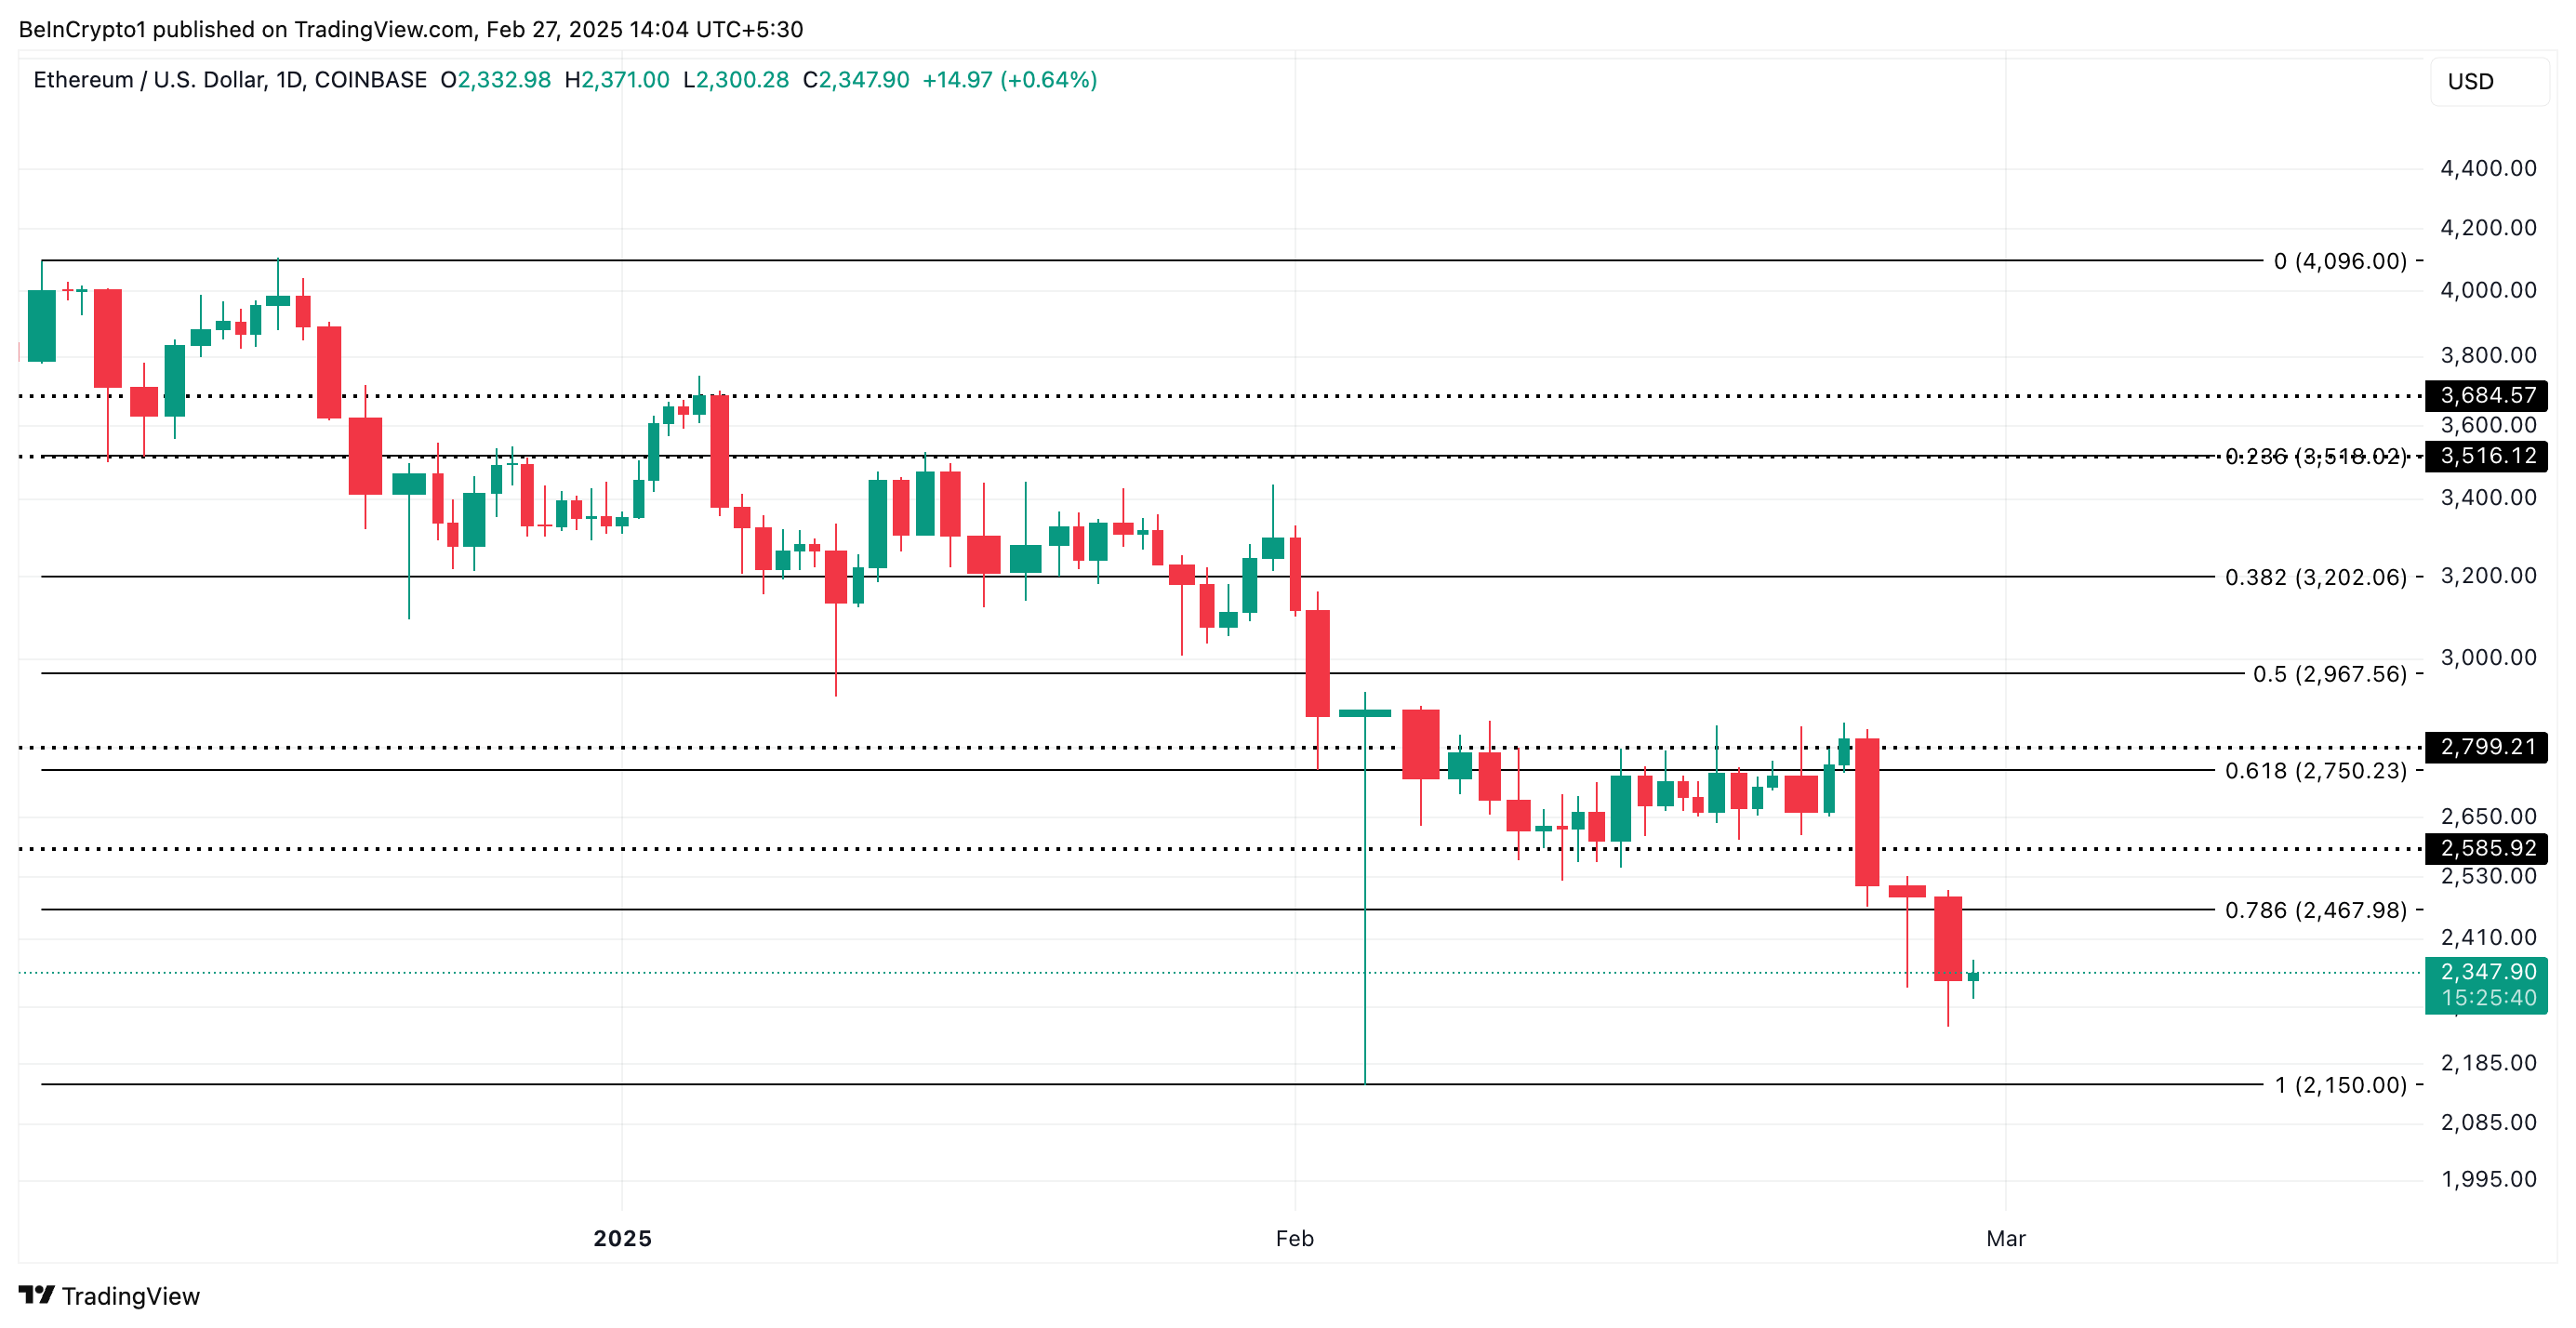 Ethereum Price Analysis. Source: TradingView
Conversely, if market sentiment improves and new demand trickles into the ETH market, it could drive its value to $2,467. A break above this resistance could send ETH’s price up to $2,585.
Recommended Articles


