
Bitcoin Price Forecast: BTC risk-on asset rather than a pure store of value
- Bitcoin price extends its recovery, trading above $98,000 on Tuesday after gaining 1% on the previous day.
- Bifinex report highlights recent trends suggesting that BTC is increasingly being treated as a risk-on asset rather than a pure store of value.
- Traders should be cautious as BTC expects volatility in the upcoming US CPI data release.
Bitcoin (BTC) extends its recovery, trading above $98,000 at the time of writing on Tuesday after gaining 1% on the previous day. Bifinex report highlights recent trends suggesting that BTC is increasingly being treated as a risk-on asset rather than a pure store of value. The upcoming US Consumer Price Index (CPI) data release for January could bring volatility to Bitcoin, and traders should watch for it.
Bitcoin is treated as a risk-on asset rather than a pure store of value — Bitfinex report
Bifinex ‘Alpha’ report on Monday highlights recent trends suggesting that BTC is increasingly being treated as a risk-on asset rather than a pure store of value.
The report explains that Bitcoin’s correlation with the S&P 500 remains strong, while its relationship with Gold has weakened. While Bitcoin has gained 3.5% so far this year, Gold is up 9%, hitting a new all-time high of $2,880 per ounce on Tuesday. The Gold rally has added $1.5 trillion to its market cap this year, dwarfing Bitcoinʼs $66.5 billion increase. This divergence is driven by institutional and sovereign wealth fund purchases, which have largely bypassed Bitcoin due to regulatory concerns and volatility.
However, a shift may be underway. Over $196 billion worth of Bitcoin is now held by Exchange Traded Funds (ETFs), public and private companies, and even nation-states. With central banks expanding money supply and fiat devaluation risks rising, Bitcoinʼs fixed-supply narrative is becoming increasingly attractive.
“BTCʼs range-bound behavior to persist soon, with potential downside pressure if macro conditions worsen. However, in our view, even as gold continues to rise and institutional sentiment around Bitcoin shifts, the long-term store-of-value narrative for Bitcoin remains intact”, says the report.
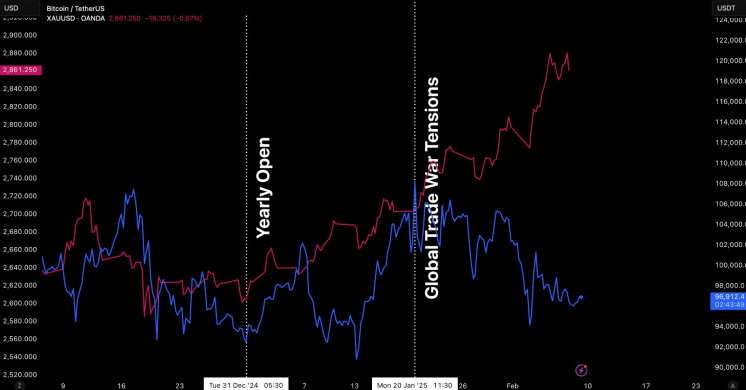
BTC vs Gold performance since 2025 Open chart. Source: Bitfinex & Forex.com
In an exclusive interview with Bitfinex, analysts told FXStreet, “Bitcoin has been trading within a broad sideways channel between approximately $91,000 and $107,000 since November, and it is currently positioned near the middle of this range.”
The analyst continued that as long as BTC remains within this channel, price fluctuations alone do not necessarily indicate a clear trend direction. However, when examining the broader technical picture, Bitcoin appears to be forming a pattern known as a flag, typically considered a continuation pattern in technical analysis. If this pattern holds, it could signal the continuation of Bitcoin’s long-term bullish trend, suggesting that the recent bounce may be more than just a short-term reaction to market sentiment.
Bitcoin could expect volatility ahead of US CPI data release
Bitcoin price recovery continues on Tuesday, trading above $98,000 after reaching a low near the $90,000 psychological level and rebounding last week.
“Speculations that the Federal Reserve (Fed) will hold interest rates steady in the wake of a still resilient US labor market and inflationary concerns lift the US Dollar (USD) to over a one-week high,” reports FXStreet analyst Haresh Menghani.
Moreover, on Monday, US President Donald Trump signed two proclamations, introducing 25% tariffs on metals and ending all exclusions on steel and aluminum tariffs, which were first imposed during his first tenure from 2016 to 2020. In addition, Trump told reporters that he would announce reciprocal tariffs on other countries in the next two days.
Menghani continued that, commenting on Middle East tensions; Trump said that Hamas should release all hostages held by midday Saturday, or he would propose canceling the Israel-Hamas ceasefire and “let all hell break loose.”
The US Dollar advanced to over a one-week high amid expectations that Trump’s protectionist policies would reignite inflation in the US and force the Federal Reserve to stick to its hawkish stance and keep interest rates unchanged for longer. This would support the Greenback and cause risky assets like Bitcoin to decline.
Bitcoin Price Forecast: Recover above $100,000 or dip below $90,000
Bitcoin price faced rejection, closed below the $100,000 psychological level and declined nearly 2% in the previous week. However, BTC recovered slightly by 1% on Monday. At the time of writing on Tuesday, it continues to recover and trades at around $98,300.
If BTC continues its correction, it could extend the decline to test its psychologically important level of $90,000.
The Relative Strength Index (RSI) on the daily chart reads 47 after being rejected from its neutral level of 50 last week, indicating slightly bearish momentum. Moreover, the Moving Average Convergence Divergence (MACD) showed a bearish crossover, hinting at further correction ahead.
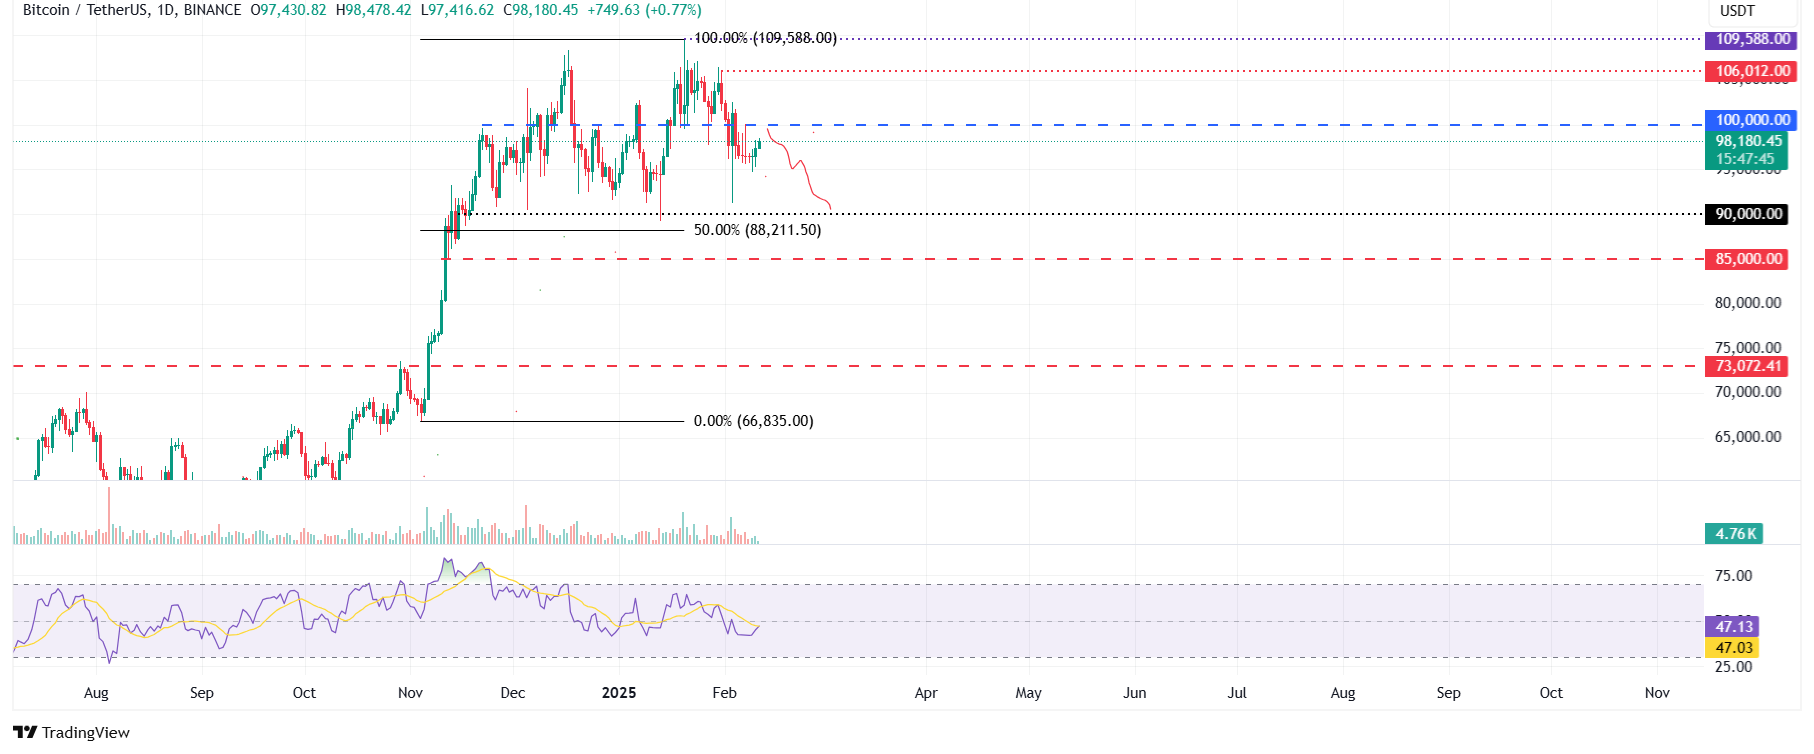
BTC/USDT daily chart
However, if BTC recovers and finds support around $100,000, it would extend the recovery to retest its January 31 high of $106,012.
Bitcoin, altcoins, stablecoins FAQs
Bitcoin is the largest cryptocurrency by market capitalization, a virtual currency designed to serve as money. This form of payment cannot be controlled by any one person, group, or entity, which eliminates the need for third-party participation during financial transactions.
Altcoins are any cryptocurrency apart from Bitcoin, but some also regard Ethereum as a non-altcoin because it is from these two cryptocurrencies that forking happens. If this is true, then Litecoin is the first altcoin, forked from the Bitcoin protocol and, therefore, an “improved” version of it.
Stablecoins are cryptocurrencies designed to have a stable price, with their value backed by a reserve of the asset it represents. To achieve this, the value of any one stablecoin is pegged to a commodity or financial instrument, such as the US Dollar (USD), with its supply regulated by an algorithm or demand. The main goal of stablecoins is to provide an on/off-ramp for investors willing to trade and invest in cryptocurrencies. Stablecoins also allow investors to store value since cryptocurrencies, in general, are subject to volatility.
Bitcoin dominance is the ratio of Bitcoin's market capitalization to the total market capitalization of all cryptocurrencies combined. It provides a clear picture of Bitcoin’s interest among investors. A high BTC dominance typically happens before and during a bull run, in which investors resort to investing in relatively stable and high market capitalization cryptocurrency like Bitcoin. A drop in BTC dominance usually means that investors are moving their capital and/or profits to altcoins in a quest for higher returns, which usually triggers an explosion of altcoin rallies.
Recommended Articles


