
Pi Network Price Prediction 2025-2031: Will PI Price Hit $100?
Key Takeaways:
- Pi price faces bearish pressure below $40.
- Our Pi price forecast expects Pi price to surge to a maximum level of $50 in 2025.
- In 2030, Pi price prediction expects Pi price to record a maximum level of $402.25.
The price of Pi Network has fluctuated after the developers pushed back the KYC verification deadline from January 31 to February 28. This delay, the third of its kind, was explained as a way to give more users time to transfer their tokens to the mainnet.
Users who don’t transfer their tokens by the deadline will have an additional six months to move any tokens mined during the last six months.
There’s growing concern because Pi Network’s developers often miss their deadlines, which suggests that the mainnet might not launch this quarter. If it doesn’t, the value of Pi could drop even more.
This article will explore the details of the Pi Network and examine potential future price movements of its native token, $Pi, to provide a comprehensive Pi price prediction.
Overview
| Cryptocurrency | Pi Network |
| Ticker Symbol | Pi |
| Price | $40.14 |
| Price Change 24H | +1.2% |
| Market Cap | $2.72 Billion |
| Circulating Supply | 68M |
| Trading Volume 24H | $161.5K |
| All-Time High | $330 |
| All-Time Low | $0.179 |
Pi Network Price Prediction: Technical Analysis
| Metric | Value |
| Current Price | $ 40.14 |
| Price Prediction | $ 130.32 (229.53%) |
| Fear & Greed Index | 44 (Fear) |
| Sentiment | Bearish |
| Volatility | 6.38% |
| Green Days | 14/30 (47%) |
| 50-Day SMA | $ 47.49 |
| 200-Day SMA | $ 45.17 |
| 14-Day RSI | 37.53 |
Pi Price Analysis: Pi faces bearish pressure below $40
- Pi price analysis shows bearish pressure below $40.
- Resistance for Pi is at $40.8.
- Support for Pi/USDT is at $36.6.
Pi price analysis 1-day chart: Pi continues to struggle below $40
Analyzing the daily price chart of the Pi token, Pi witnessed a surge in selling pressure after buyers failed to send the price above $40. Over the last 24 hours, Pi’s price has been consolidating within a bearish zone. The 24-hour volume surged to $100.9K, increasing interest in trading today. Pi is trading at $38.7, decreasing by over 2.5% in the last 24 hours.

The RSI-14 trend line has declined from its previous level and currently hovers around 38, showing that bears are slowly gaining momentum in the price. The SMA-14 level suggests downward volatility in the next few hours.
Pi/USDT 4-hour price chart: Bulls aim for a hold above EMA lines
The 4-hour Pi price chart suggests Pi continues to bearish activity near EMA lines, creating a negative sentiment on the price chart. Currently, buyers aim for a surge by holding the price above the EMA20 trend line.

The BoP indicator trades in a positive region at 0.54, hinting that buyers are trying to build pressure near resistance levels and boost an upward correction.
Additionally, the MACD trend line has formed green candles above the signal line, and the indicator aims for positive momentum, strengthening bullish positions.
Pi Network Price Prediction: Levels and Action
Daily Simple Moving Average (SMA)
| Period | Value | Action |
| SMA 3 | $ 43.80 | SELL |
| SMA 5 | $ 41.86 | SELL |
| SMA 10 | $ 43.11 | SELL |
| SMA 21 | $ 43.86 | SELL |
| SMA 50 | $ 47.49 | SELL |
| SMA 100 | $ 51.74 | SELL |
| SMA 200 | $ 45.17 | SELL |
Daily Exponential Moving Average (EMA)
| Period | Value | Action |
| EMA 3 | $ 44.19 | SELL |
| EMA 5 | $ 45.46 | SELL |
| EMA 10 | $ 47.00 | SELL |
| EMA 21 | $ 48.54 | SELL |
| EMA 50 | $ 50.53 | SELL |
| EMA 100 | $ 49.70 | SELL |
| EMA 200 | $ 46.42 | SELL |
What to expect from Pi price analysis next?
The hourly price chart confirms bears are making efforts to prevent the Pi price from an immediate surge. However, if the Pi price successfully breaks above $40.83, it may surge higher and touch the resistance at $46.98.

If bulls cannot initiate a surge, Pi’s price may drop below the immediate support line at $36.64, resulting in a correction to $31.04.
Is Pi A Good Investment?
Pi Network, with over 35 million active users and a unique mining system, aims to empower everyday people. It uses its blockchain to secure transactions through a system that rewards mobile users and supports a complete Web 3.0 environment. This allows community developers to create decentralized applications (dApps).
Why is the Pi Price Down Today?
Due to the market wide selling pressure, sellers are strongly dominating the price chart above $40.
Will Pi Price Reach $500?
In recent months, the Pi network expanded its offerings and established multiple partnerships. If buying demand continues to increase in the coming years, its price might surpass the $500 mark.
Will Pi Reach $1000?
Depending on the current market sentiment, the PI price might take several years to reach the $1000 milestone. We expect the Pi price to achieve $1000 by 2033.
Will Pi Reach $10000?
$10000 is a distant dream for Pi price. However, if everything remains in favor of the altcoin market, we might even see the Pi price hitting $1K.
Is Pi a Good Long-Term Investment?
The mainnet for Pi Network might be launched in the first quarter of 2025, which is about one or two months away. It seems that Pi Network has met two of the three requirements needed for the launch. It’s likely that at least 10 million users have already moved their coins to the mainnet. The developers have also said that the third requirement, involving external factors, has been met.
However, one requirement is still unfulfilled: having mainnet-ready apps. They needed at least 100 apps ready for the mainnet, but currently, there are only about 80. It’s not clear if falling short on this one requirement will delay the launch of the mainnet.
However, considering its roadmap, Pi network can be a good investment option in the long term.
Recent Pi News/Opinions
- On February 5, Pi Network reached a major milestone by successfully migrating 10 million accounts to its Mainnet. The Pi Core Team is encouraging users to complete the Know Your Customer (KYC) verification and Mainnet migration to avoid losing their Pi Coin. Additionally, the deadline for the Grace Period has been extended to February 28, 2025.
Pi Price Prediction February 2025
If the altcoin market witnesses a surge in buying pressure this month, we might see a rebound in the Pi price. In February, we expect Pi’s price to record a minimum of $36 and a maximum of $50. The average price is expected to be around $43.
| Pi Price Prediction | Potential Low | Potential Average | Potential High |
| Pi Price Prediction February 2025 | $36 | $43 | $50 |
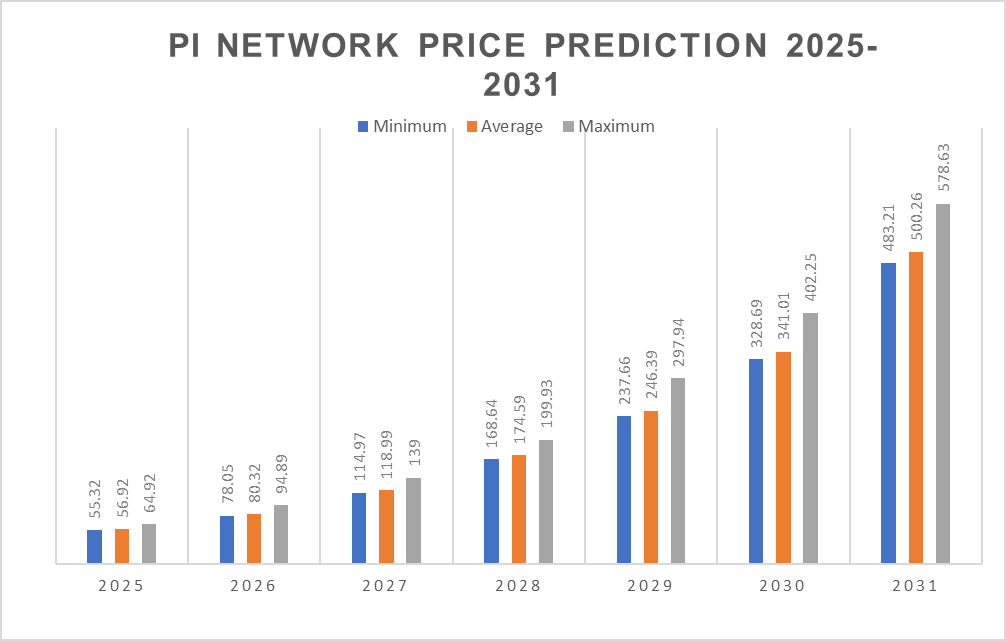
Pi Price Prediction 2025
Due to the impact of Bitcoin’s halving, Bitcoin and leading altcoins could reach new highs in 2025. However, some believe the event’s predictability changes because of crypto’s current buying demand.
Technical analysis indicates Pi is predicted to reach at a minimum level of $55.32 in 2025. The Pi price can reach a maximum level of $64.92 with the average price of $56.92 throughout 2025.
| Pi Price Prediction | Potential Low ($) | Potential Average ($) | Potential High ($) |
| Pi Price Prediction 2025 | 55.32 | 56.92 | 64.92 |
Pi Price Predictions 2026-2031
| Year | Minimum Price ($) | Average Price ($) | Maximum Price ($) |
| 2026 | 78.05 | 80.32 | 94.89 |
| 2027 | 114.97 | 118.99 | 139 |
| 2028 | 168.64 | 174.59 | 199.93 |
| 2029 | 237.66 | 246.39 | 297.94 |
| 2030 | 328.69 | 341.01 | 402.25 |
| 2031 | 483.21 | 500.26 | 578.63 |
Pi Price Prediction 2026
The price of Pi is expected to have a minimum value of $78.05 in 2026. The maximum price could reach up to $94.89, with an average trading price of about $80.32 throughout the year.
Pi Price Prediction 2027
In 2027, the price of 1 Pi is anticipated to start at a minimum of $114.97. It could climb to a maximum of $139.00, with the average price hovering around $118.99 for the year.
Pi Price Prediction 2028
For 2028, Pi’s price is predicted to start at a minimum value of $168.64. The price may peak at $199.93, with an average value of $174.59 throughout the year.
Pi Price Prediction 2029
The lowest price for Pi in 2029 is expected to be $237.66. It could reach a high of $297.94, with an average price of $246.39 during the year.
Pi Price Prediction 2030
In 2030, the price of Pi is forecasted to start at a low of $328.69 and may go up to a high of $402.25, with an average price of $341.01 throughout the year.
Pi Price Prediction 2031
The price of Pi in 2031 is predicted to have a minimum value of $483.21. It could reach a maximum of $578.63, with an average trading price of $500.26 for the year.
Pi Network Price Prediction: Analysts’ Pi Price Forecast
| Firm Name | 2025 | 2026 |
| Coincodex | $59 | $77 |
| DigitalCoinPrice | $48 | $65 |
| Changelly | $66 | $110 |
Cryptopolitan’s Pi Price Prediction
At Cryptopolitan, we are bullish on Pi’s price prediction as it flashes bullish on-chain signals amid growing buying demand. Investors are keenly watching the Pi Network market to discern potential movements in its future price trends and analyze shifts in Pi Network’s price.
Technical analysis indicates that Pi is predicted to reach at a minimum level of $55.32 in 2025. The Pi price can reach a maximum level of $64.92 with the average price of $56.92 throughout 2025.
Pi Historic Price Sentiment
- Pi started trading at $48 on 30 December 2022. On the launch day, it surged to its ATH of $330 but failed to hold momentum.
- In the beginning of 2023, Pi price made a heavy decline as it touched a low at around $50.
- In the following months, the price of Pi network continued to decline as it recorded a low around $18 in July.
- Though the price of Pi touched above $50 in September, it again declined.
- Pi ended 2023 on a bearish note at around $30.
- In March of 2024, the price of Pi skyrocketed as it moved toward $117 following market wide correction.
- However, it made a heavy correction in April as it touched a low around $0.17.
- Soon the price surged and consolidated below $40.
- However, following the victory of Donald Trump, the price of Pi surged toward the high of $100 but declined later.
- In recent weeks of 2025, the price of Pi network is consolidating around the $40 mark.
Recommended Articles


