Bitcoin Price Forecast: BTC dips below $99K, wiping nearly $860 million from market
- Bitcoin price edges below $100,000 support on Monday after hitting a new all-time high of $109,588 the previous week.
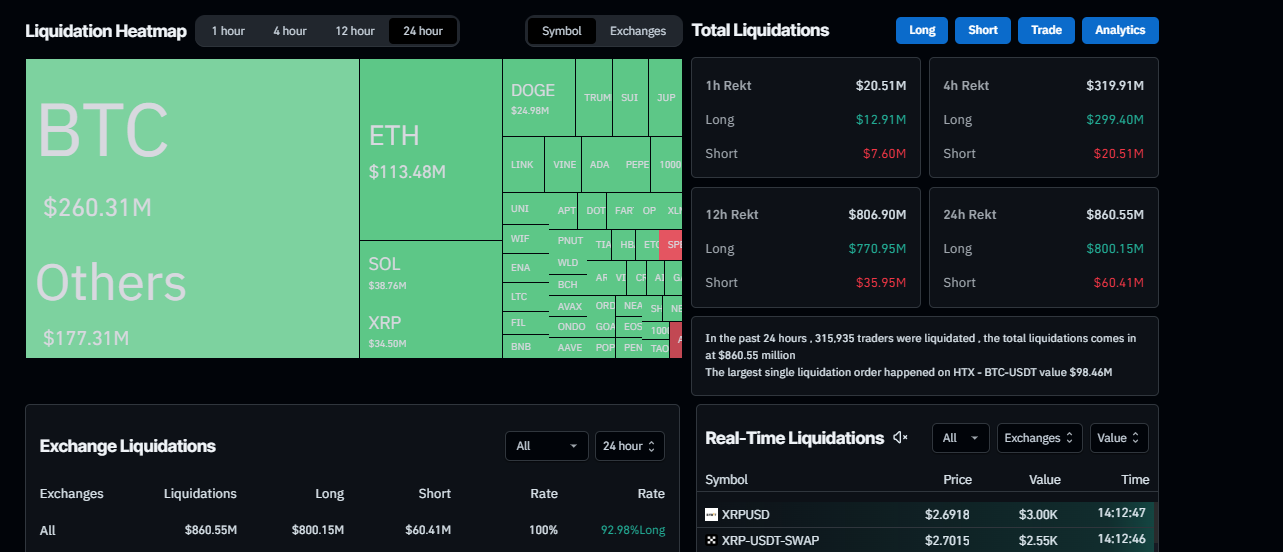
- The recent price decline has triggered a wave of liquidations across the crypto market, resulting in $860.55 million in total liquidations in the last 24 hours.
- The technical outlook suggests a further correction towards $90,000 as momentum indicators show bearish signals.
Bitcoin (BTC) edges below $100,000 support and falls nearly 4% at the time of writing on Monday after hitting a new all-time high of $109,588 the previous week. The recent price decline has triggered a wave of liquidations across the crypto market, resulting in $860.55 million in total liquidations in the last 24 hours.
Moreover, the technical outlook suggests a further correction towards $90,000 as momentum indicators show bearish signals.
Bitcoin price fails to maintain upward momentum
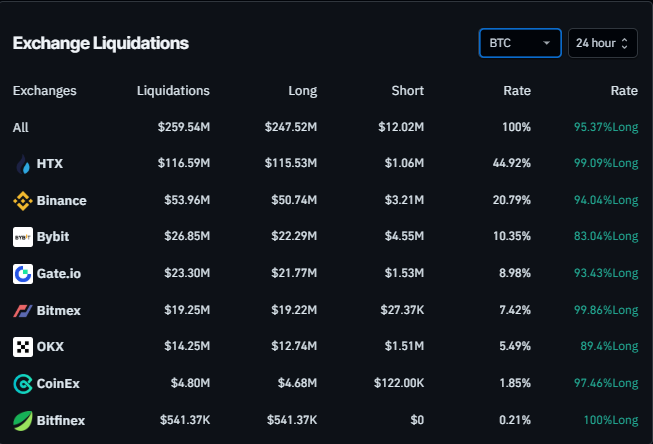
Bitcoin price trades in the red, falling below $99,000 on Monday after hitting a new all-time high (ATH) of $109,588 the previous week. This price correction triggered a wave of liquidations across the crypto market, resulting in $860.55 million in total liquidations in the last 24 hours, almost $260 million specifically in BTC, according to data from CoinGlass.

Liquidation Heatmap chart. Source: Coinglass

Bitcoin liquidation chart. Source: Coinglass
On-chain data provider Santiments’ Network Realized Profit/Loss (NPL) shows massive spikes in Bitcoin.
This metric computes a daily network-level Return On Investment (ROI) based on the coin’s on-chain transaction volume. Simply put, it is used to measure market pain. Strong spikes in a coin’s NPL indicate that its holders are, on average, selling their bags at a significant profit and increasing the selling pressure. On the other hand, strong dips imply that the coin’s holders are, on average, realizing losses, suggesting panic sell-offs and investor capitulation.
In Bitcoin’s case, the metric rose from 1.55 billion on January 21 to 4.82 billion on January 23, as BTC hit new highs last week. A similar spike was seen in BTC on December 17 and 19, after which the prices declined almost 14% in the next four days. If history repeats, BTC could experience a similar price dip.
 [12.32.23, 27 Jan, 2025]-638735715463697812.png)
Bitcoin Network Realized Profit/Loss (NPL) chart. Source: Santiment
Another bearish sign is Coinglass’s Bitcoin long-to-short ratio, which reads 0.89, the lowest level over a month. This ratio below one reflects bearish sentiment in the markets as more traders are betting for Bitcoin prices to fall.

Bitcoin long-to-short ratio chart. Source: Santiment
Bitcoin could expect volatility as Fed interest rate decision approach this week
The US Federal Reserve’s (Fed) interest rate decision on Wednesday could bring volatility for risky assets like Bitcoin.
Ipek Ozkardeskaya, Senior Analyst at Swissquote Bank Ltd, posted on Monday that “The Fed is set for an almost certain no action as the Fed members will certainly want to consider the risks to inflation posed by Donald Trump’s various growth-boosting and trade-restricting policies.”
Ozkardeskaya further explained, “The US yields are softer this morning on news that Trump will not impose 25% tariffs on Colombia as he said he would a few hours before, but the dollar index kicks off the week with a rebound above the 50-DMA. Despite Trump’s willingness to push the Fed for unnecessary rate cuts to boost the economy, the US economy doesn’t necessarily need a boost”.
“The jobs number keep coming unexpectedly strong and growth remains robust thanks to solid consumer spending. The Q4 growth update for the US economy will be released on Thursday this week, and may show that the US economy grew 2.7% last quarter – slightly lower than 3.1% printed at the last update – but the price pressures may have increased from 1.9% to 2.5%. And the rising price pressures - while growth nears 3% - is certainly not favorable for further rate cuts,” said the analyst.
Additionally, Kathleen Brooks, Research Director at XTB UK, posted that “all eyes will be on how Fed chair Jerome Powell will react to Donald Trump’s call for the Fed to cut interest rates. With the Fed expected to remain on hold, they could find themselves in the middle of a political storm. The main event for financial markets is not just what the Fed does, it is also how Donald Trump reacts to it.”
A hawkish Fed often leads to higher interest rates, which makes US government bonds and other Dollar-denominated investments more attractive, thus making risky assets like Bitcoin less attractive.
Bitcoin Price Forecast: Bears aims for $90K mark
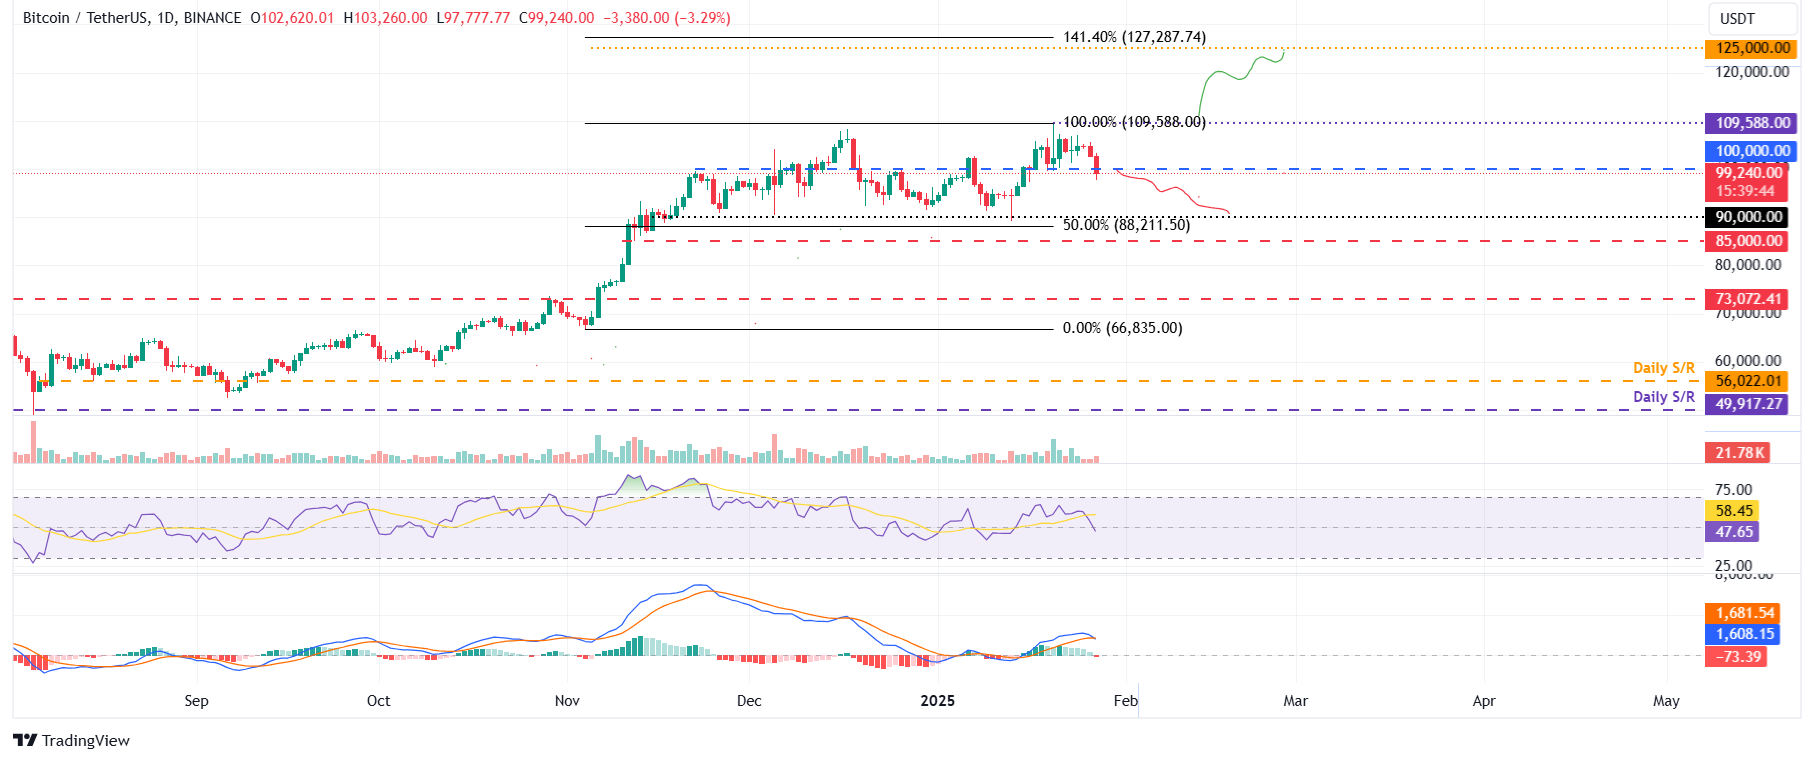
Bitcoin price reached a new all-time high (ATH) of $109,588 on January 20 but failed to maintain its upward momentum. BTC started declining slightly since Saturday and fell 2.22% until Sunday. At the time of writing on Monday, it continues to trade down, trading below its key support level of around $100,000.
If BTC closes below the $100,000 level on a daily basis, it could extend the decline to test its next key support around $90,000.
The Relative Strength Index (RSI) indicator on the daily chart reads 47, edging below its neutral level of 50, indicating a rise in bearish momentum. The Moving Average Convergence Divergence (MACD) indicator is also converging. If the MACD flips to a bearish crossover on a daily basis, it would give a sell signal and suggest a downtrend ahead.

BTC/USDT daily chart
However, if the $100,000 support level holds, it would extend the recovery to retest its ATH of $109,588.
Bitcoin, altcoins, stablecoins FAQs
Bitcoin is the largest cryptocurrency by market capitalization, a virtual currency designed to serve as money. This form of payment cannot be controlled by any one person, group, or entity, which eliminates the need for third-party participation during financial transactions.
Altcoins are any cryptocurrency apart from Bitcoin, but some also regard Ethereum as a non-altcoin because it is from these two cryptocurrencies that forking happens. If this is true, then Litecoin is the first altcoin, forked from the Bitcoin protocol and, therefore, an “improved” version of it.
Stablecoins are cryptocurrencies designed to have a stable price, with their value backed by a reserve of the asset it represents. To achieve this, the value of any one stablecoin is pegged to a commodity or financial instrument, such as the US Dollar (USD), with its supply regulated by an algorithm or demand. The main goal of stablecoins is to provide an on/off-ramp for investors willing to trade and invest in cryptocurrencies. Stablecoins also allow investors to store value since cryptocurrencies, in general, are subject to volatility.
Bitcoin dominance is the ratio of Bitcoin's market capitalization to the total market capitalization of all cryptocurrencies combined. It provides a clear picture of Bitcoin’s interest among investors. A high BTC dominance typically happens before and during a bull run, in which investors resort to investing in relatively stable and high market capitalization cryptocurrency like Bitcoin. A drop in BTC dominance usually means that investors are moving their capital and/or profits to altcoins in a quest for higher returns, which usually triggers an explosion of altcoin rallies.


