Bitcoin Trading In Historically Tight Range: Volatile Decompression Soon?
Bitcoin has recently been trading inside a historically narrow 60-day price range. Here’s what usually follows such periods of compressed volatility.
Bitcoin Price Action And Supply Are Both Constrained In A Tight Range
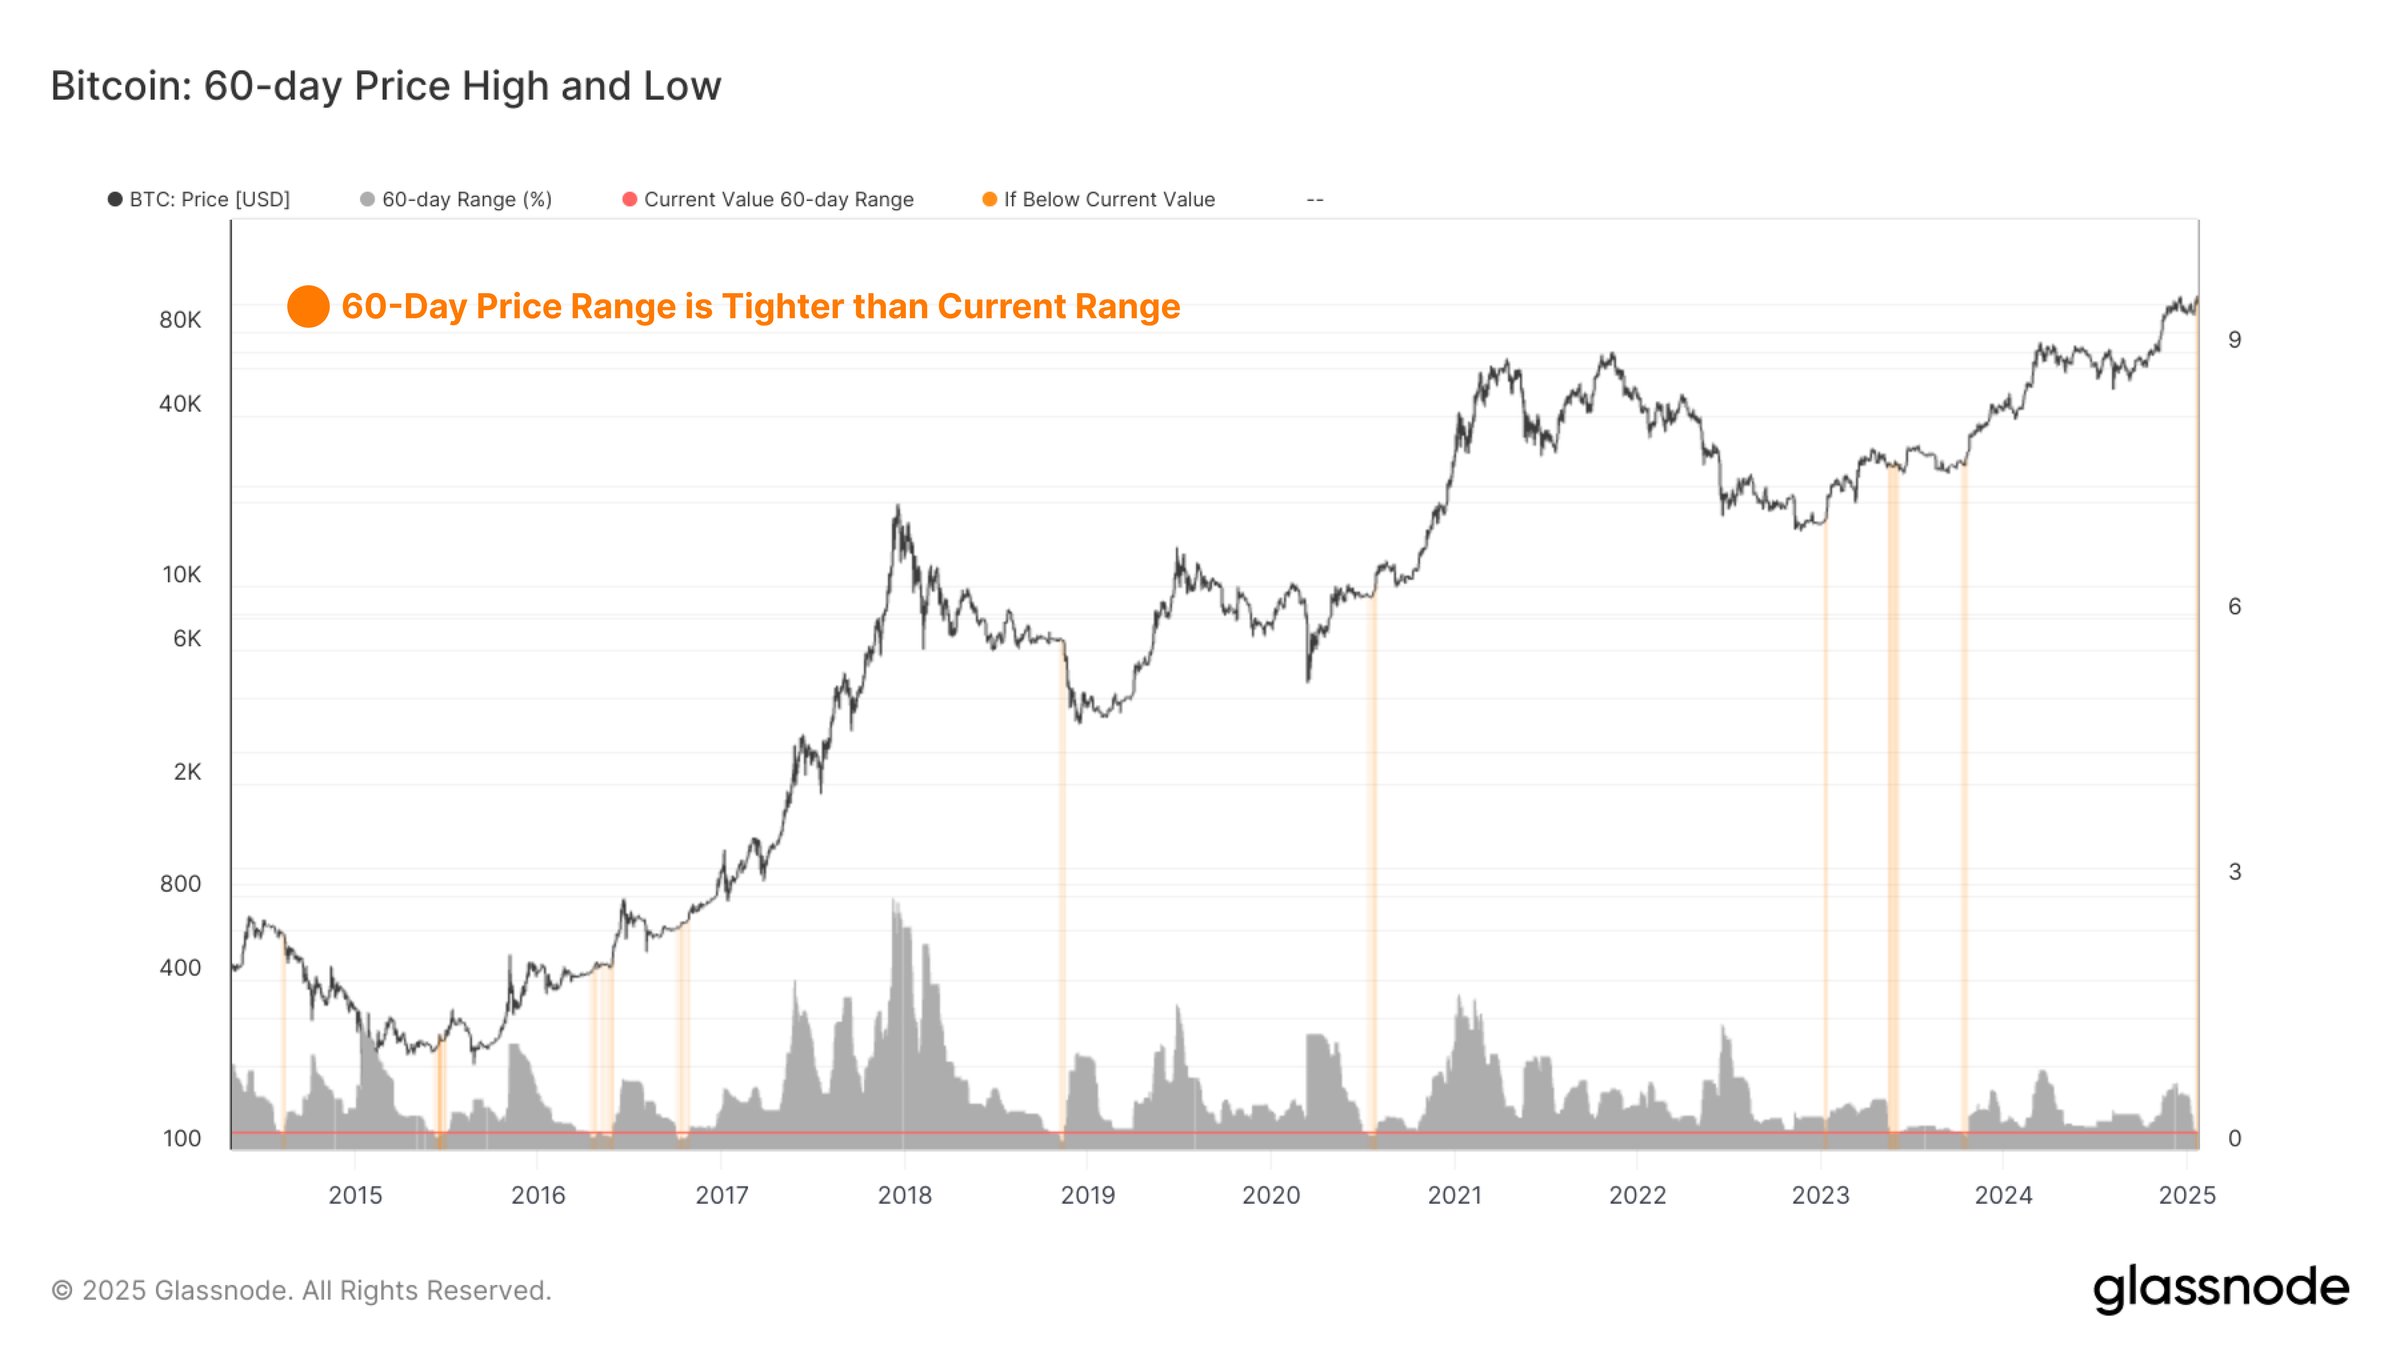
In a new post on X, the on-chain analytics firm Glassnode has discussed how BTC hasn’t witnessed much sharp price action recently. Below is the chart shared by the analytics firm that shows the historical instances where the 60-day price range was narrower than the current one (in terms of percentage swing).
From the graph, it’s visible that there have only been a few periods where the asset has traded between a narrower range during a 60-day period than the last two months. This highlights just how tight the price action has been for Bitcoin recently.
Interestingly, the instances with a more compressed price range all led to especially volatile periods for the asset. Thus, it’s possible that the latest stale period might also end up unwinding with a really sharp swing in the cryptocurrency.
The volatility decompression after a narrow range hasn’t always been bullish; however, the famous November 2019 crash, which marked the bottom of that cycle’s bear market, occurred after historically stale action in the coin’s value.
The tight price range isn’t the only indication that Bitcoin could be due to volatility in the near future, as Glassnode has pointed out that a significant percentage of the BTC supply is concentrated around the current price level.
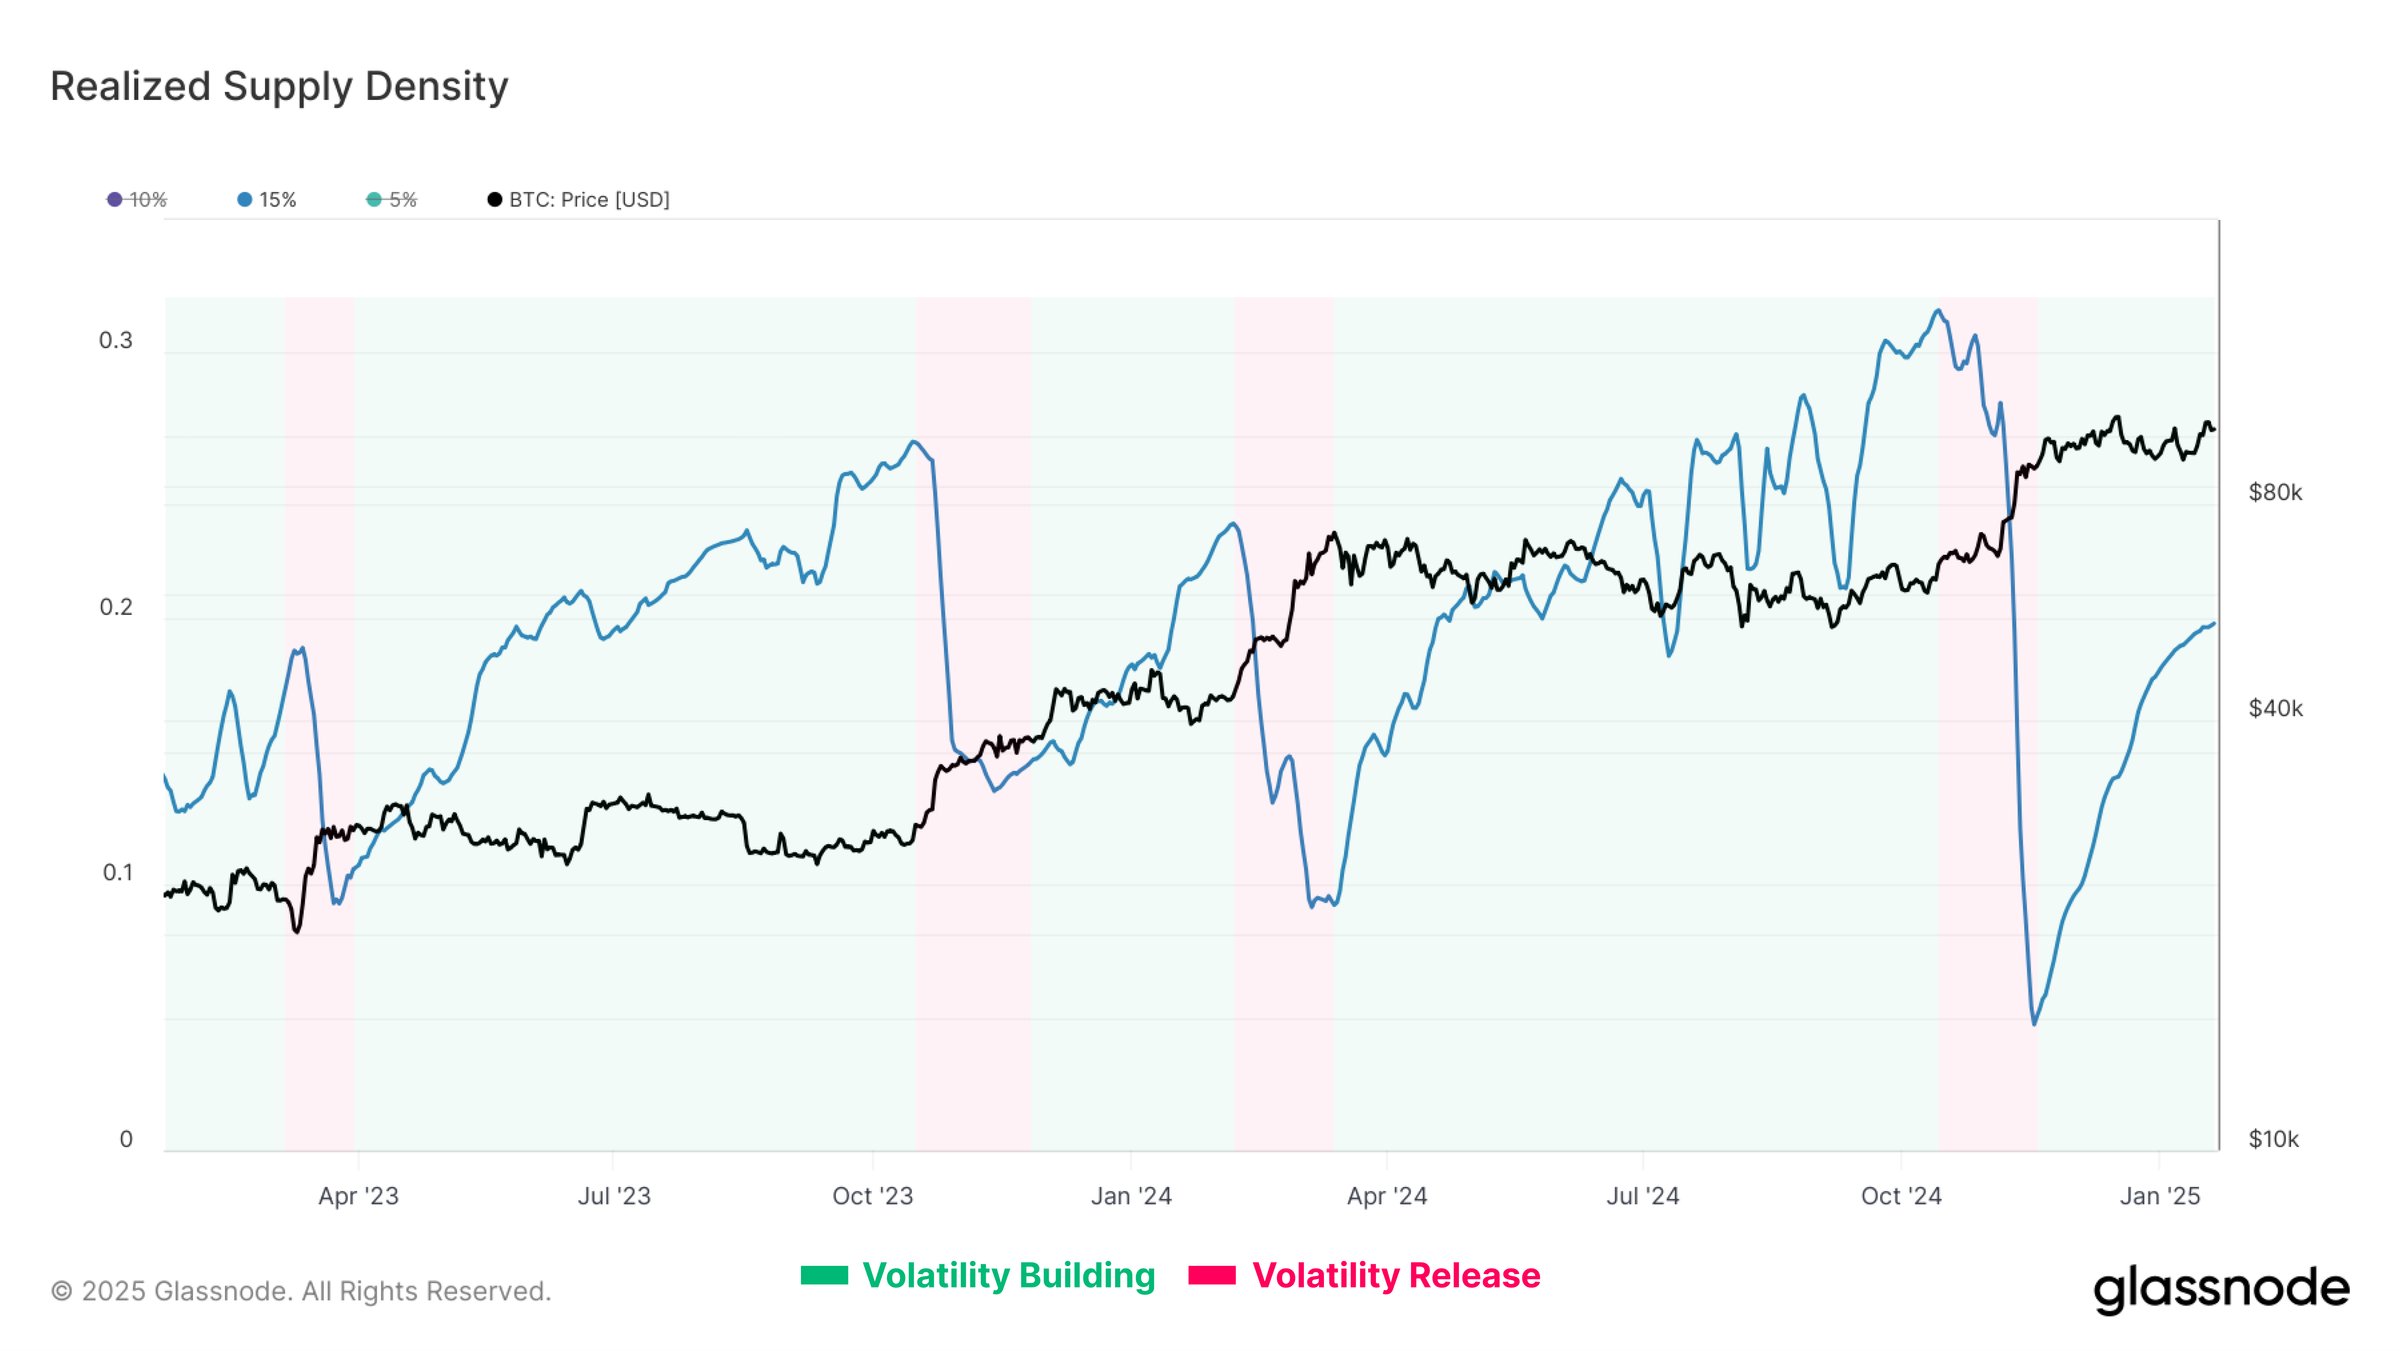
The above chart shows the data for the “Realized Supply Density,” which is an on-chain metric that tells us about the percentage of the asset’s supply that was last purchased inside a given range surrounding the current spot Bitcoin value.
In the graph, the analytics firm has selected 15% as the range, meaning that the indicator is displaying the amount of the supply that was last transferred between +15% and -15% from the latest price.
The Realized Supply Density for this price range has historically followed a curious pattern: a gradual ascent in its value has corresponded to a “volatility building” phase for BTC and a subsequent sharp decline to a “volatility release” one.
Recently, Bitcoin has been inside the former phase from the perspective of this indicator. Around 20% of the BTC supply is concentrated in the ±15% range right now, which is a notable value. “This creates the potential for amplified market volatility as investor profitability shifts,” notes Glassnode.
BTC Price
At the time of writing, Bitcoin is floating around $105,700, up more than 5% over the last seven days.


