


PENGU Gains Over 9%, Tightening Competition With BONK for Top Solana Meme Coin
PENGU price has surged more than 9% in the last 24 hours, reclaiming the $2 billion market cap threshold. This rally solidifies its position as the second-largest meme coin on Solana, trailing BONK closely in a fierce competition for the top spot.
While technical indicators like the ADX and RSI hint at improving momentum, they also suggest the current trend remains unestablished. As PENGU trades near key support and resistance levels, its ability to sustain this upward momentum will determine whether it can continue challenging BONK or face a potential retracement.
PENGU Current Trend Isn’t Established Yet
PENGU ADX has dropped to 15.5 from 20.5 over the past day, signaling a weakening trend strength. With an ADX below 20, the market is considered to lack a strong directional trend, often indicating consolidation or indecision.
This decline comes as PENGU price attempts to form an uptrend, suggesting that while buying momentum may be emerging, it is not yet strong enough to establish a clear and sustained trend.
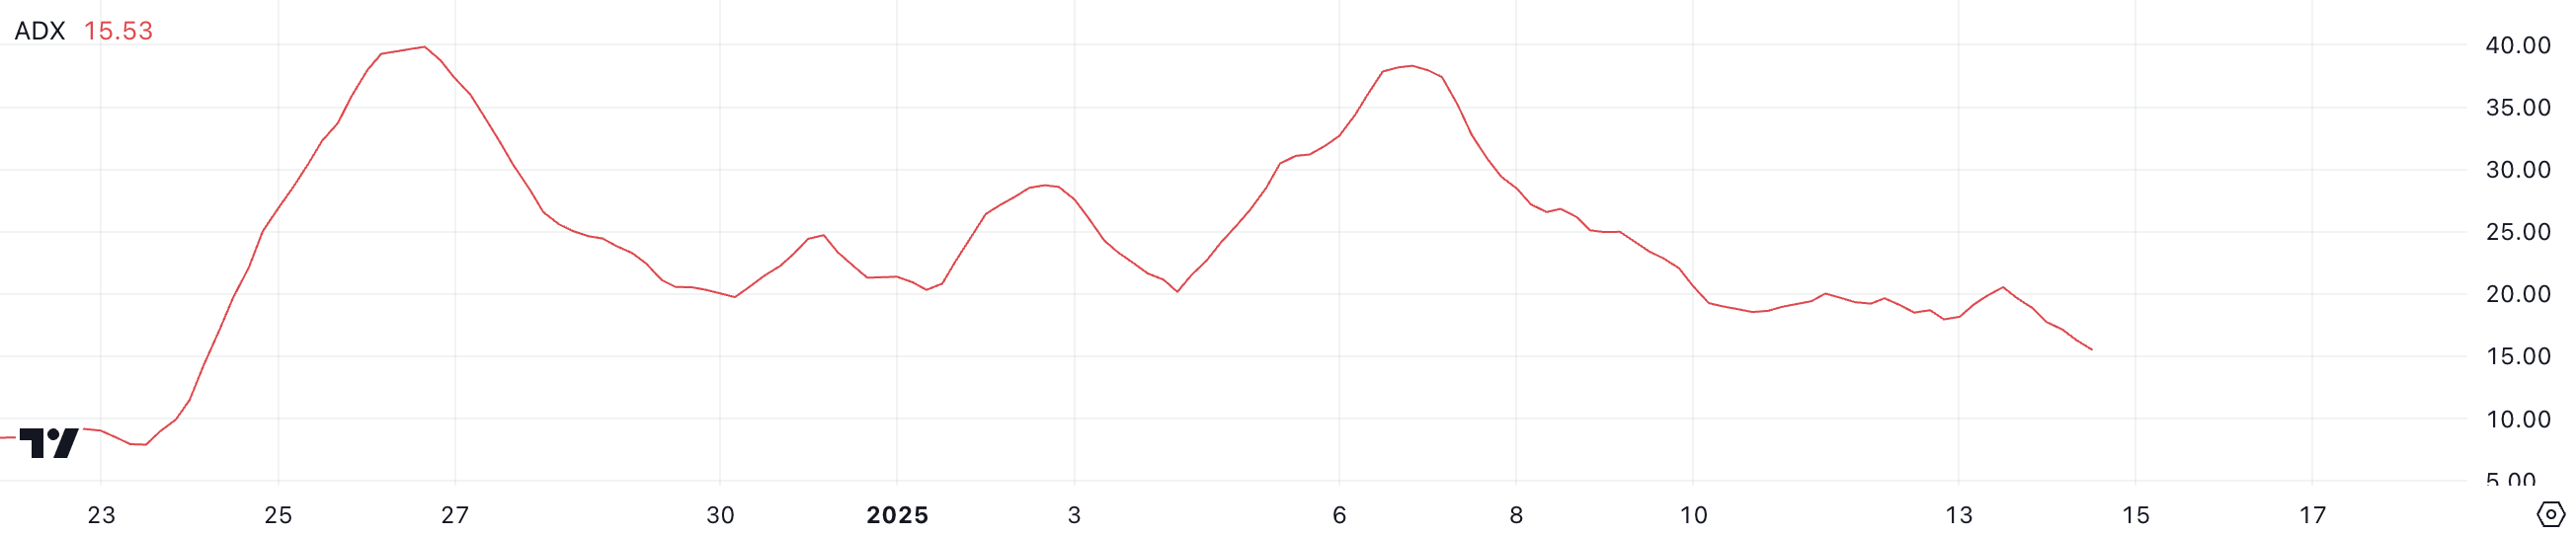 PENGU ADX. Source: TradingView
The ADX, or Average Directional Index, measures the strength of a trend on a scale from 0 to 100. Values below 20 indicate a weak or non-existent trend, while values above 25 suggest a stronger, more defined trend. PENGU’s current ADX at 15.5 reflects the uncertainty in its price movement. This implies that the uptrend it is trying to form lacks sufficient support to gain traction.
For a clear bullish breakout, the ADX would need to rise above 25. In addition, increased buying pressure would be required to confirm the emergence of a stronger trend. Until then, PENGU may remain in a consolidation phase, sustaining its position in the top 10 among the biggest meme coins.
PENGU RSI Increased Fast After Touching the Oversold Zone
PENGU RSI has risen sharply to 49.8 from 28.9 in just one day, indicating a strong recovery from oversold conditions. This increase suggests growing buying momentum after a period of heavy selling, moving the asset closer to a neutral zone.
The significant rise reflects a shift in market sentiment, with buyers beginning to balance out sellers’ prior dominance.
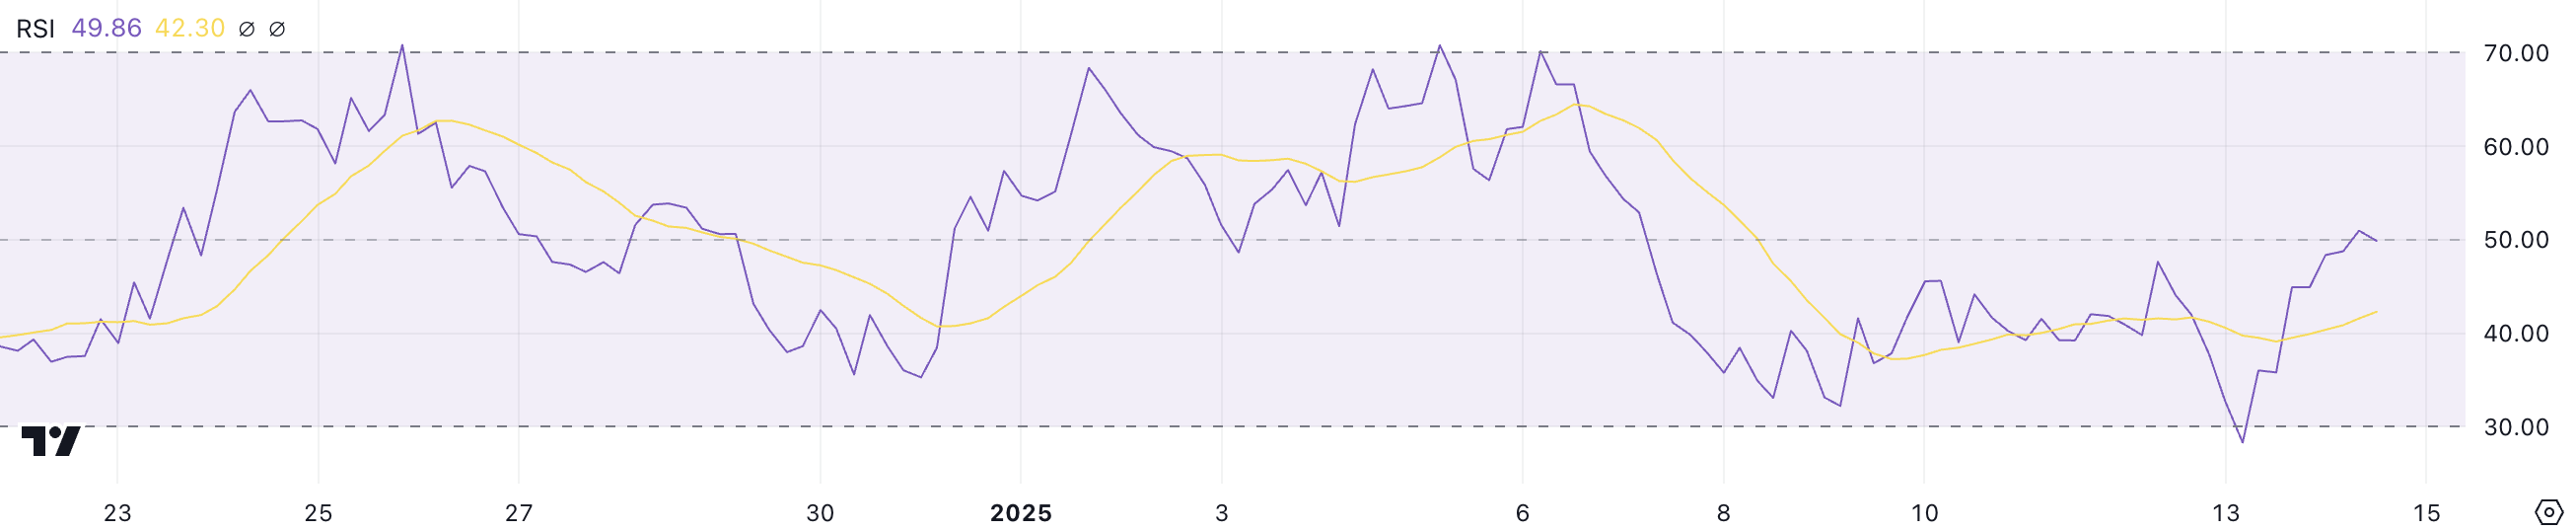 PENGU RSI. Source: TradingView
The RSI, or Relative Strength Index, measures the speed and magnitude of price changes on a scale from 0 to 100. An RSI below 30 indicates oversold conditions, often signaling the potential for a rebound. On the other hand, an RSI above 70 signals overbought conditions.
With PENGU’s RSI now at 49.8, the price is in a neutral zone, leaning slightly bullish. This level suggests that further price recovery is possible, but sustained momentum will be crucial to push the RSI into bullish territory above 50. Conversely, failing to maintain momentum could lead to consolidation or renewed selling pressure.
PENGU Price Prediction: Can PENGU Trade Above $0.4 In January?
PENGU price is currently trading within a range, with support at $0.031 and resistance at $0.034. If the uptrend strengthens, PENGU could break above the $0.034 resistance, paving the way for a test of $0.04 and potentially $0.0439.
This move could further intensify the competition between PENGU and BONK to become Solana’s biggest meme coin.
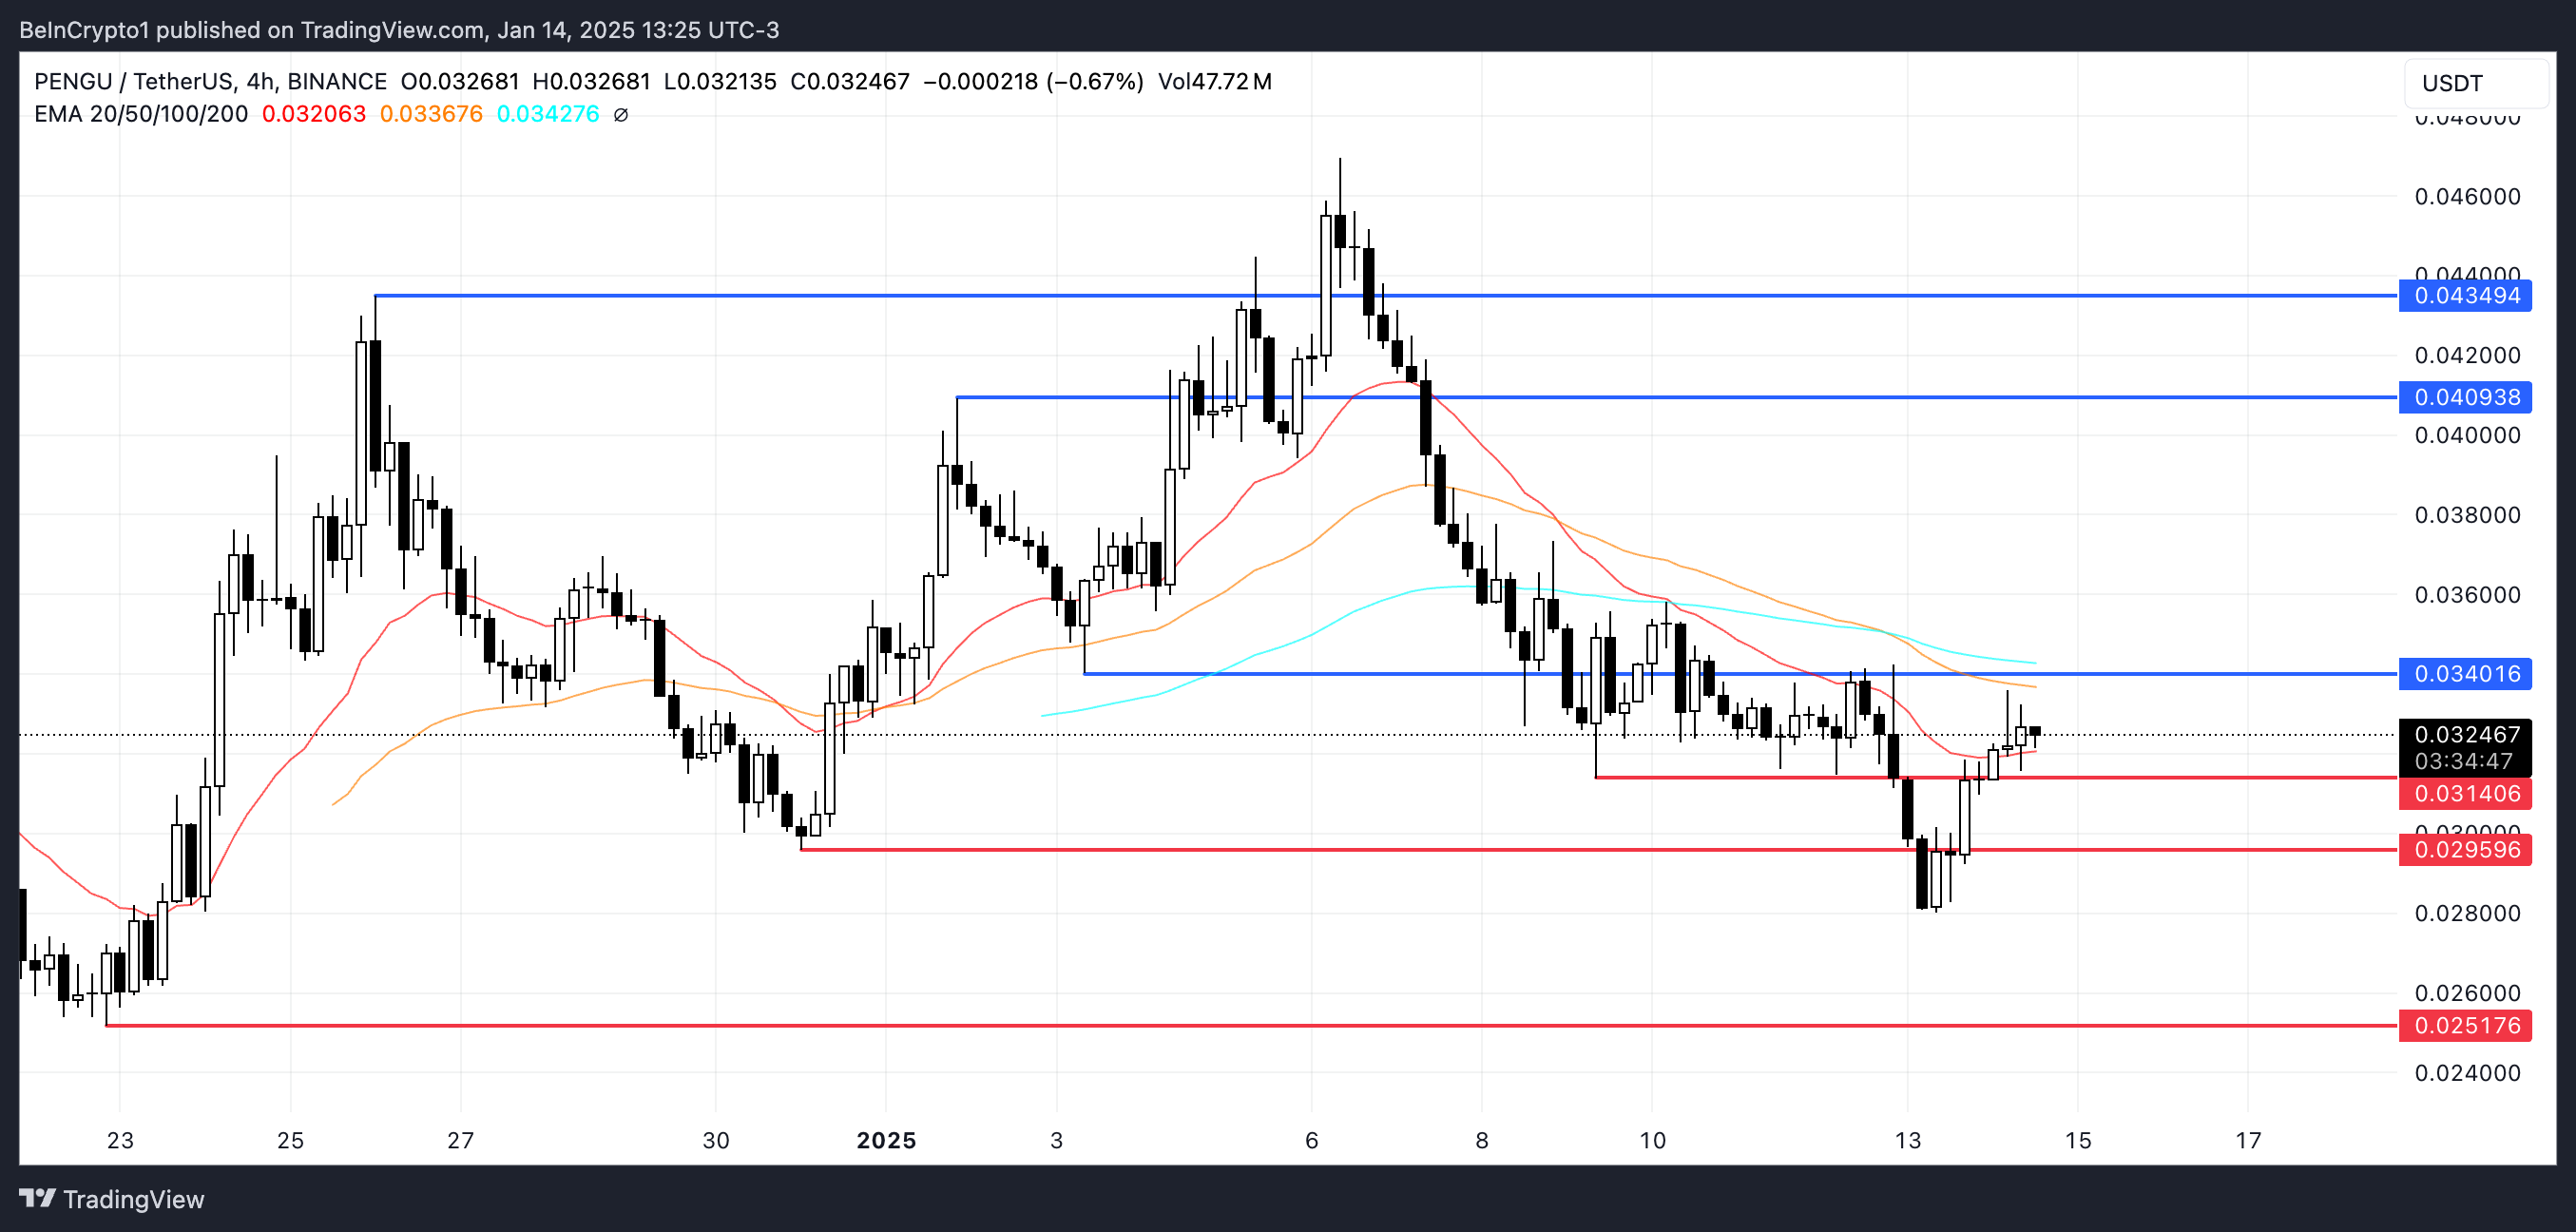 PENGU Price Analysis. Source: TradingView.
However, if the uptrend fails to materialize and the $0.031 support is lost, PENGU price could decline to $0.029.
A stronger downtrend could push the price even lower, potentially testing $0.025.
Recommended Articles


