


Solana (SOL) Tumbles 20% as Market Sees Intense Selling Pressure
Solana (SOL) price has fallen 20% in the last seven days, bringing its market cap down to $85 billion. Technical indicators like the Ichimoku Cloud and DMI highlight strong bearish momentum, with SOL trading below critical levels and facing intense selling pressure.
If the current downtrend continues, SOL risks testing supports at $159 and $147, with a potential drop to $133, marking a 22.6% correction. However, a recovery could see SOL challenge resistance at $183 and, if broken, target a rebound to $203, offering hope for bullish momentum to return.
Solana Ichimoku Cloud Confirms a Bearish Setup
The Ichimoku Cloud chart for Solana reveals a bearish outlook. Its price is trading well below the cloud (Kumo), signaling strong downward momentum. The cloud itself is red and expanding, indicating an increasing bearish trend and resistance ahead.
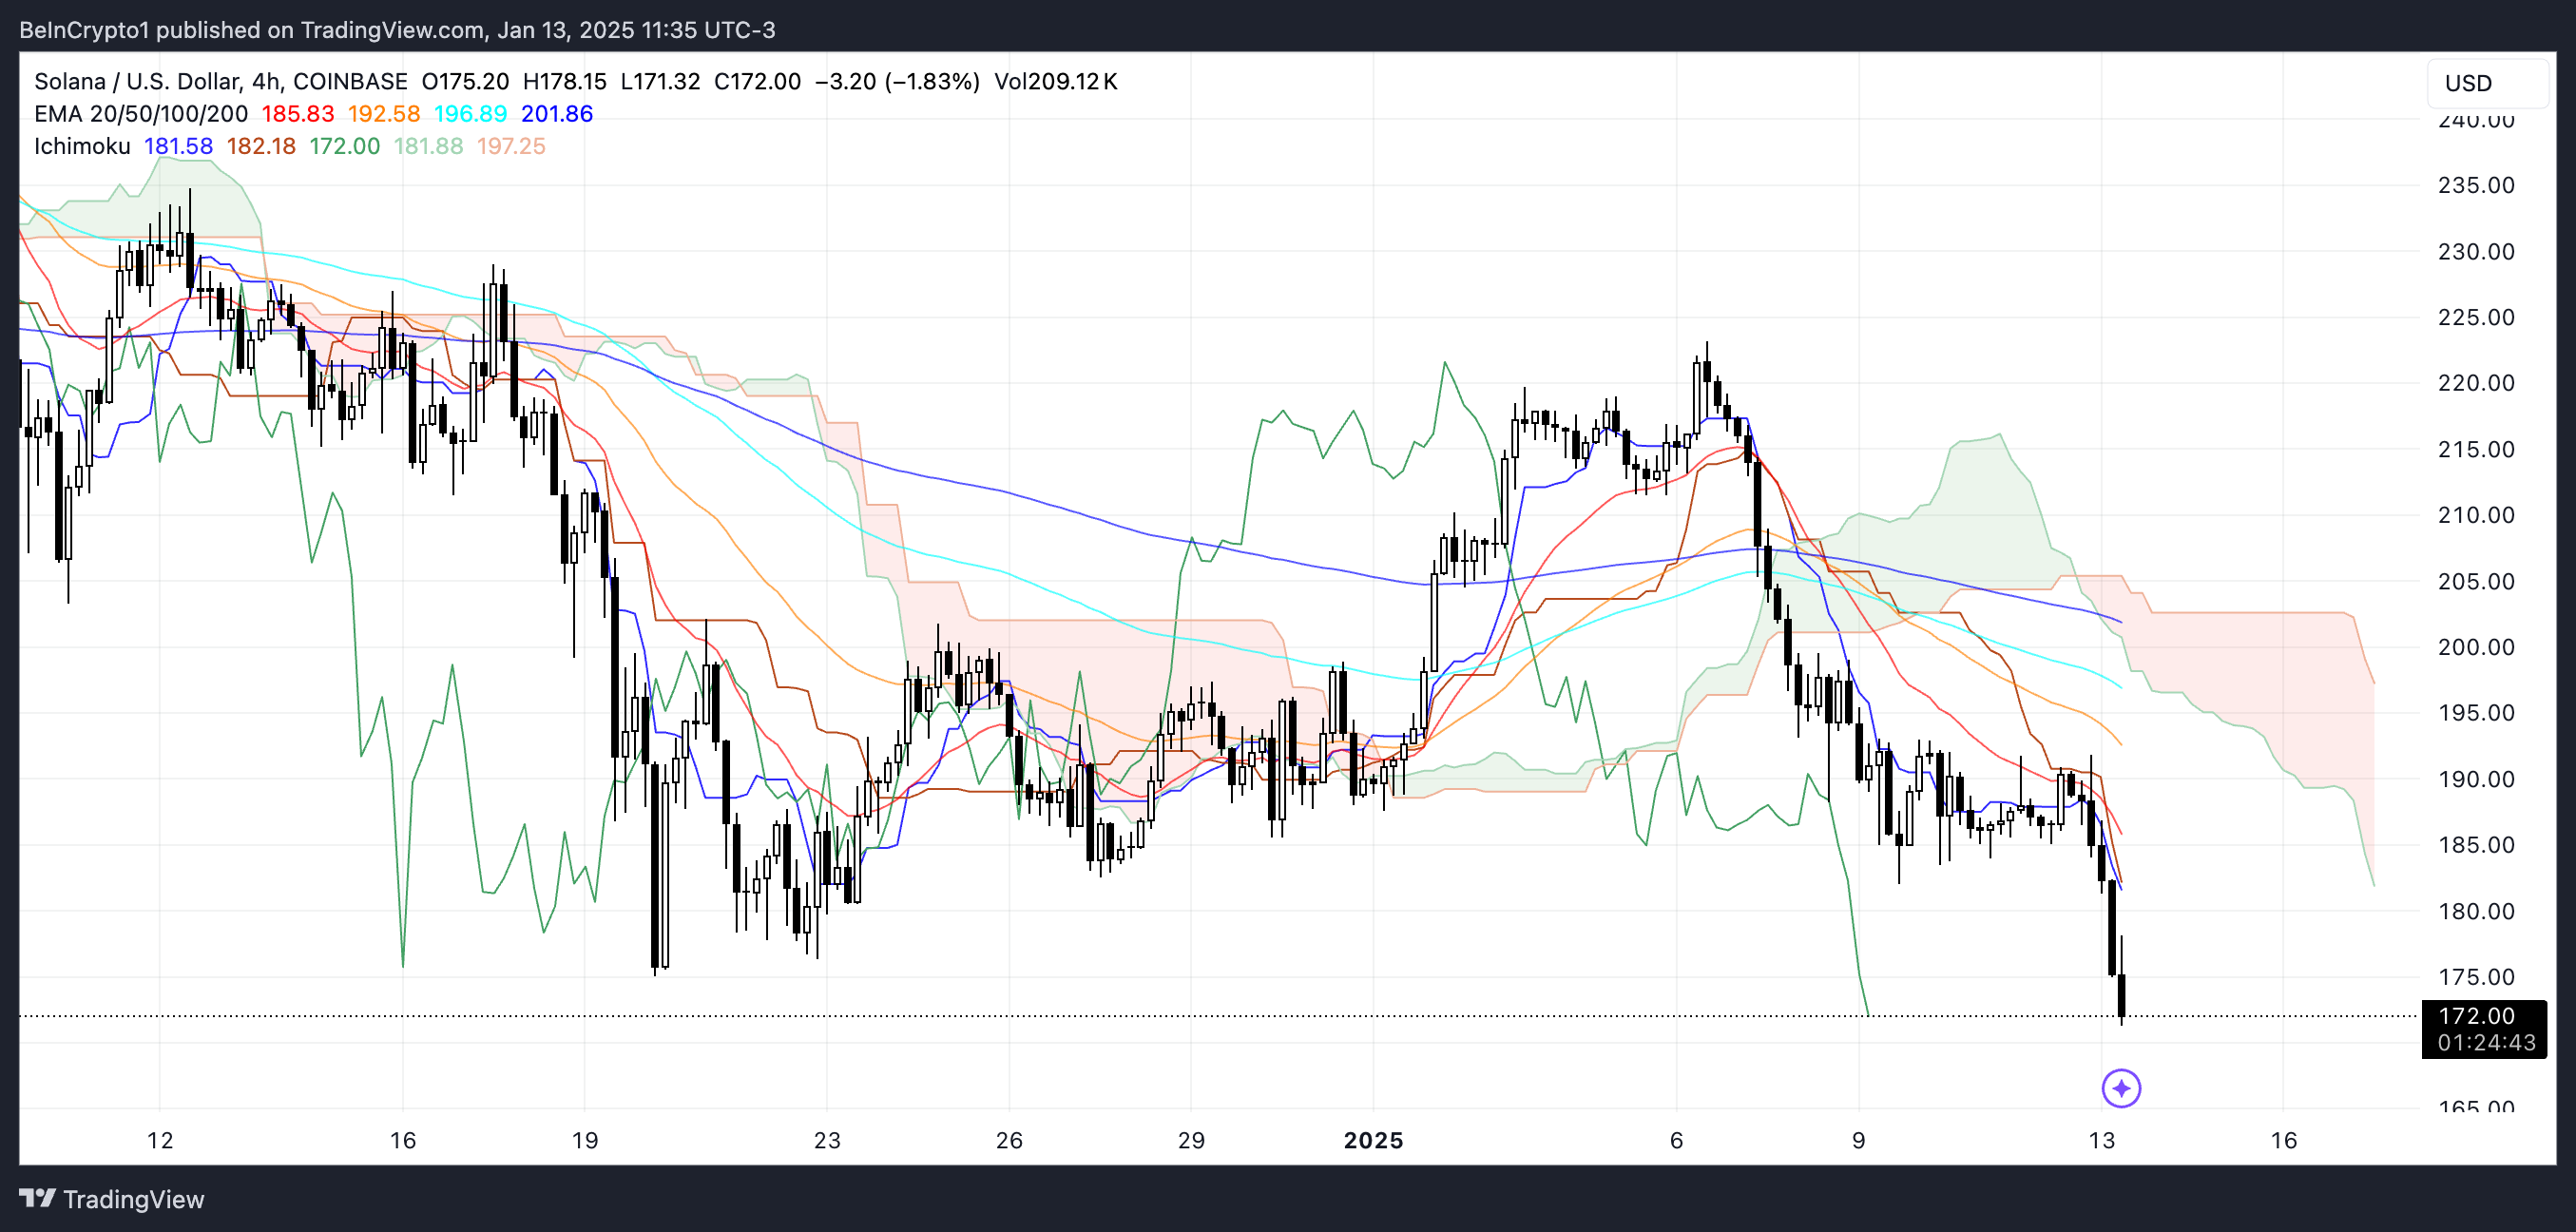 SOL Ichimoku Cloud. Source: TradingView
Additionally, both the conversion line (blue) and the baseline (red) are trending downward, with the conversion line below the baseline, reinforcing the bearish setup. This alignment highlights ongoing selling pressure with no immediate signs of reversal.
Moreover, the lagging span (green) is below the price and the cloud, further confirming the bearish bias. Conversely, for any recovery to occur, SOL price would need to break above the cloud.
SOL Current Downtrend Is Still Strong
SOL DMI chart shows its ADX at 38.4, indicating a strong trend. The ADX (Average Directional Index) measures the strength of a trend without specifying its direction.
Values above 25 typically indicate a strong trend, and when the ADX exceeds 40, it reflects very strong trend strength, regardless of whether the trend is bullish or bearish.
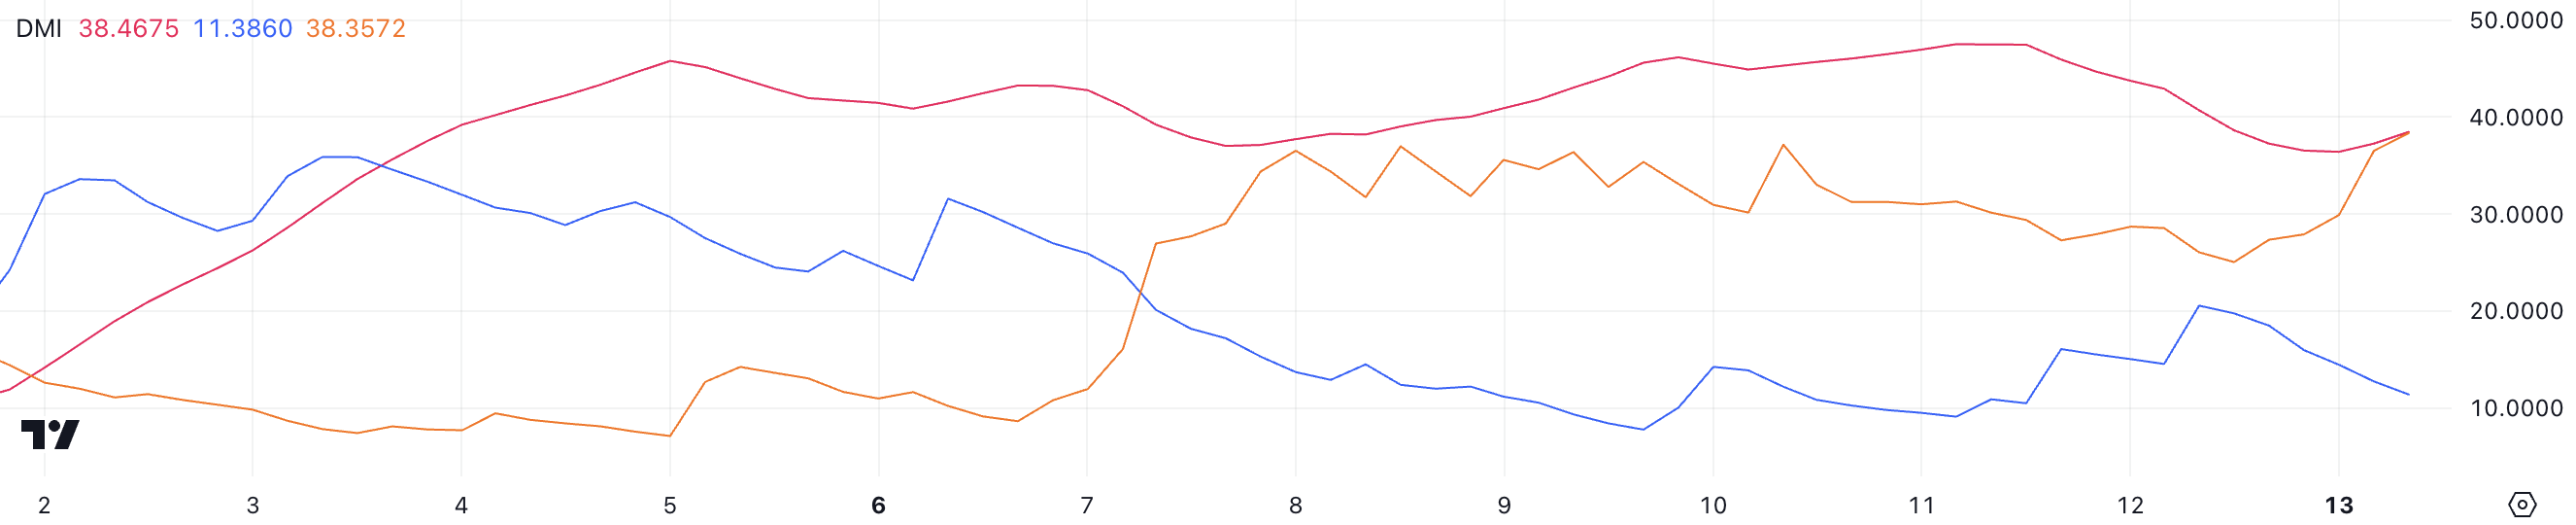 SOL DMI. Source: TradingView
The directional indicators further highlight the bearish pressure on SOL. The positive directional index (+DI) has fallen sharply from 20.5 to 11.3, signaling a significant weakening of bullish momentum. Meanwhile, the negative directional index (-DI) has surged from 26 to 38.3, emphasizing increasing bearish dominance.
Together, these indicators confirm that SOL is firmly in a downtrend, with the strong ADX suggesting the downtrend is unlikely to reverse in the short term. Unless +DI shows signs of recovery or -DI declines, SOL price may remain under pressure in the near term.
SOL Price Prediction: Can Solana Go Below $140 In January?
If the current downtrend persists, Solana price could test its next support level at $159. Should this level fail to hold, the price may drop further to $147, with a continued strong downtrend potentially driving it down to $133, representing a 22.6% correction from current levels.
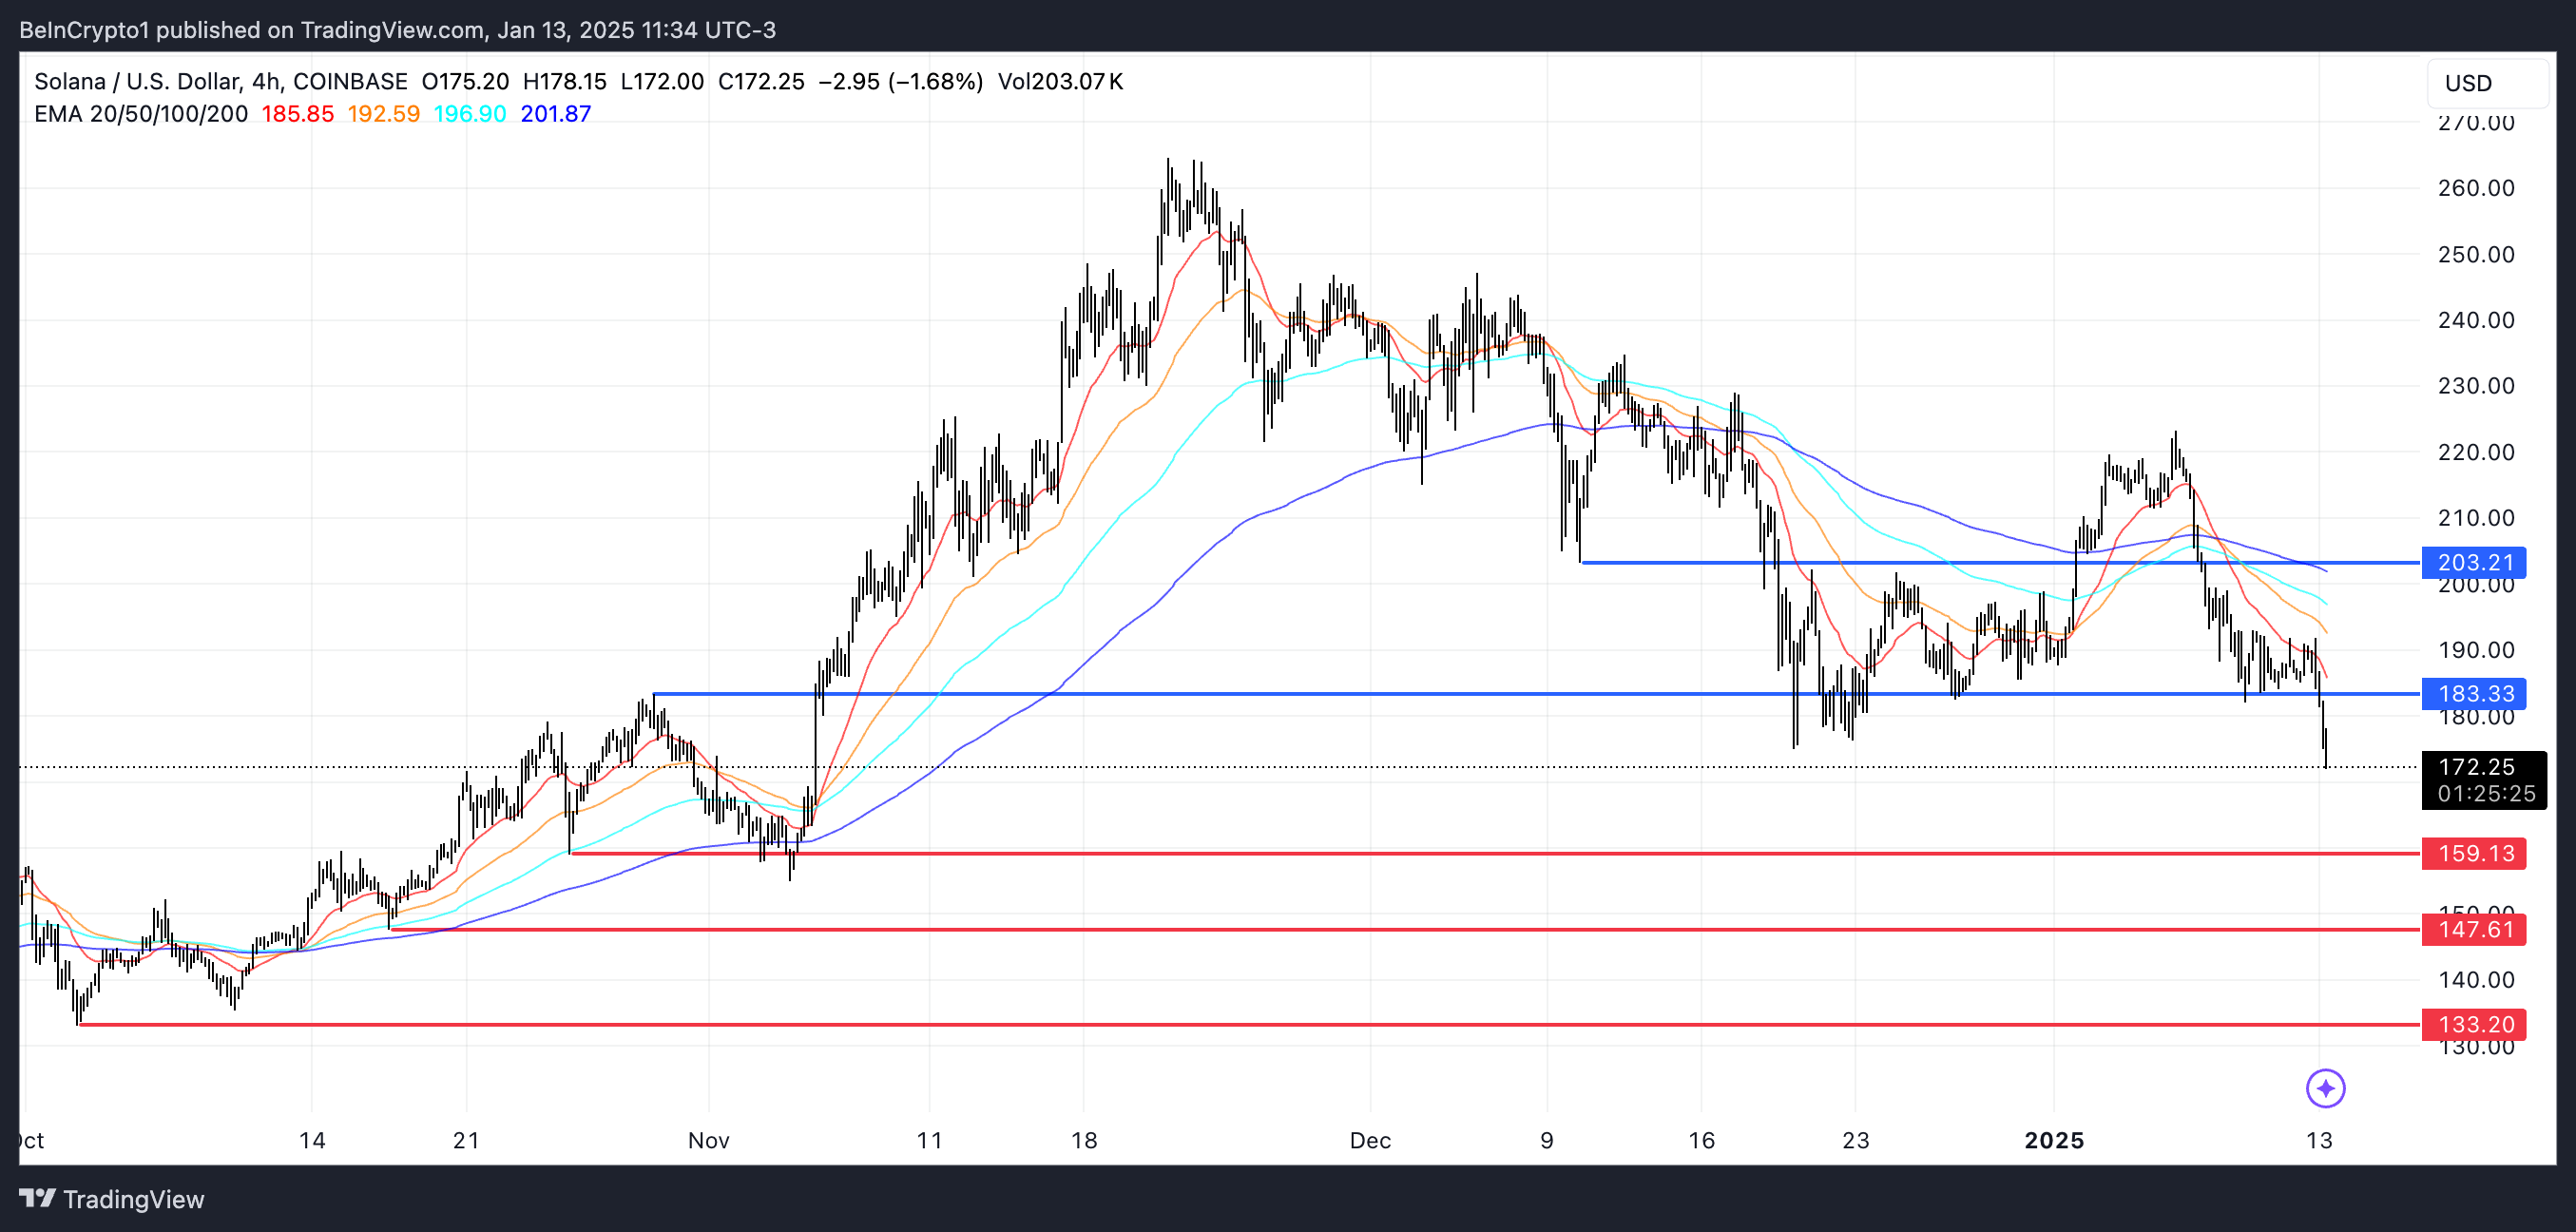 SOL Price Analysis. Source: TradingView
On the other hand, if SOL price manages to recover its momentum, it could challenge the resistance at $183. A break above this level could pave the way for a rebound toward $203, marking a significant recovery.
Recommended Articles


