Sui Price Forecast: SUI bulls eyes for a new all-time high of $6.35

Source Fxstreet
  • Sui's price recovers more than 6% on Friday after declining more than 10% earlier this week.
  • On-chain metrics hint at a rally ahead as SUI’s long-to-short ratio reaches the highest level in over a month, and open interest is also rising.
  • A daily candlestick close below $4.45 would invalidate the bullish thesis.

Sui (SUI) price recovers most of its weekly losses and trades around $5.06 at the time of writing on Friday. On-chain metrics hint at a rally ahead as SUI’s long-to-short ratio reaches the highest level in over a month, and open interest is also rising. The technical outlook suggests a rally continuation, projecting a new all-time high (ATH) of $6.35.

Sui bulls eye for a new all-time high of $6.35

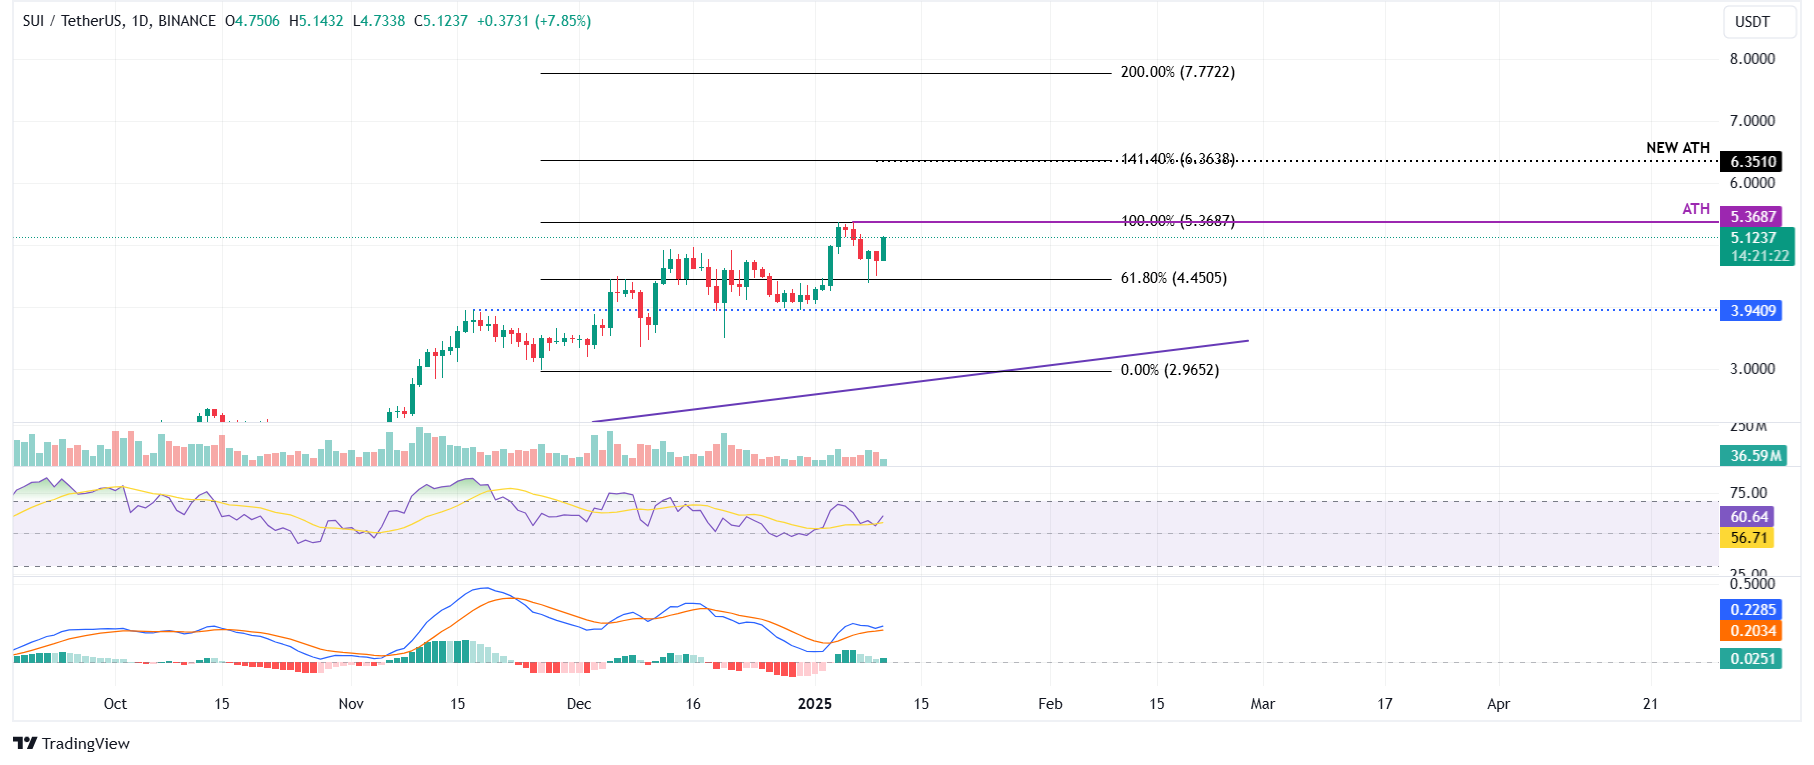
Sui price reached an all-time high of $5.36 on Monday and declined in the following days to find support around the 61.8% Fibonacci retracement, drawn from its November 26 low of $2.96 to its all-time high of $5.36, at $4.45 on Wednesday and Thursday. At the time of writing on Friday, it trades higher and approaches its ATH level.

If SUI continues its upward momentum, it could extend the rally to a new all-time high of $6.35, the 141.40% Fibonacci extension level.  

The Relative Strength Index (RSI) on the daily chart reads 60, above its neutral level of 50, and points upwards, indicating bullish momentum. The Moving Average Convergence Divergence (MACD) indicator also shows a bullish crossover, signaling a buy signal and suggesting the continuation of the uptrend.
SUI/USDT daily chart

SUI/USDT daily chart

Looking at Sui’s Open Interest (OI) further boosts the bullish outlook. Coinglass’s data shows that the futures’ OI in SUI at exchanges rose from $1.20 million on Wednesday to $1.32 billion on Friday, rising since early January. An increasing OI represents new or additional money entering the market and new buying, which suggests a rally ahead in the Sui price.

SUI Open Interest chart. Source: Coinglass

SUI Open Interest chart. Source: Coinglass

Another bullish sign is Coinglass’s SUI long-to-short ratio, which reads 1.13, the highest level in over a month. This ratio above one reflects bullish sentiment in the markets as more traders are betting for the Sui price to rise.

SUI long-to-short ratio chart. Source: Coinglass

SUI long-to-short ratio chart. Source: Coinglass

However, if Sui’s daily candlestick closes below the $4.45 support, the bullish thesis would be invalidated, leading to a price decline to retest its next daily support at $3.94.

Disclaimer: For information purposes only. Past performance is not indicative of future results.
placeholder
Why Did The S&P 500 And Nasdaq Composite Just Fall Over 1%?TradingKey - The year 2025 started off on a pretty solid footing for investors with the key indices in the US – the S&P 500 Index and the tech-focused Nasdaq Composite Index – both posting gains in the first few days of trading. That followed on from some huge double-digit gains for 2023 and 2024.
Author  TradingKey
Jan 08, Wed
TradingKey - The year 2025 started off on a pretty solid footing for investors with the key indices in the US – the S&P 500 Index and the tech-focused Nasdaq Composite Index – both posting gains in the first few days of trading. That followed on from some huge double-digit gains for 2023 and 2024.
placeholder
XRP Price Eyes Bullish Flag Breakout That Could Put 50% Gains On The BoardDespite recent declines and volatility, a crypto analyst has declared that the XRP price is on the cusp of breaking out of a bullish flag pattern. According to the analyst, a successful breakout of
Author  NewsBTC
Yesterday 01: 22
Despite recent declines and volatility, a crypto analyst has declared that the XRP price is on the cusp of breaking out of a bullish flag pattern. According to the analyst, a successful breakout of
placeholder
Japanese Yen recovers from multi-month low against USD on stronger wage growth dataThe Japanese Yen (JPY) ticks higher against its American counterpart after government data showed this Thursday that base pay in Japan grew at the fastest pace in more than three decades.
Author  FXStreet
Yesterday 03: 49
The Japanese Yen (JPY) ticks higher against its American counterpart after government data showed this Thursday that base pay in Japan grew at the fastest pace in more than three decades.
placeholder
Ripple's XRP plunges over 4% following funding rates declineRipple's XRP declined 4% on Friday following a decline in its funding rates.
Author  FXStreet
14 hours ago
Ripple's XRP declined 4% on Friday following a decline in its funding rates.
placeholder
Top 3 Price Prediction Bitcoin, Ethereum, Ripple: All hints for a continuation of the correctionBitcoin (BTC) retests its key support level of $92,493; a firm close below it could continue its ongoing correction.
Author  FXStreet
10 hours ago
Bitcoin (BTC) retests its key support level of $92,493; a firm close below it could continue its ongoing correction.
goTop
quote