Ethereum Price Forecast: ETH risks further decline as long-term holders show signs of budging
Ethereum price today: $3,200
- Ethereum LTHs show signs of cracking after the crypto market stretched its decline to a third consecutive day.
- The supply distribution trend flipped, with large whales shedding 190K ETH while small-scale whales accumulated.
- Ethereum could see heightened bearish pressure if the RSI and Stochastic cross below their neutral levels.
Ethereum (ETH) continued to decline on Thursday as long-term holders and large whales engaged in selling activities. If ETH's momentum indicators fall below their neutral levels and it fails to recover the $3,216 support level, the bearish pressure could intensify.
Ethereum risks further decline as LTHs and large whales shed holdings
With the crypto market sustaining its decline for a third consecutive day, Ethereum LTHs are beginning to show signs of budging after a slight uptick in the 2-year and 3-year Dormant Circulation.
 [19.08.17, 09 Jan, 2025]-638720504103164637.png)
2Y & 3Y Dormant Circulation. Source: Santiment
Dormant Circulation indicates the total amount of distributed coins previously held for a particular time frame. An uptick in this metric signifies distribution, while vice versa for a decline.
If this cohort of holders increases their selling pressure alongside short-term holders, it could result in a steep decline for Ethereum.
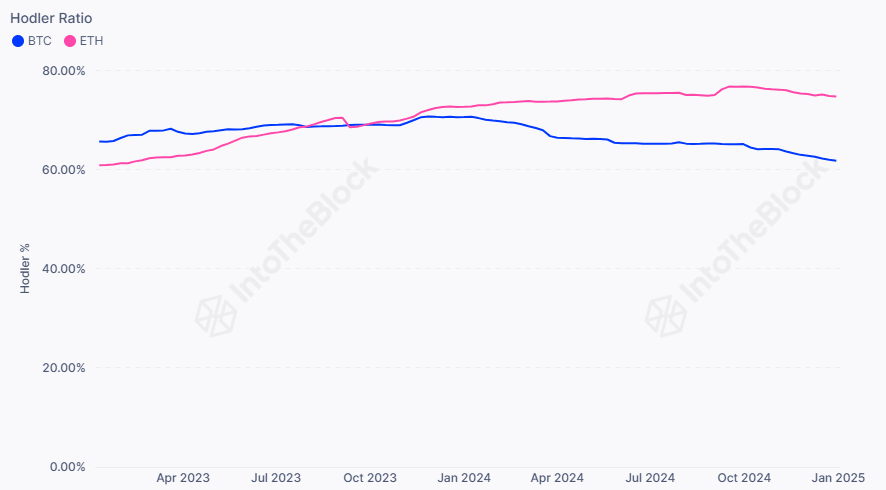
Despite the modest distribution, the total number of Ethereum LTHs has remained above that of Bitcoin. The total number of ETH LTHs is over 74%, while that of Bitcoin is around 60%. The contrast is due to Bitcoin reaching new highs over the past year while ETH still struggles below $4,000.

Ethereum vs Bitcoin LTHs. Source: IntoTheBlock
The trend is likely to continue until ETH hits a new all-time high.
Meanwhile, the sustained decline has also resulted in a divergence in ETH supply distribution. Notably, entities holding between 10K and 100K accumulated when the decline began, while those with 1K to 10K ETH sold.
However, the trend flipped in the past 24 hours, with the former shedding over 190K ETH and the latter accumulating about 80K ETH. Since the recent distribution of the larger cohort outpaces that of the smaller, ETH does not look likely to see a recovery.
 [19.29.41, 09 Jan, 2025]-638720505317438037.png)
ETH Supply Distribution. Source: Santiment
Furthermore, Ethereum exchange-traded funds (ETFs) recorded net outflows of $159.4 million.
Ethereum Price Forecast: ETH remains tilted toward the downside
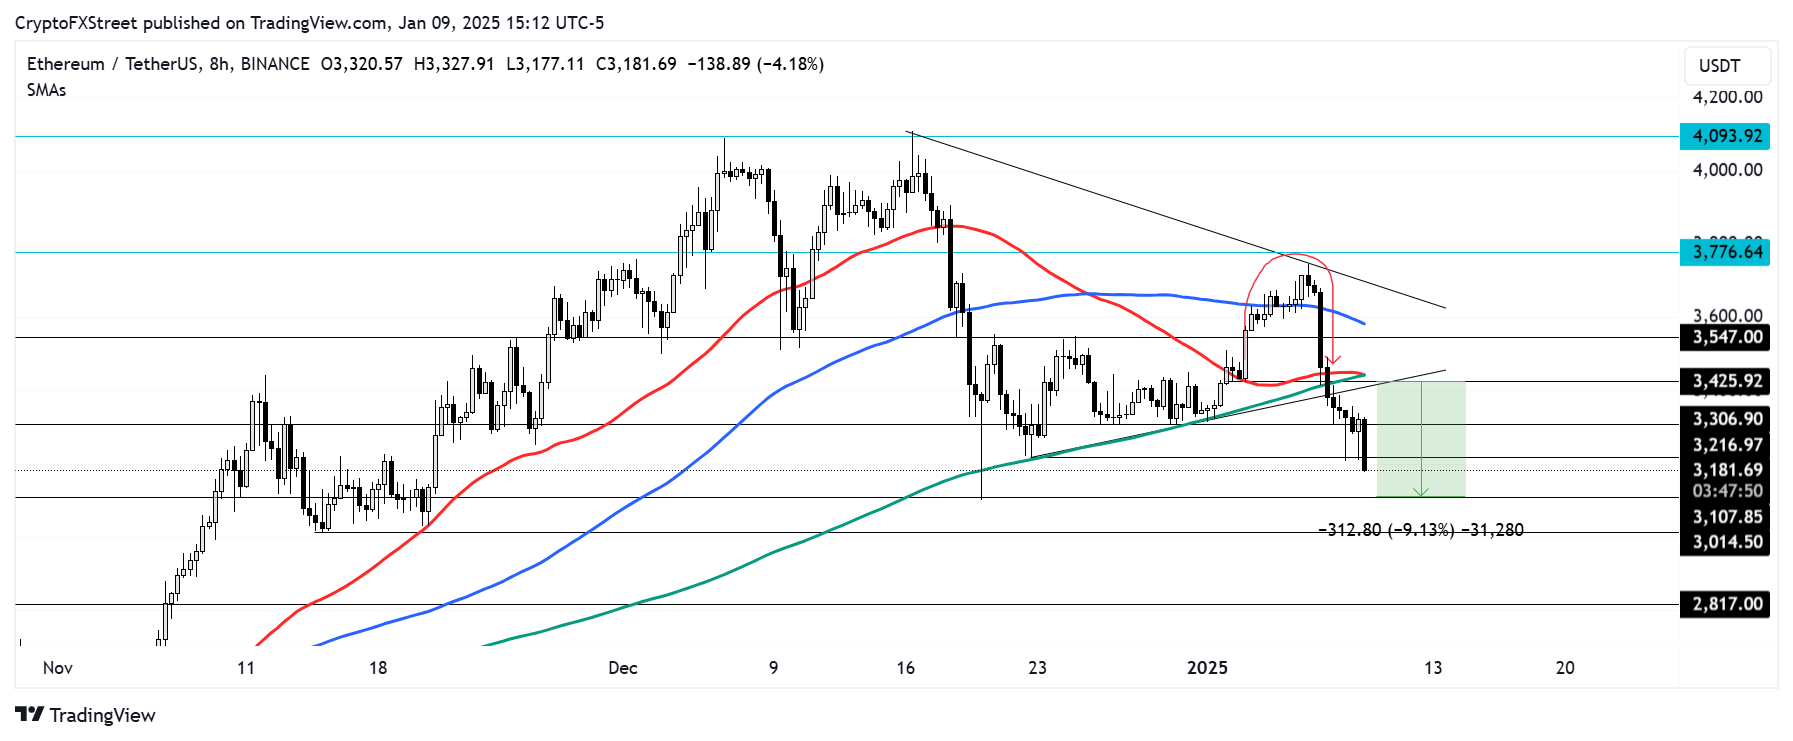
Ethereum is down 3% after sustaining $84.40 million in liquidations in the past 24 hours, per Coinglass data. The amount of long liquidations is $40.07, while shorts accounted for $44.33 million.
On the 8-hour chart, ETH has declined below the $3,216 level as bearish sentiment continues to dominate the market. If ETH maintains this decline, it could complete its rounding top pattern target by finding support near the $3,110 level.

ETH/USDT 8-hour chart
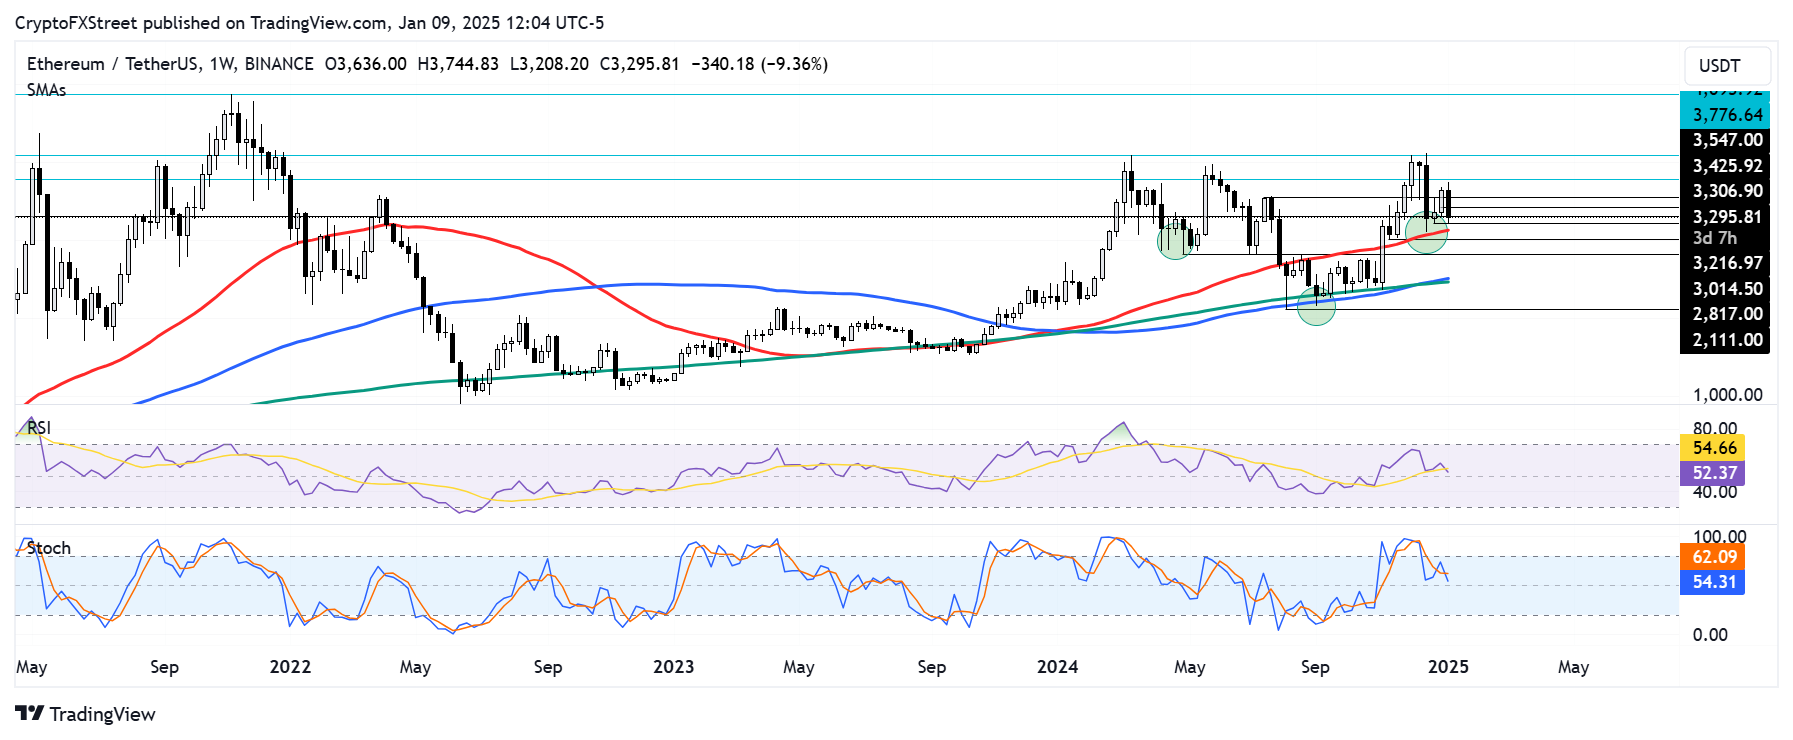
Despite the recent decline, Ethereum maintains a bullish outlook on the weekly chart as it's looking to form the right shoulder of an inverse Head-and-Shoulders (H&S) pattern. The $2,817 support level and $4,093 resistance are key to ensuring this pattern holds.

ETH/USDT weekly chart
If ETH breaks above the resistance, it will validate the inverse H&S pattern and rally to tackle its all-time high resistance at $4,868. However, a decline below $2,817 will invalidate the pattern and potentially send ETH toward $2,110. The 50-day Simple Moving Average (SMA) could serve as strong support to prevent such declines.
The Relative Strength Index (RSI) and Stochastic Oscillator (Stoch) on the weekly chart are testing their neutral levels after crossing below their respective moving average and %D lines. Sustained moves below their neutral levels with such trends could accelerate the bearish momentum, and spark increased losses for Ethereum.
Ethereum FAQs
Ethereum is a decentralized open-source blockchain with smart contracts functionality. Its native currency Ether (ETH), is the second-largest cryptocurrency and number one altcoin by market capitalization. The Ethereum network is tailored for building crypto solutions like decentralized finance (DeFi), GameFi, non-fungible tokens (NFTs), decentralized autonomous organizations (DAOs), etc.
Ethereum is a public decentralized blockchain technology, where developers can build and deploy applications that function without the need for a central authority. To make this easier, the network leverages the Solidity programming language and Ethereum virtual machine which helps developers create and launch applications with smart contract functionality.
Smart contracts are publicly verifiable codes that automates agreements between two or more parties. Basically, these codes self-execute encoded actions when predetermined conditions are met.
Staking is a process of earning yield on your idle crypto assets by locking them in a crypto protocol for a specified duration as a means of contributing to its security. Ethereum transitioned from a Proof-of-Work (PoW) to a Proof-of-Stake (PoS) consensus mechanism on September 15, 2022, in an event christened “The Merge.” The Merge was a key part of Ethereum's roadmap to achieve high-level scalability, decentralization and security while remaining sustainable. Unlike PoW, which requires the use of expensive hardware, PoS reduces the barrier of entry for validators by leveraging the use of crypto tokens as the core foundation of its consensus process.
Gas is the unit for measuring transaction fees that users pay for conducting transactions on Ethereum. During periods of network congestion, gas can be extremely high, causing validators to prioritize transactions based on their fees.


