Bitcoin Signal That Took Price From $69,000 To $108,000 Appears Again
Data shows that a Bitcoin indicator has recently formed a pattern that has proved to be quite bullish regarding the cryptocurrency’s price.
Bitcoin Coinbase Premium Index Has Crossed Above Its 14-Day SMA
In a new post on X, the on-chain analytics firm CryptoQuant has discussed a pattern that has recently formed in the Bitcoin Coinbase Premium Index. The “Coinbase Premium Index” is an indicator that keeps track of the percentage difference between the Bitcoin price listed on Coinbase (USD pair) and that on Binance (USDT pair).
This indicator is useful for determining how the buying or selling behaviors differ between the userbases of the two cryptocurrency exchange titans. Positive values imply the users on Coinbase are buying at a higher rate or selling at a lower rate than the ones on Binance. Similarly, negative values imply that Binance users have pushed the BTC price higher than on Coinbase.
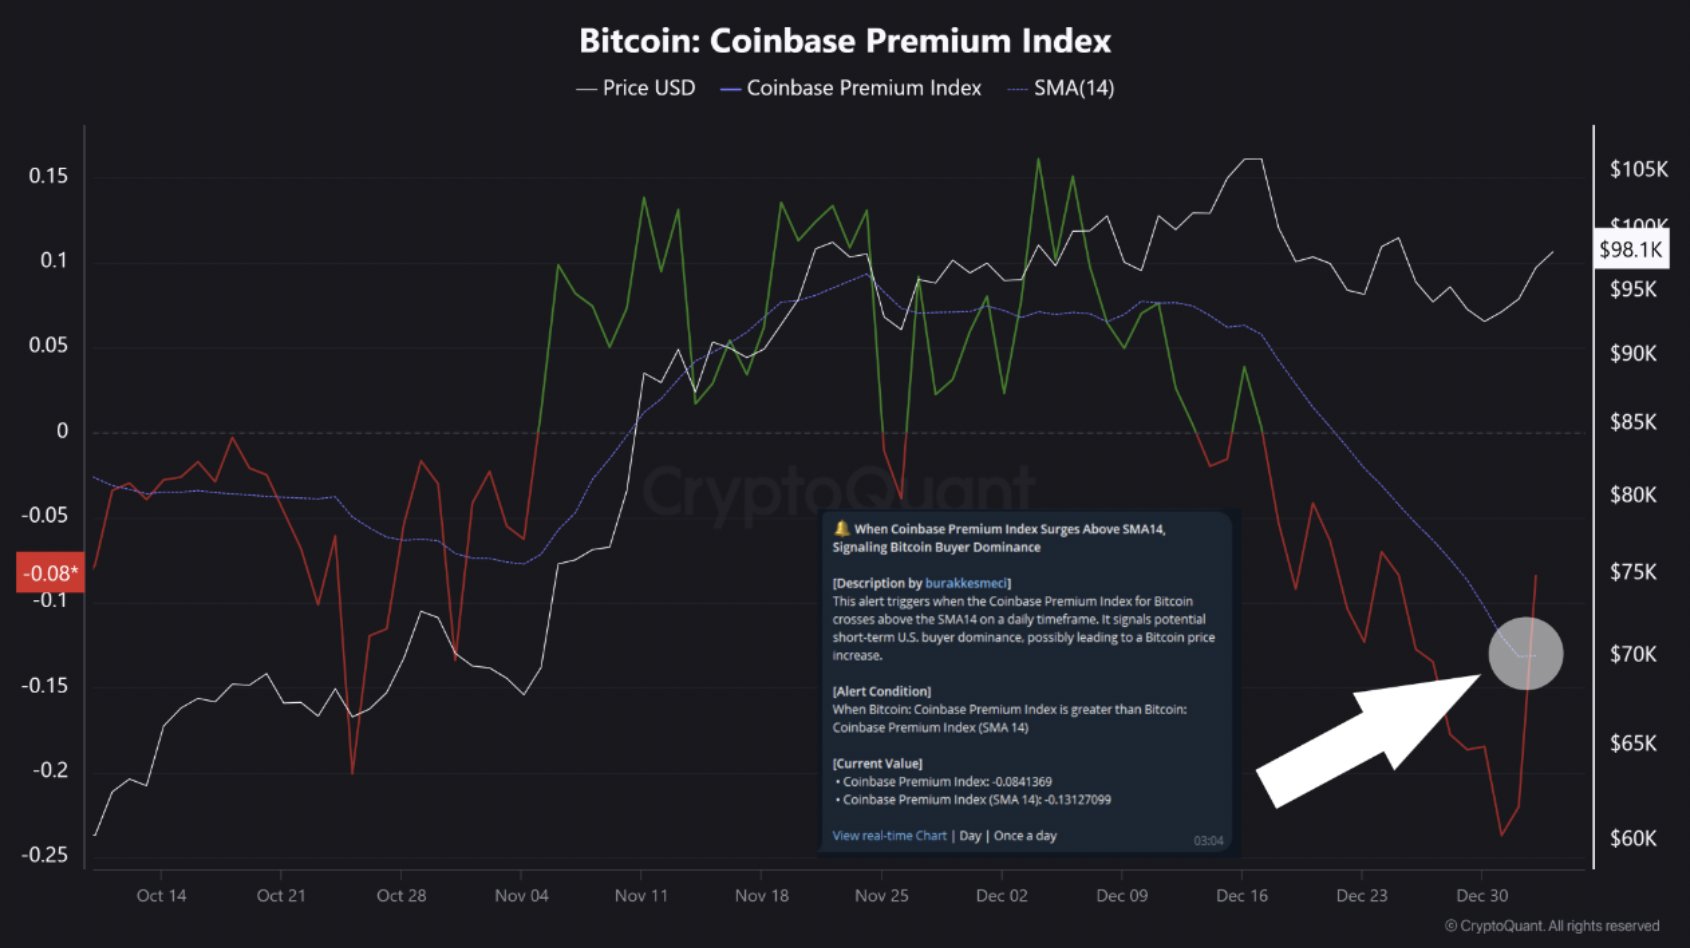
Now, here is the chart shared by the analytics firm that shows the trend in the Bitcoin Coinbase Premium Index, as well as its 14-day simple moving average (SMA), over the last few months:

As displayed in the above graph, the Bitcoin Coinbase Premium Index plunged under its 14-day SMA and into the red territory last month. The cryptocurrency’s price plummeted alongside this venture into the negative zone for the indicator, suggesting the shift in the metric occurred not because of Binance users buying more, but rather due to Coinbase investors taking to selling.
The activity of Coinbase users, who are predominantly from the US, has actually played a key role in BTC price action this year, with the asset’s value often finding itself closely mimicking the trend in the Coinbase Premium Index. Thus, it’s not surprising to see that these investors were the drivers for the recent crash as well.
From the chart, it’s visible that users on the exchange continued to sell into the new year, but during the last few days, the metric has finally shown a reversal. With this surge, its value has crossed back above the 14-day SMA, potentially implying a return of momentum in the market.
CryptoQuant has pointed out that the last time the cryptocurrency showed a similar trend was back in November. Following this previous crossover, the indicator saw a break into the positive region, alongside which Bitcoin enjoyed a rally from the $69,000 level to the new all-time high of $108,000.
It now remains to be seen whether this is the start of a fresh wave of buying from American traders and if it would be similarly bullish for BTC this time as well. Signs have been looking positive so far, as the asset has witnessed recovery above the $100,000 mark since the crossover appeared.
BTC Price
At the time of writing, Bitcoin is trading at around $100,900, up over 7% in the last week.


