Solana Price Prediction: SOL holds $205 support as crypto market tumbles on US jobs data
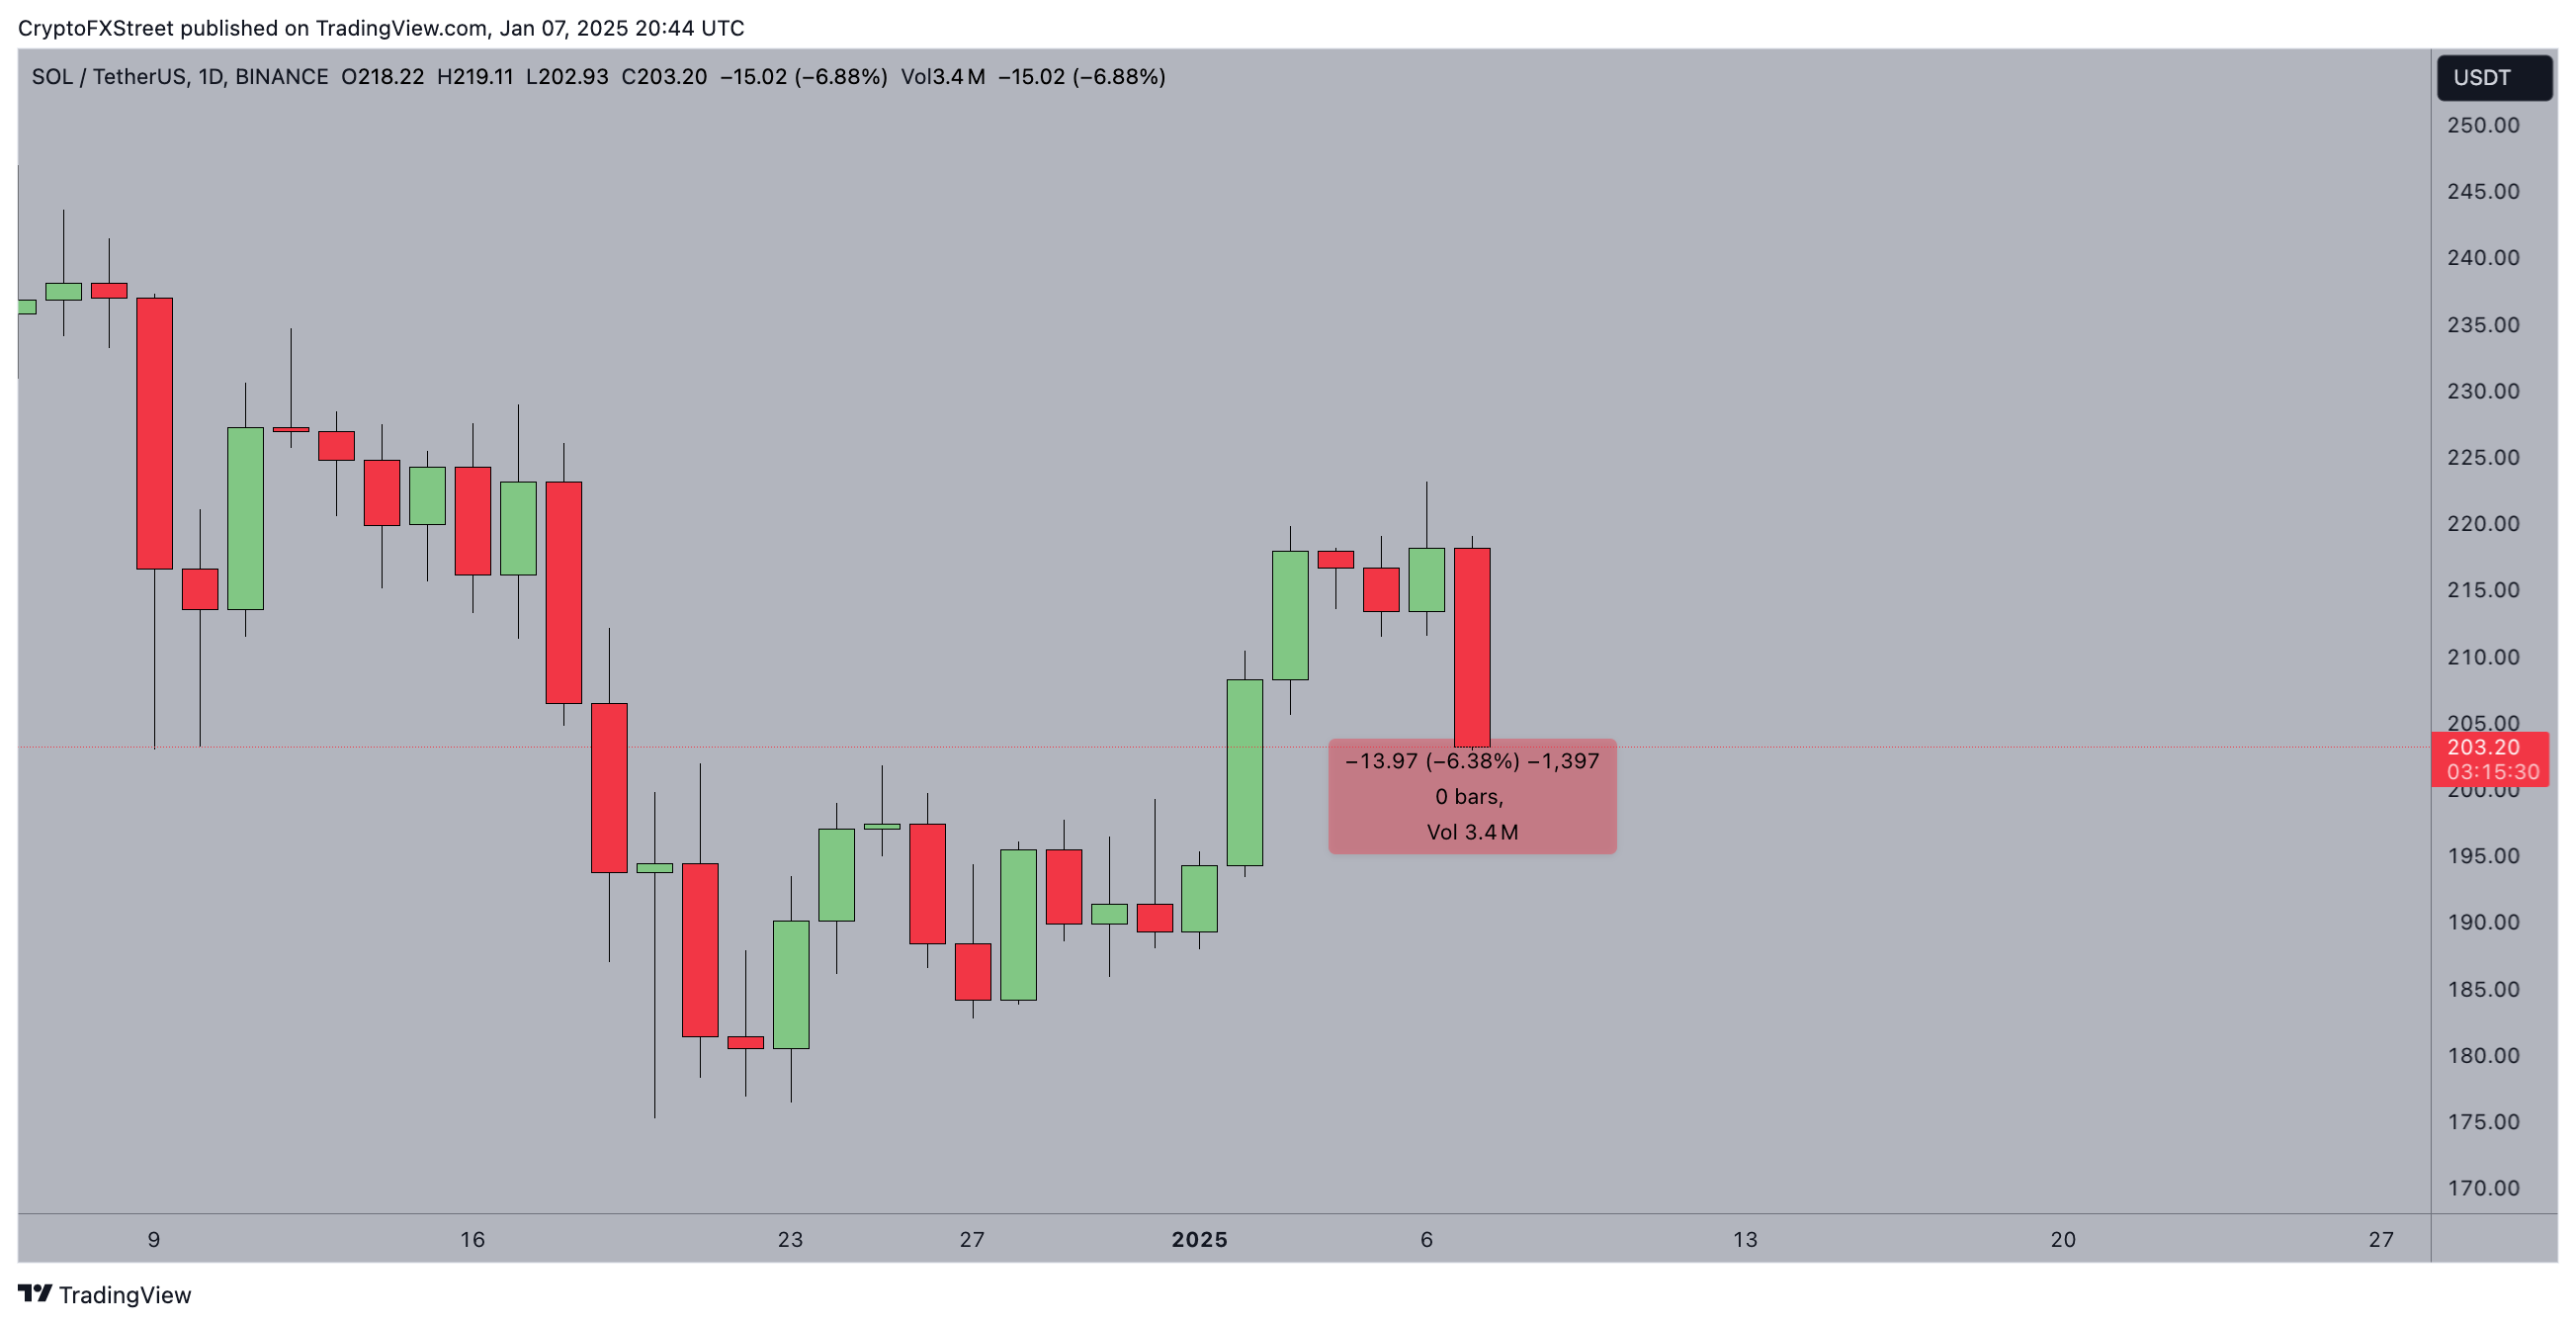
- Solana price plunges 6.4% to find support at $205 on Tuesday, stronger than expected US jobs data sparked rapid liquidations across markets.
- Solana recorded 5 million daily first signers on Monday, signaling persistent network growth.
- The rising popularity of crypto AI agent memes like Fartcoin and Pudgy Penguins has accelerated Solana user acquisition rate.
Solana price held firmly above $205 mark on Tuesday as hawkish undertones in the latest US JOLTs jobs sparked bearish market reactions. Can Solana’s rising network growth provide a buffer for SOL spot prices against rising volatility?
Solana price holds $200 support amid crypto market pullback
Solana price experienced intense volatility as the global crypto market’s positive start to 2025 hit a snag on Tuesday.
The crypto market experienced a considerable pullback as the US JOLTs jobs data published on Tuesday showed a stronger than expected labor market, sparking bearish reactions among traders.
 Solana Price Action (SOLUSD)
Solana price plunged 6% to settle at $204 at press time on Tuesday, having opened trading at $218.
Market reports show that SOL price has shown considerable resilience compared to other mega cap assets like Avalanche and Chainlink, which suffered losses in excess of 10% on the day.
Solana continues to find buyers as AI agent rave intensifies
Despite volatile crypto spot prices, the Solana blockchain network continues to attract a steady flow of new investors.
Thanks to rising popularity of the crypto AI agent narrative, Solana-hosted projects like Pudgy Penguins and Fartcoin (FART) have dominated social discourse, attracting new entrants into the SOL ecosystem.
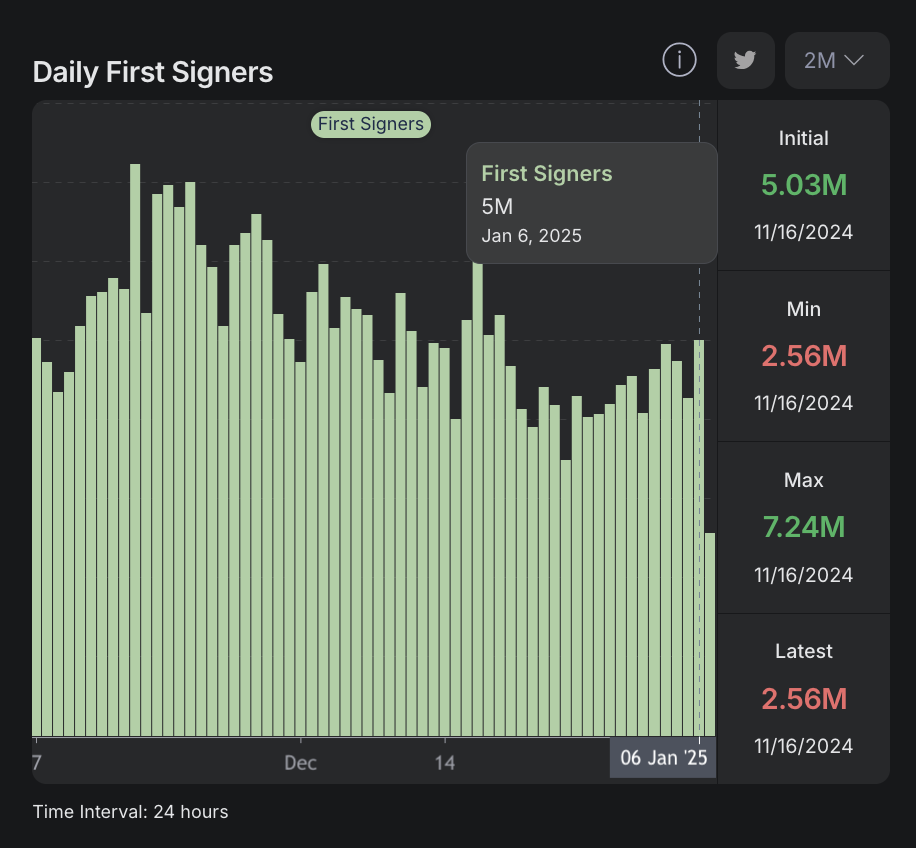
In confirmation of this trend, Hellomoon's Daily First Signers Chart below tracks the total number of unique wallets or users interacting with a particular protocol, blockchain, or application for the first time. This metric provides insights into Solana network growth, adoption and user engagement trends.

Solana Daily First Signers | Source: HelloMooon
The latest data shows Solana attracted 5 million Daily First Signers on January 6, its highest in over two weeks, dating back to December 19.
This signals a considerable number of new users join the Solana network, despite crypto markets wobbling in the last 24 hours.
The increased capital inflows from new entrants can help provide a buffer for SOL spot prices amid bearish tailwinds from the hawkish readings in US jobs data.
This partly explains why SOL bulls have managed to keep its daily time frame losses subdued at 6%, avoiding a major breakdown below the $200 support level.
Solana Price Forecast: Major rebound ahead if $200 support holds
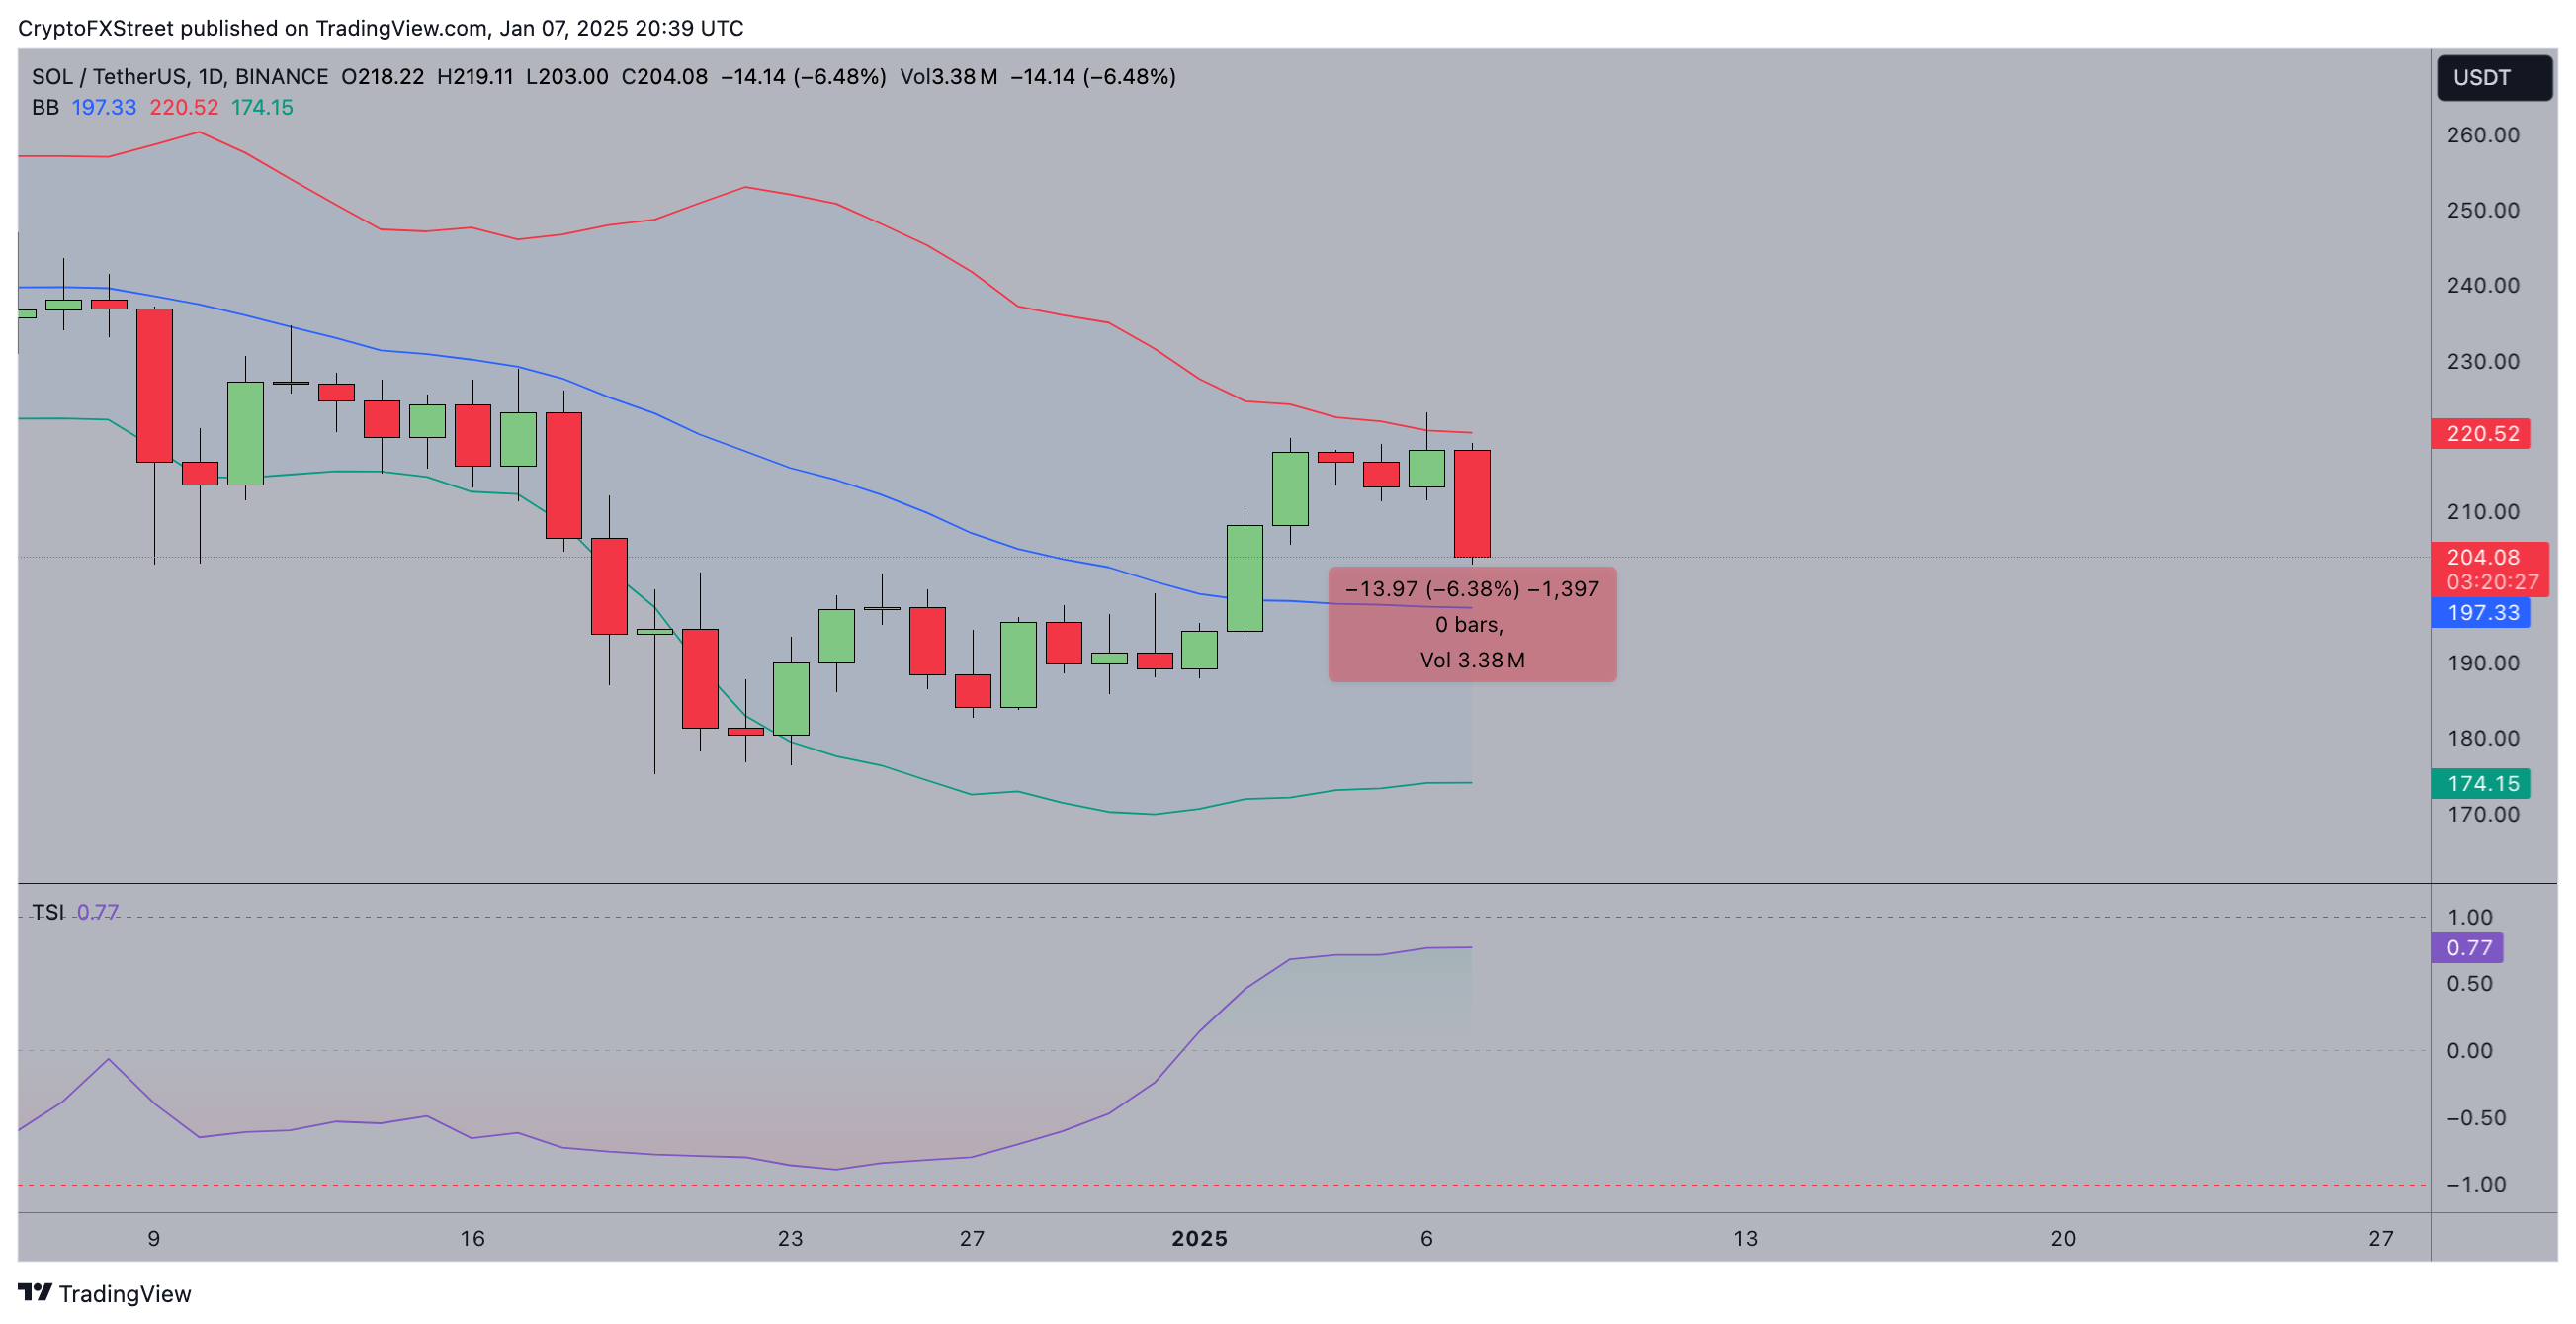
The SOL/USD daily chart shows Solana declining 6.48% today to $204, with the $200 support in focus. Bollinger Bands (BB) indicate a contraction, suggesting reduced volatility. Price action remains below the upper BB ($220.52) but above the lower band ($174.15), hinting at potential stabilization.

Solana Price Forecast | SOLUSD
The Total Strength Index (TSI) at 0.77 reflects bullish momentum despite today’s drop.
If $200 holds, buyers may attempt recovery, targeting the $220 resistance marked by the 50-day Moving Average (blue). A breakout above could signal renewed bullish momentum toward $240.
On the flip side major bearish risks could emerge if the $200 support caves.
In this scenario sellers may push prices toward $174, the lower BB boundary.

