PEPE Market Cap Hits $10 Billion, Flips Litecoin After 18% Price Increase
PEPE, the frog-themed meme coin, has achieved a significant milestone by surpassing a $10 billion market cap for the first time. This surge came after PEPE’s price spiked by 18% in the last 24 hours, briefly reaching a new all-time high.
As a result of this increase, PEPE has now surpassed Litecoin (LTC) in market cap standings. Here’s a breakdown of the events that led to this remarkable achievement.
The Ethereum Meme Coin Climbs to the 21st Position
On Saturday, December 7, PEPE had a market cap of around $9.07 billion with a price of $0.000021. However, a strong 18% surge pushed the price to $0.000027 before slightly dipping to $0.000025, where it currently sits.
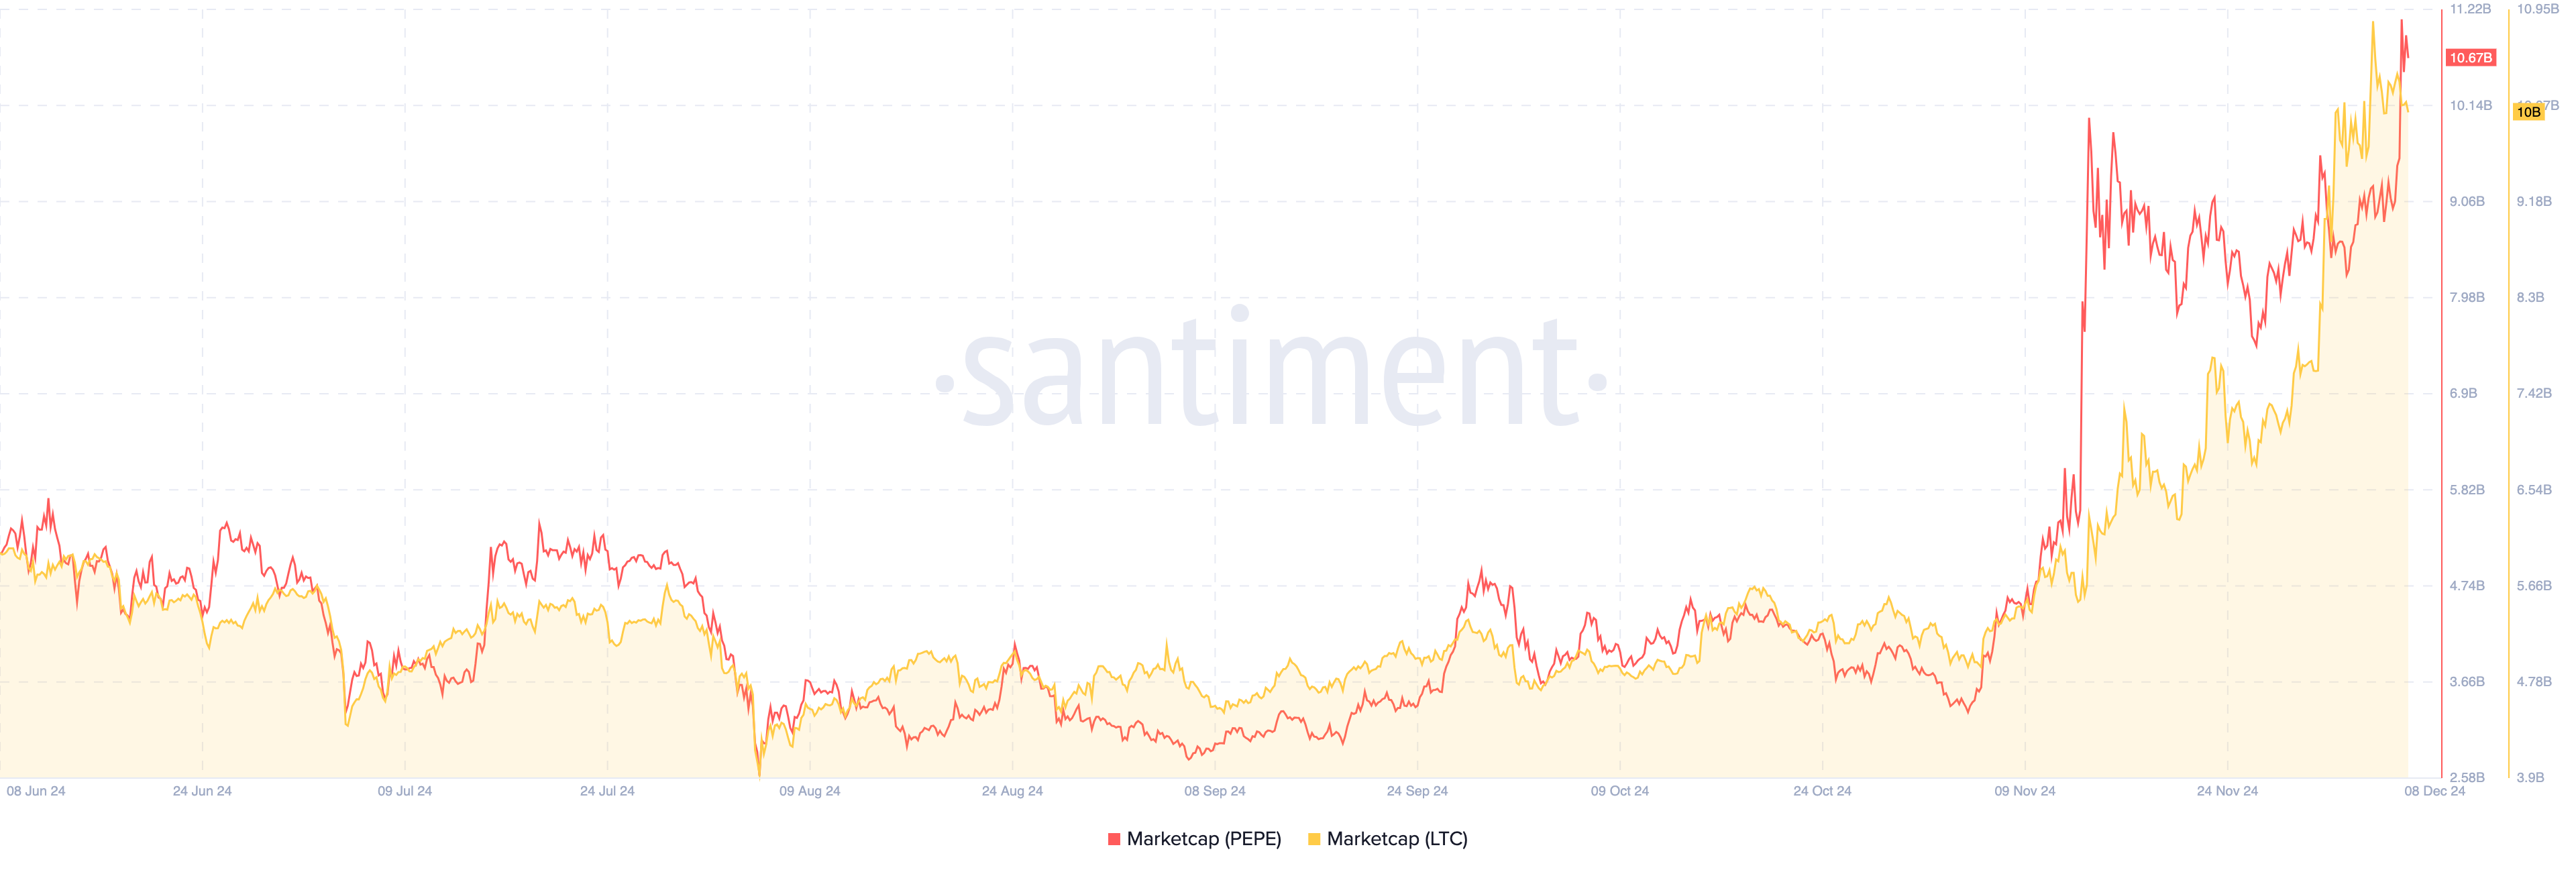
This price movement propelled PEPE’s market cap to an impressive $10.67 billion. With 420 trillion tokens in circulation, the price increase clearly played a crucial role in achieving this milestone.
As a result, PEPE now ranks as the 21st most valuable cryptocurrency, surpassing Litecoin, whose market cap remains at $10 billion.
 Pepe vs Litecoin Market Cap. Source: Santiment
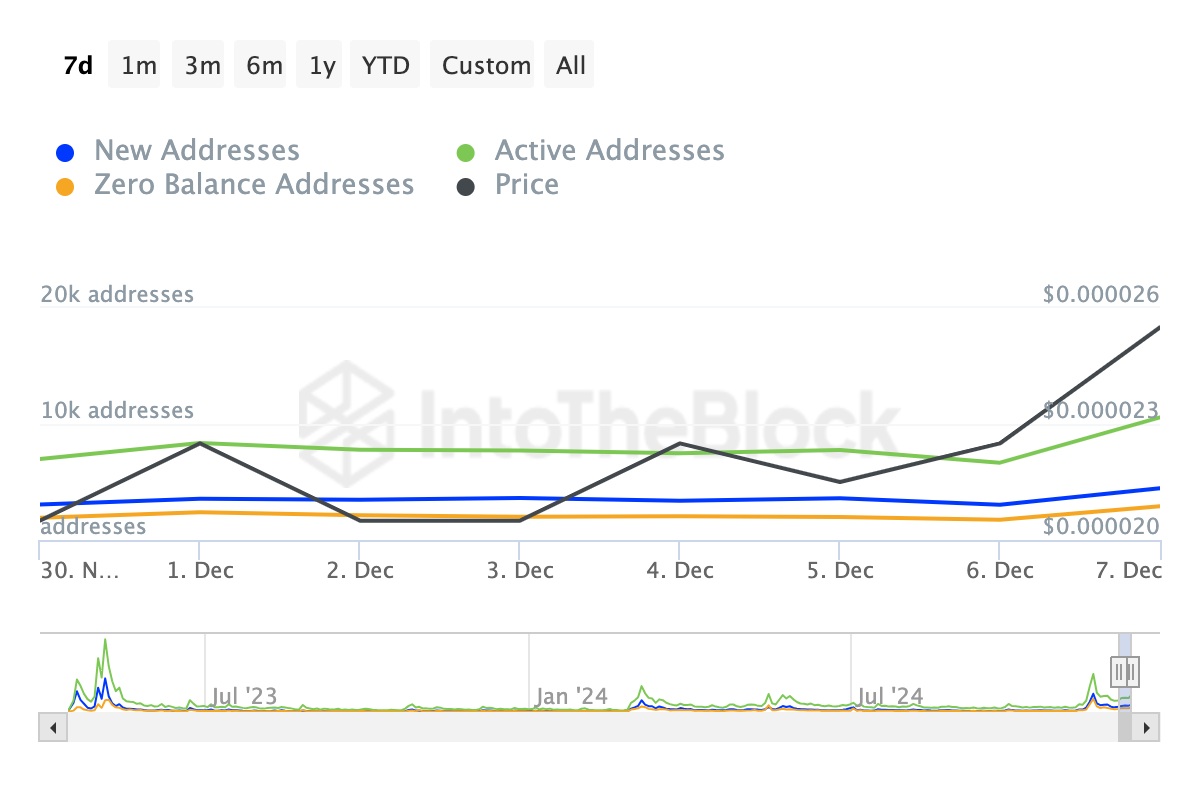
BeInCrypto’s analysis reveals that PEPE’s recent market cap milestone can be attributed to a significant spike in network activity. Data from IntoTheBlock highlights an increase in active, new, and zero-balance addresses—key metrics that point to growing demand for the token.
Active addresses track the number of unique wallets engaging in transactions, while new and zero-balance addresses measure first-time users and those adding PEPE to their wallets.
The rise in these metrics signals greater user engagement and bullish momentum. If this trend continues, PEPE might not stop at reclaiming its all-time high but potentially see further price gains.
 Pepe Network Activity. Source: IntoTheBlock
PEPE Price Prediction: Another All-Time High Close
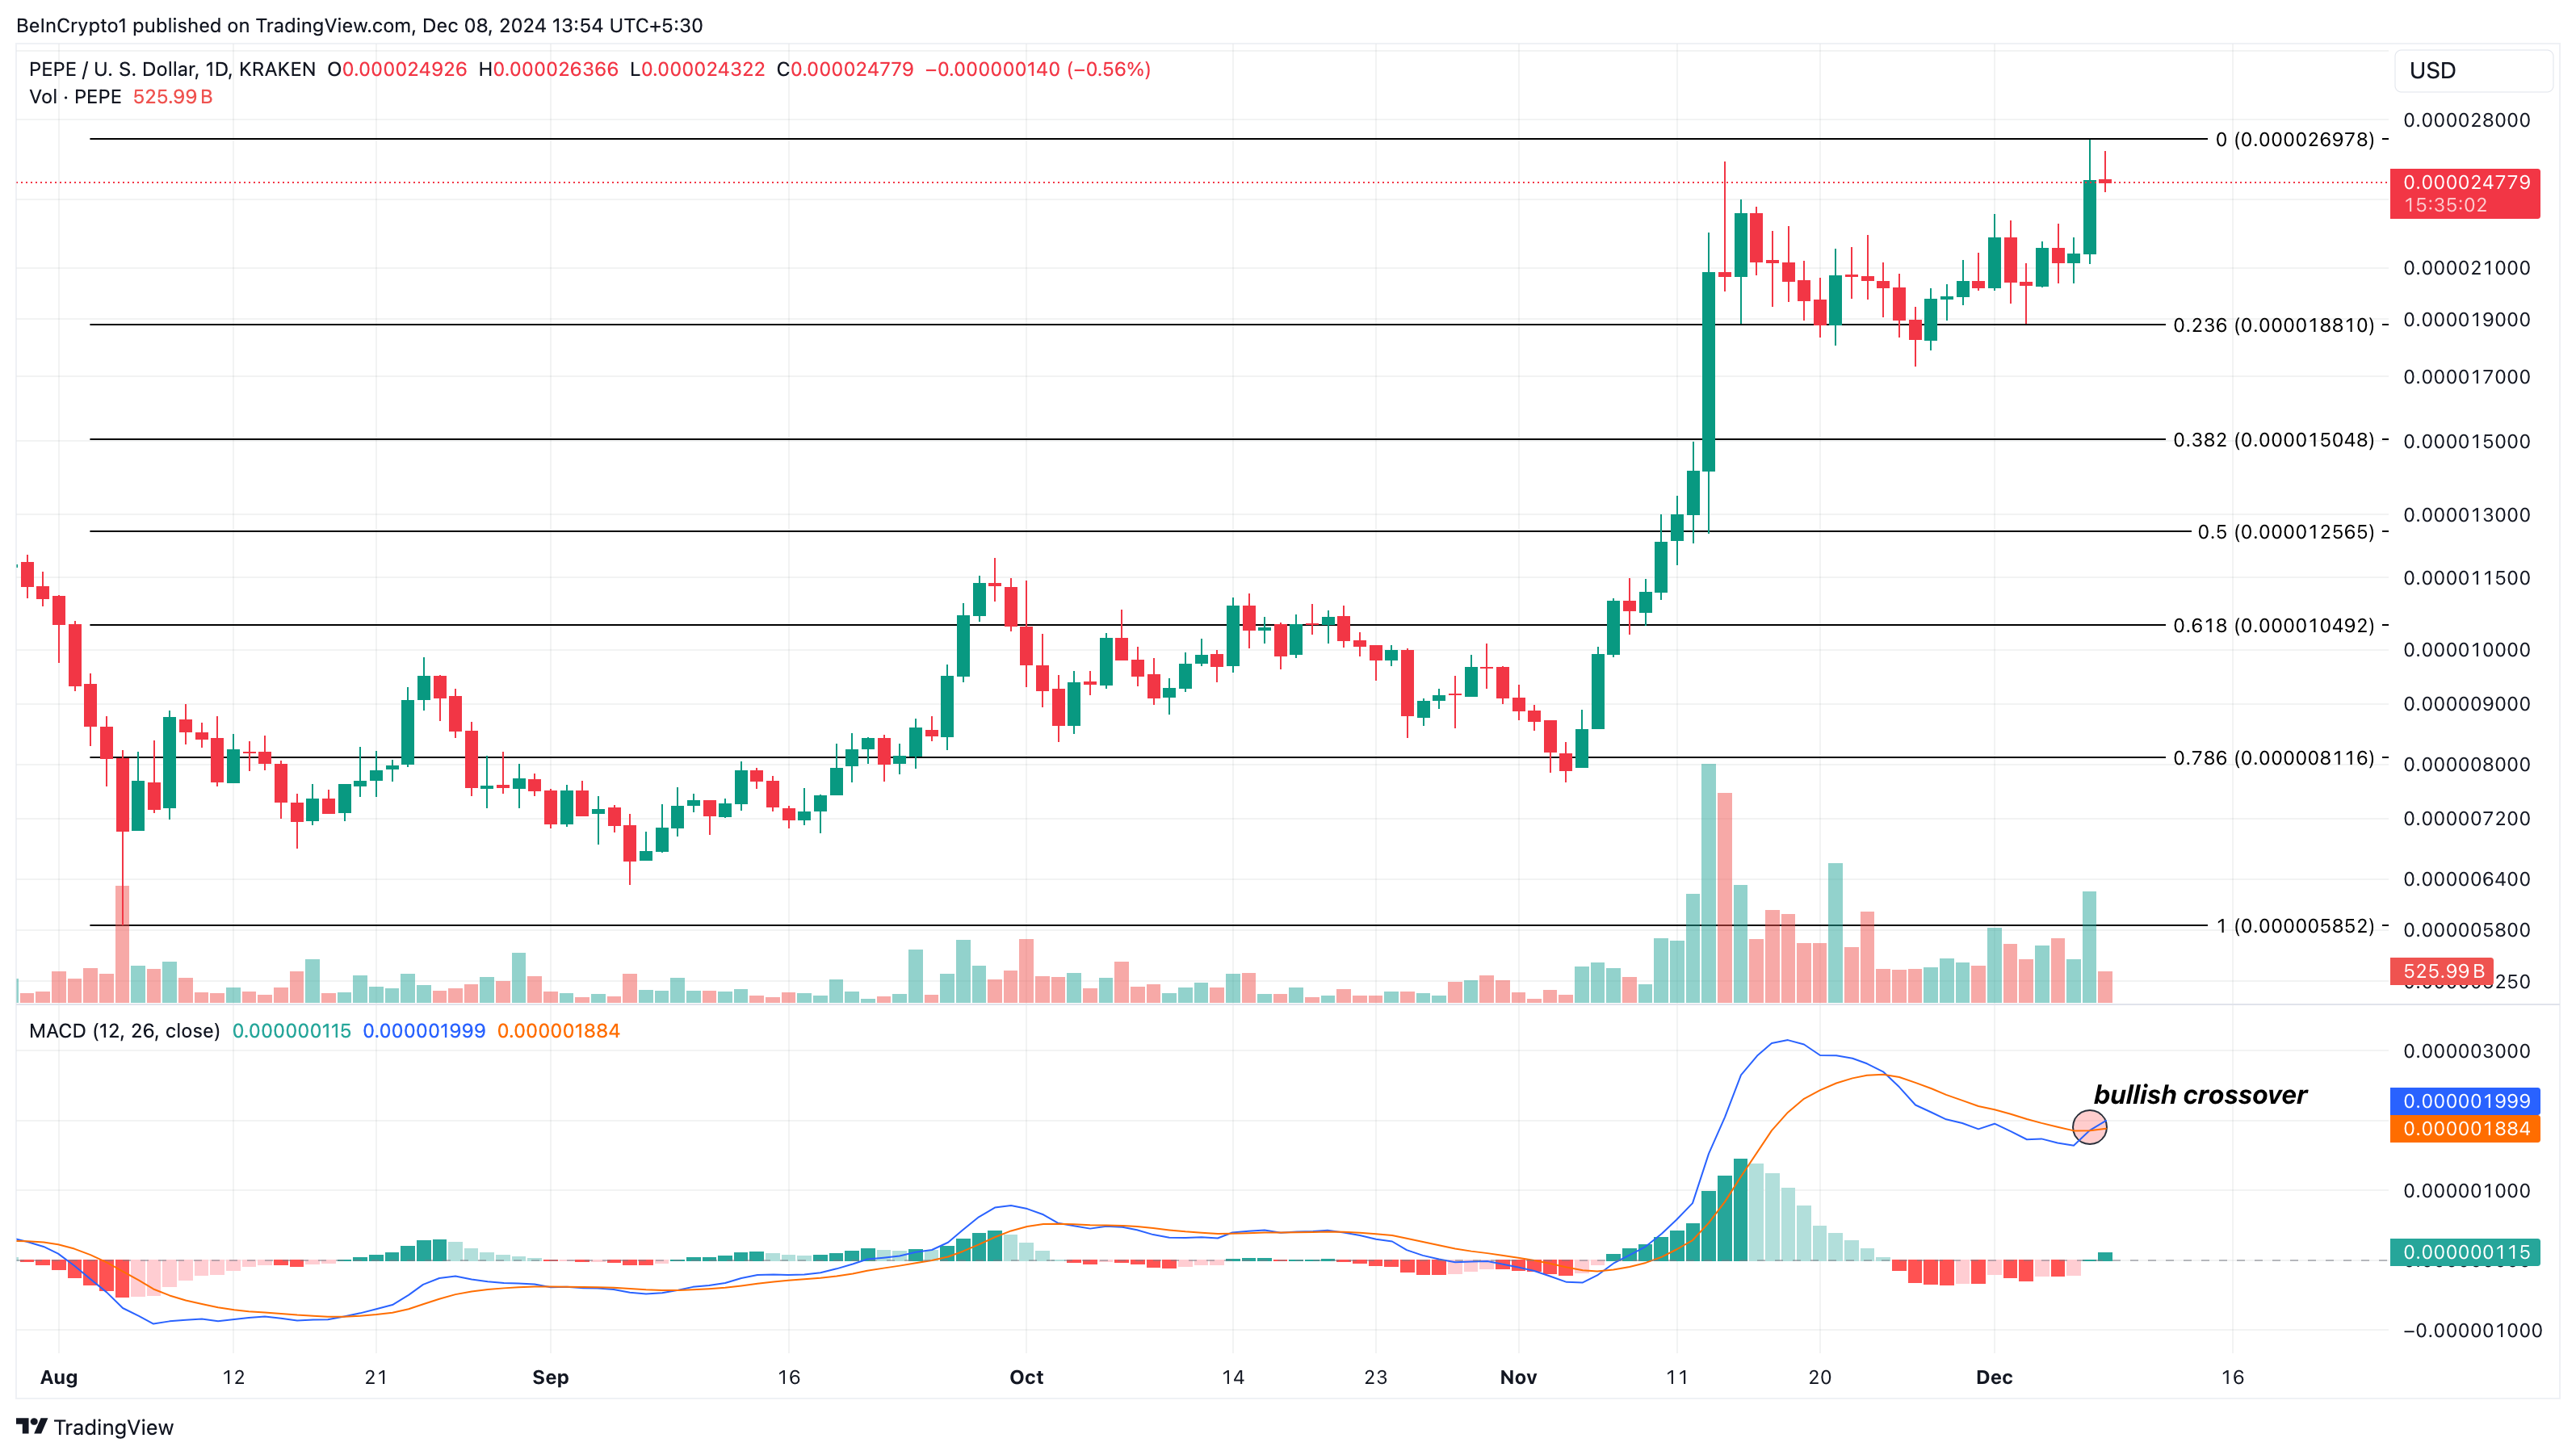
On the daily chart, the Moving Average Convergence Divergence (MACD) has moved from negative to positive. The MACD is a technical oscillator that measures momentum by using the difference between the 12 and 26 Exponential Moving Averages (EMA).
When the 12 EMA (blue) rises above the 26 EMA (orange), the momentum is bullish. On the other hand, if the 26 EMA crosses above the 12 EMA, the trend is bearish. As seen below, the shorter EMA has crossed above the longer one, suggesting that the meme coin’s value could surpass the resistance at $0.000025.
 Pepe Daily Analysis. Source: TradingView
If this happens, the PEPE’s price might rally toward $0.000030. However, if bears tug the price back from $0.000025, this prediction might not come to pass. In that scenario, the price might drop to $0.000015, and PEPE’s market cap could slide below $10 billion.


