Worldcoin (WLD) Breaks Out of Descending Channel as Bulls Target $4
Worldcoin’s (WLD) price has increased by 10% in the last 24 hours, making it one of the best-performing altcoins in the top 100. This Worldcoin price increase puts the token’s value at $2.90.
However, according to several indicators, this rise might just be the beginning of a sustained rally that takes WLD higher. Here is how.
Worldcoin Rises Past Bearish Dominance, Volume Follow
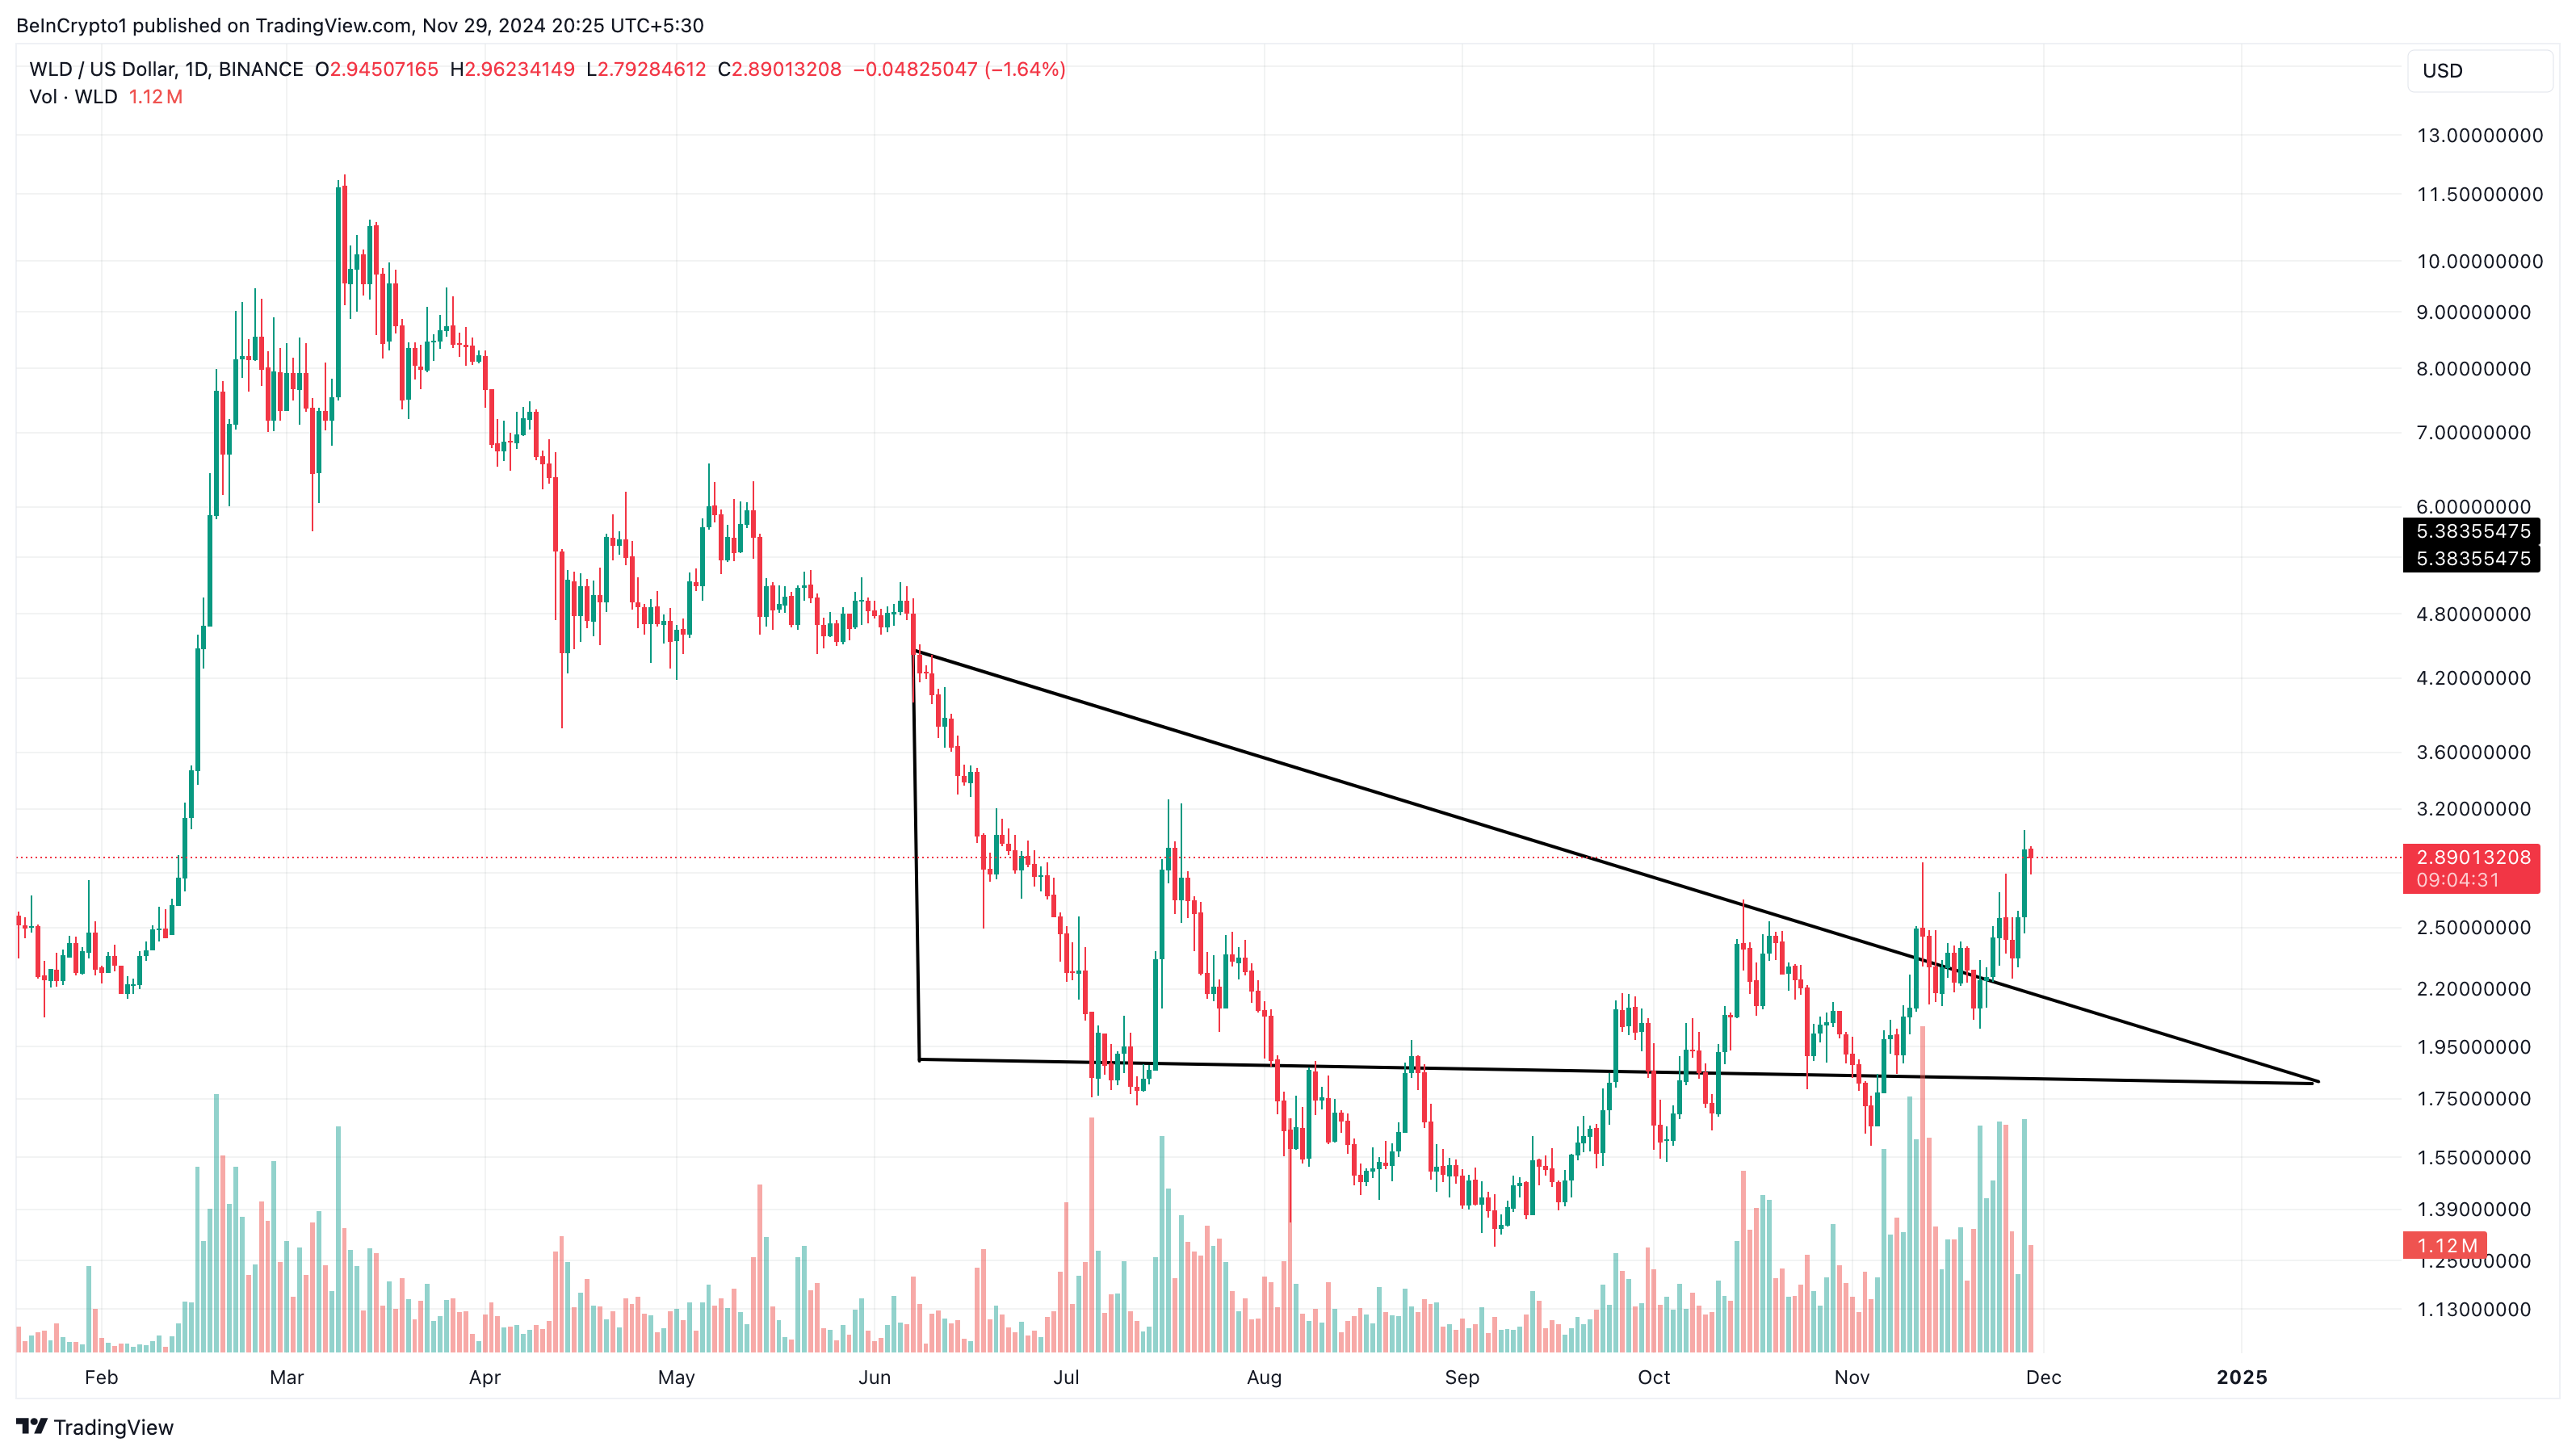
Between June 6 and November 21, WLD traded within a descending triangle. A descending triangle is a bearish chart pattern defined by a downward-sloping upper trendline and a flat, horizontal lower trendline. This formation typically signals potential downward price movement as sellers gain control.
When a cryptocurrency’s price breaks below the horizontal support, it indicates that the downtrend might intensify. But as of this writing, Worldcoin has broken out of it, indicating that the altcoin is on a bullish path.
If sustained, the Worldcoin’s price increase could go higher than $3 in the short term. However, to validate that, one has to assess the position of other metrics.
 Worldcoin Daily Analysis. Source: TradingView
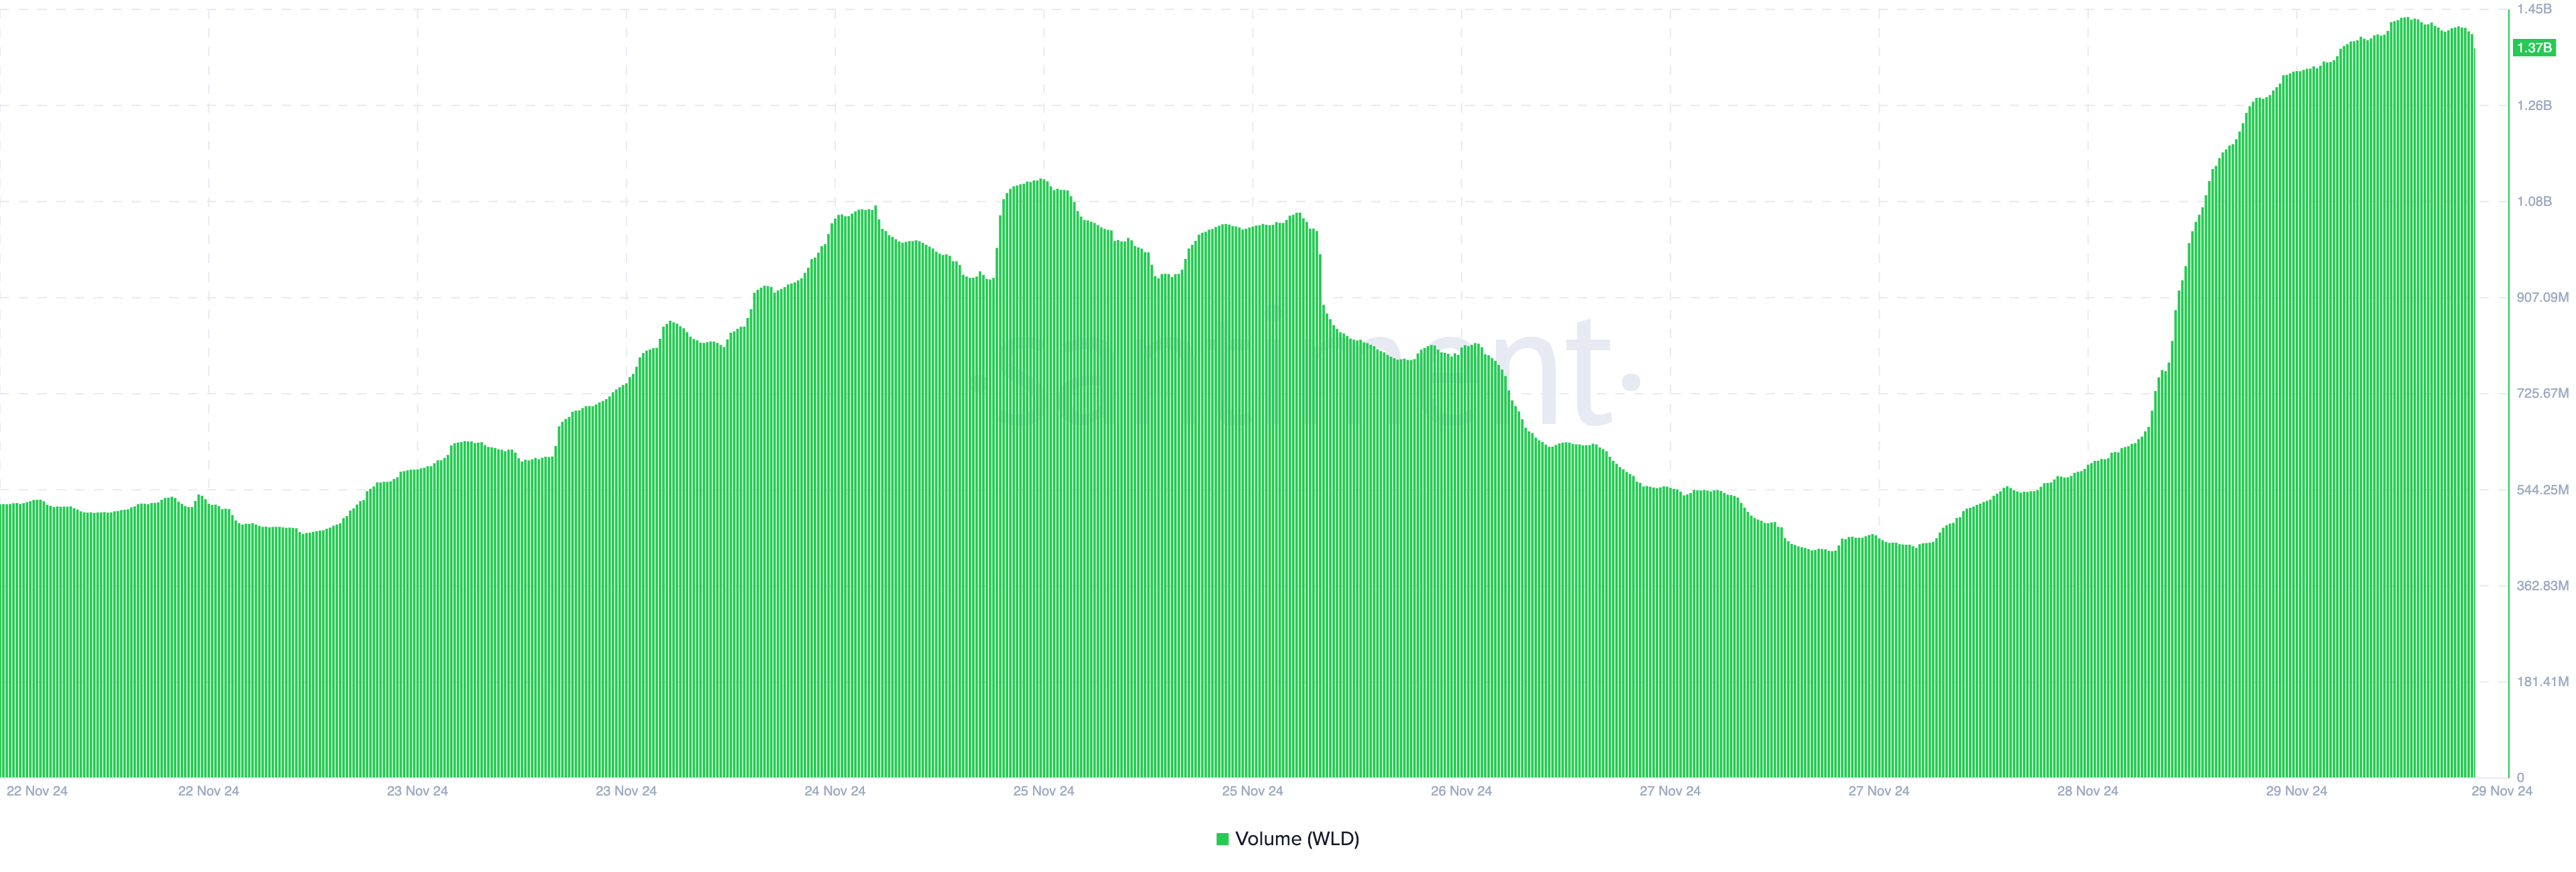
One metric supporting a further hike is WLD’s volume. The volume shows whether the market is actively trading a token. When it increases, more liquidity is flowing into the cryptocurrency.
On the other hand, if the volume drops, the crypto is less liquid. Furthermore, the volume can tell the direction in which the price can move. Typically, when the volume rises alongside the price, it means the trend is bullish.
However, falling volume on rising prices indicates that the uptrend is weak. Since the Worldcoin price increase coincides with a hike in volume, it suggests that the altcoin’s value might continue to rise.
 Worldcoin Volume. Source: Santiment
WLD Price Prediction: $4, Then $5 Could Come
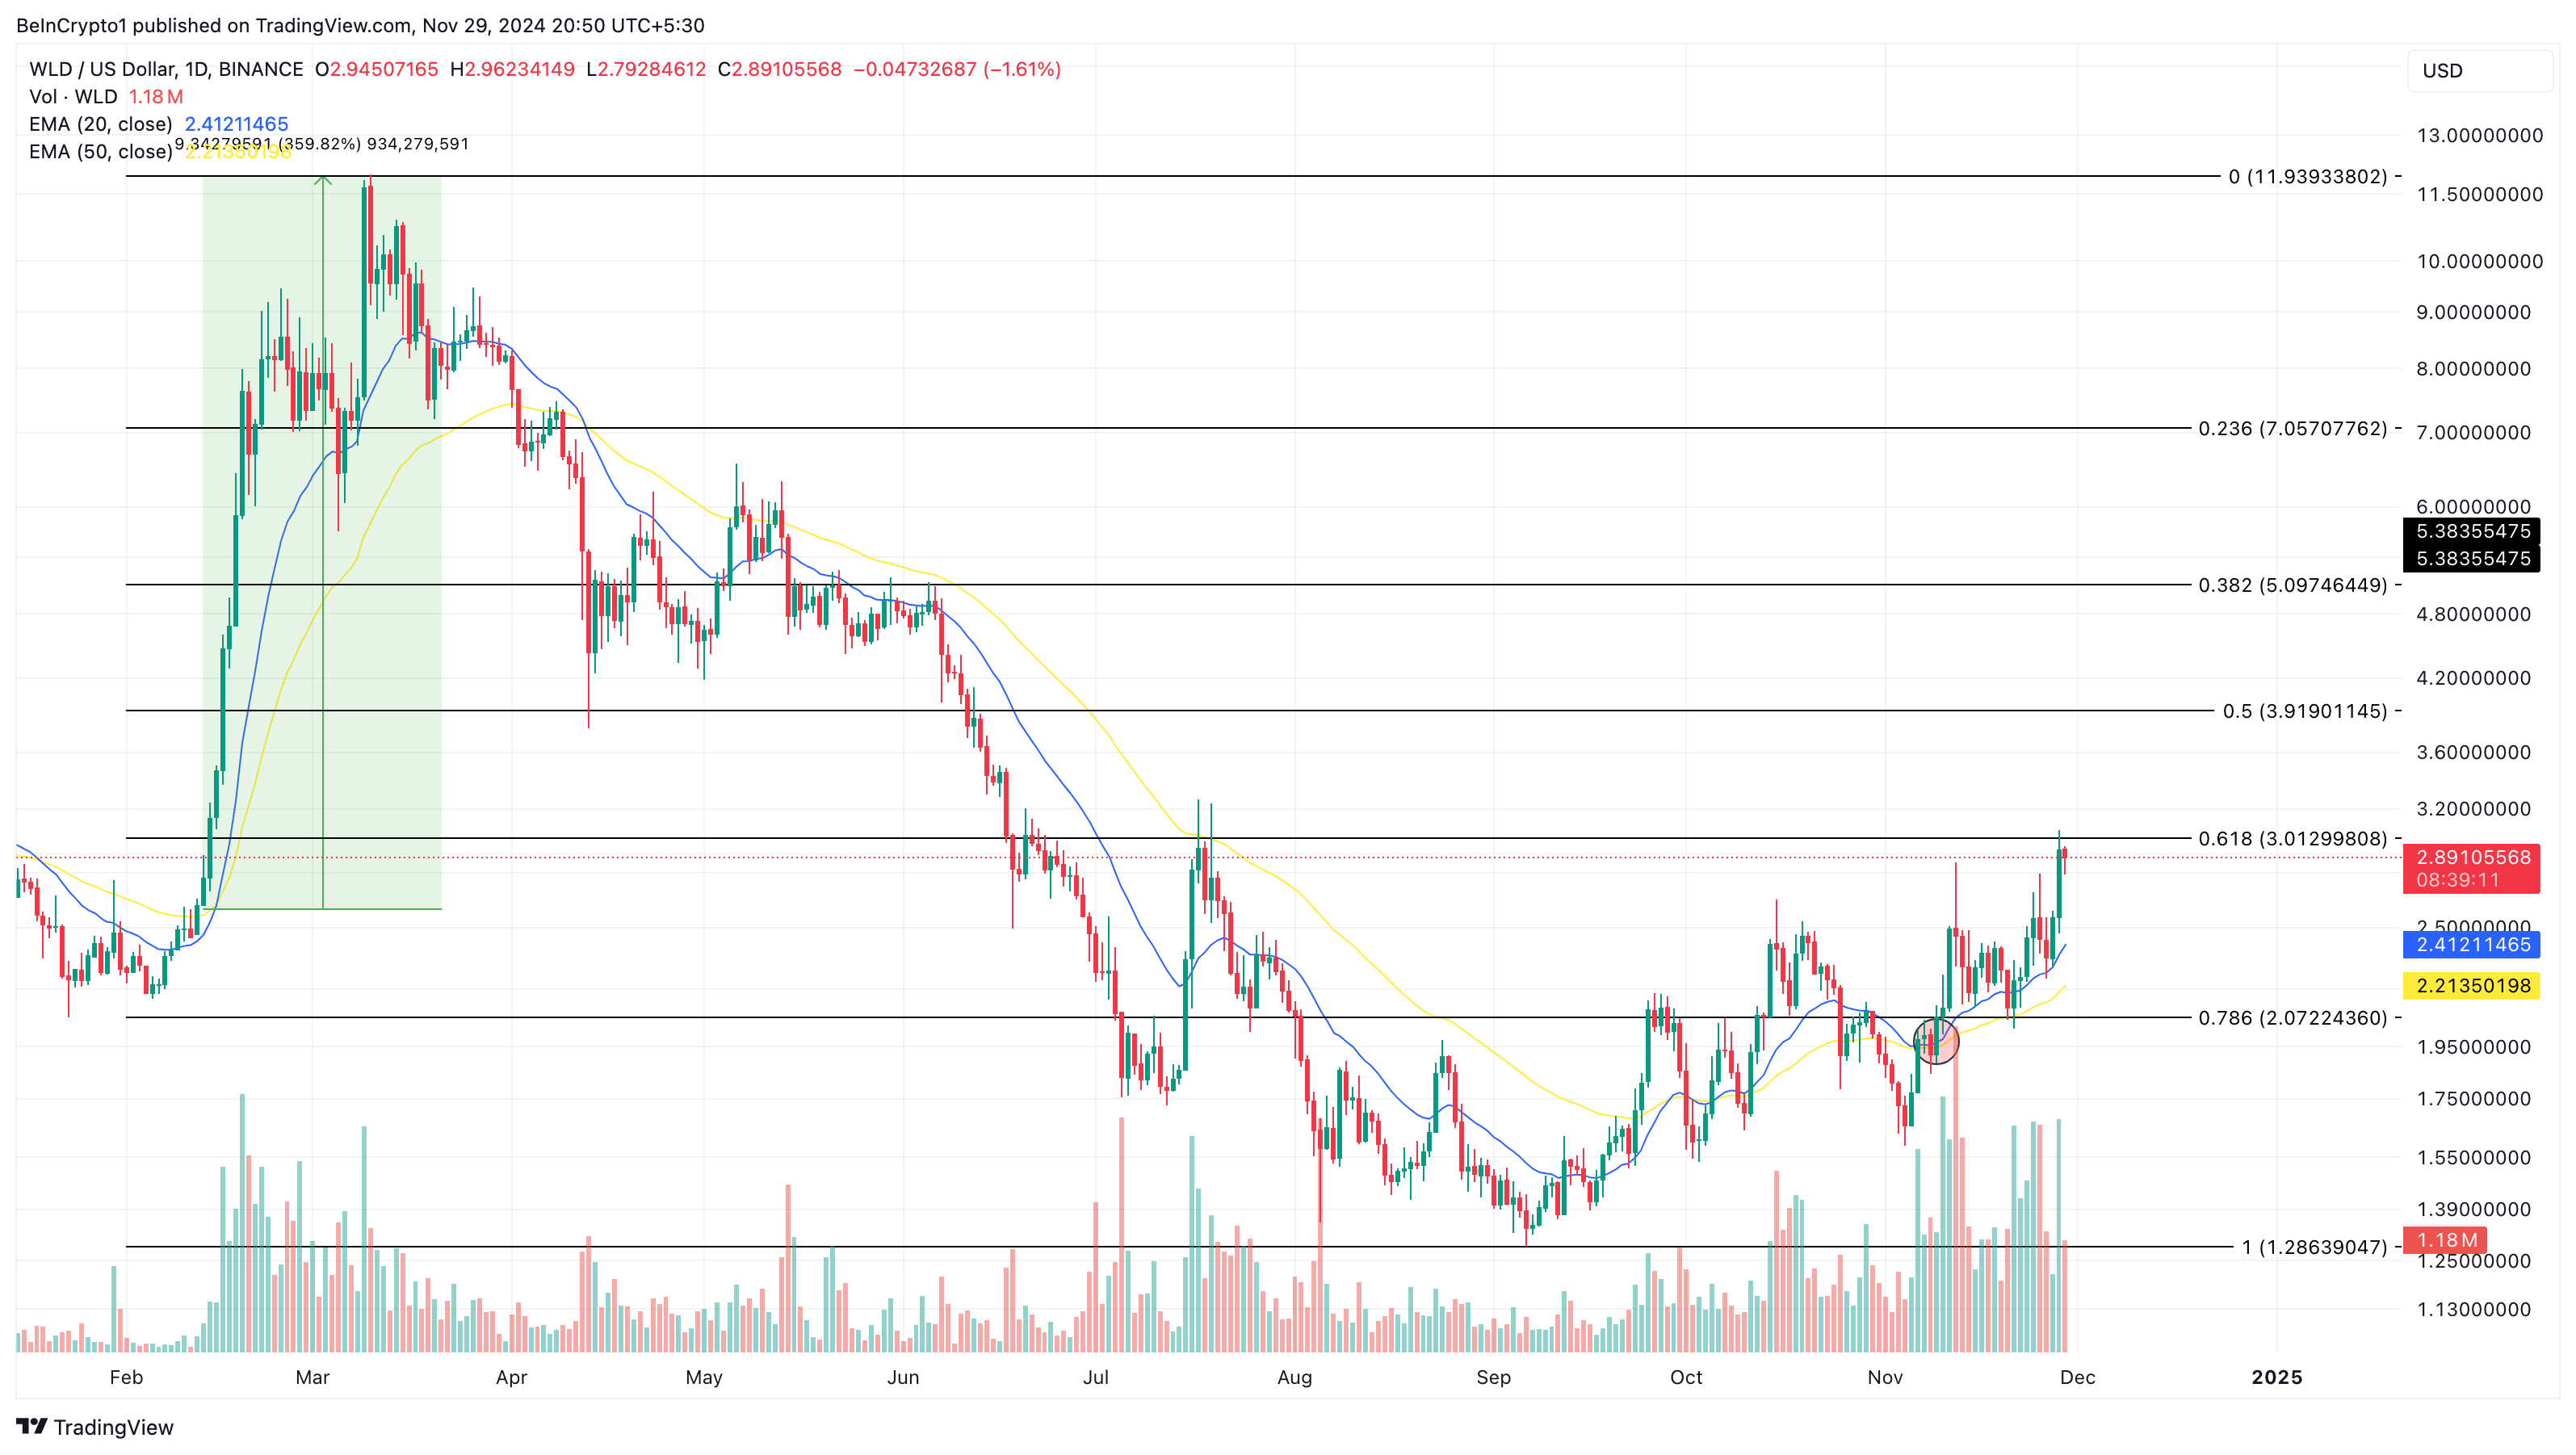
On the daily chart, Worldcoin’s price has risen above the 20- and 5-period Exponential Moving Average (EMA), a technical indicator that measures a cryptocurrency’s trend.
When the indicator goes downwards and is above the price, the trend is bearish. On the other hand, if the EMAs are below the price and rising, the trend is bullish. The last time such occurred, WLD price rallied above $11.
Should the pattern rhyme with the historical trend, Worldcoin’s price might rise to $3.92. If bulls sustain the trend, then the altcoin might climb above $4 and possibly to $5.10.
 Worldcooin Daily Analysis. Source: TradingView
However, should the token drop below the EMA again, the WLD price prediction might not come to pass. Instead, it might decline to $2.07.


