


Cardano (ADA) Large Transactions Decline By $19 Billion Amid Weak Network Activity
On November 23, the total Cardano (ADA) large transaction volume was $45.41 billion. Today, the same volume has dropped to $26.34 billion, suggesting that large investors in the market have reduced their exposure to the cryptocurrency.
Sometimes, situations like this suggest that the altcoin’s price could be affected negatively. But could it be the case for ADA?
Cardano Sees Drop in Key Areas
In crypto, large transactions track the activity of institutional players and whales making trades worth over $100,000. An increase in large transaction volume suggests heightened engagement from these key stakeholders.
Conversely, a decline often indicates that institutions or whales may be liquidating their holdings. In Cardano’s case, the large transactions have dropped by $19 billion over the past six days.
Historically, ADA’s price has often risen alongside a surge in large transactions. For instance, the image below shows an increase in the metric between November 16 and 23.
During that period, the altcoin’s value climbed from $0.57 to $1.09, suggesting that whales played a big part in the hike. Therefore, if the current decline persists, the token could face further downside pressure.
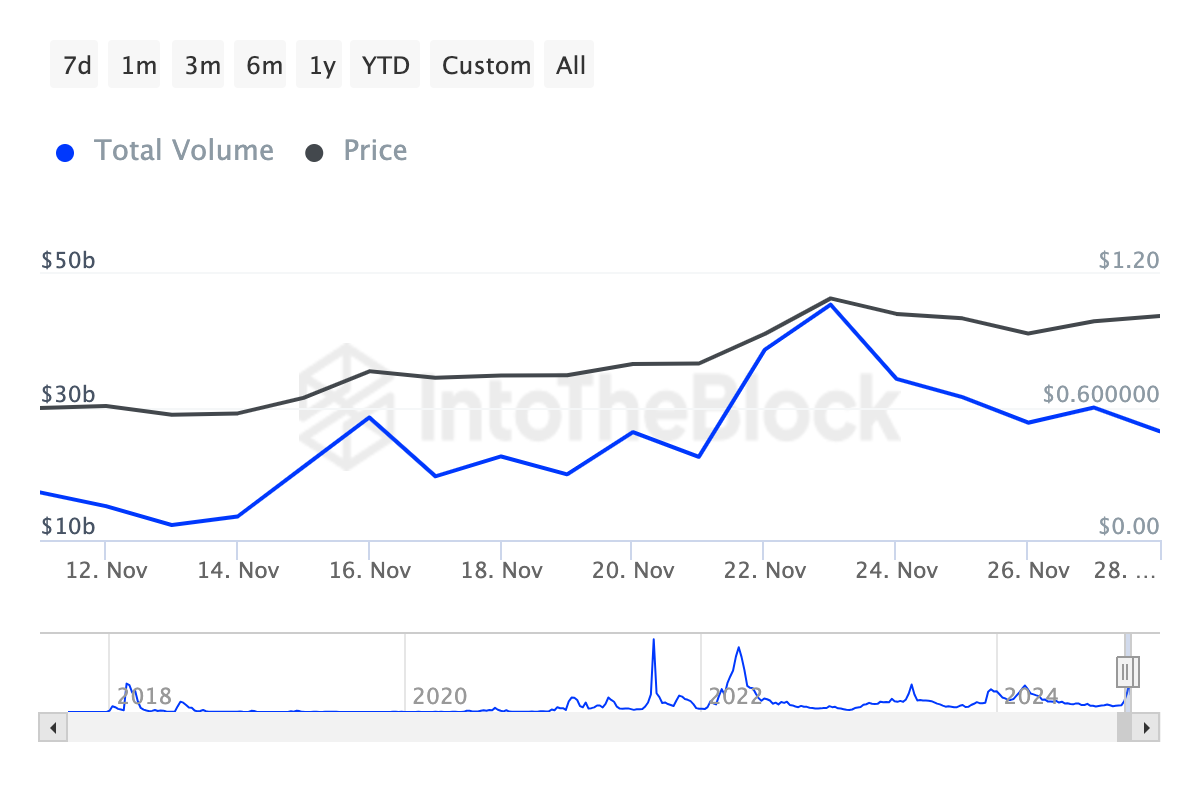 Cardano Large Transaction Volume. Source: IntoTheBlock
Large transactions aren’t the only aspect of the Cardano ecosystem facing a decline. According to data from Santiment, overall network activity has also dropped significantly.
On-chain metrics such as active addresses are key indicators of network health. Active addresses refer to users who have previously interacted with the cryptocurrency and remain engaged in transactions.
Over the past seven days, active addresses on the Cardano network have declined, indicating waning user participation. This trend reflects a bearish sentiment surrounding ADA.
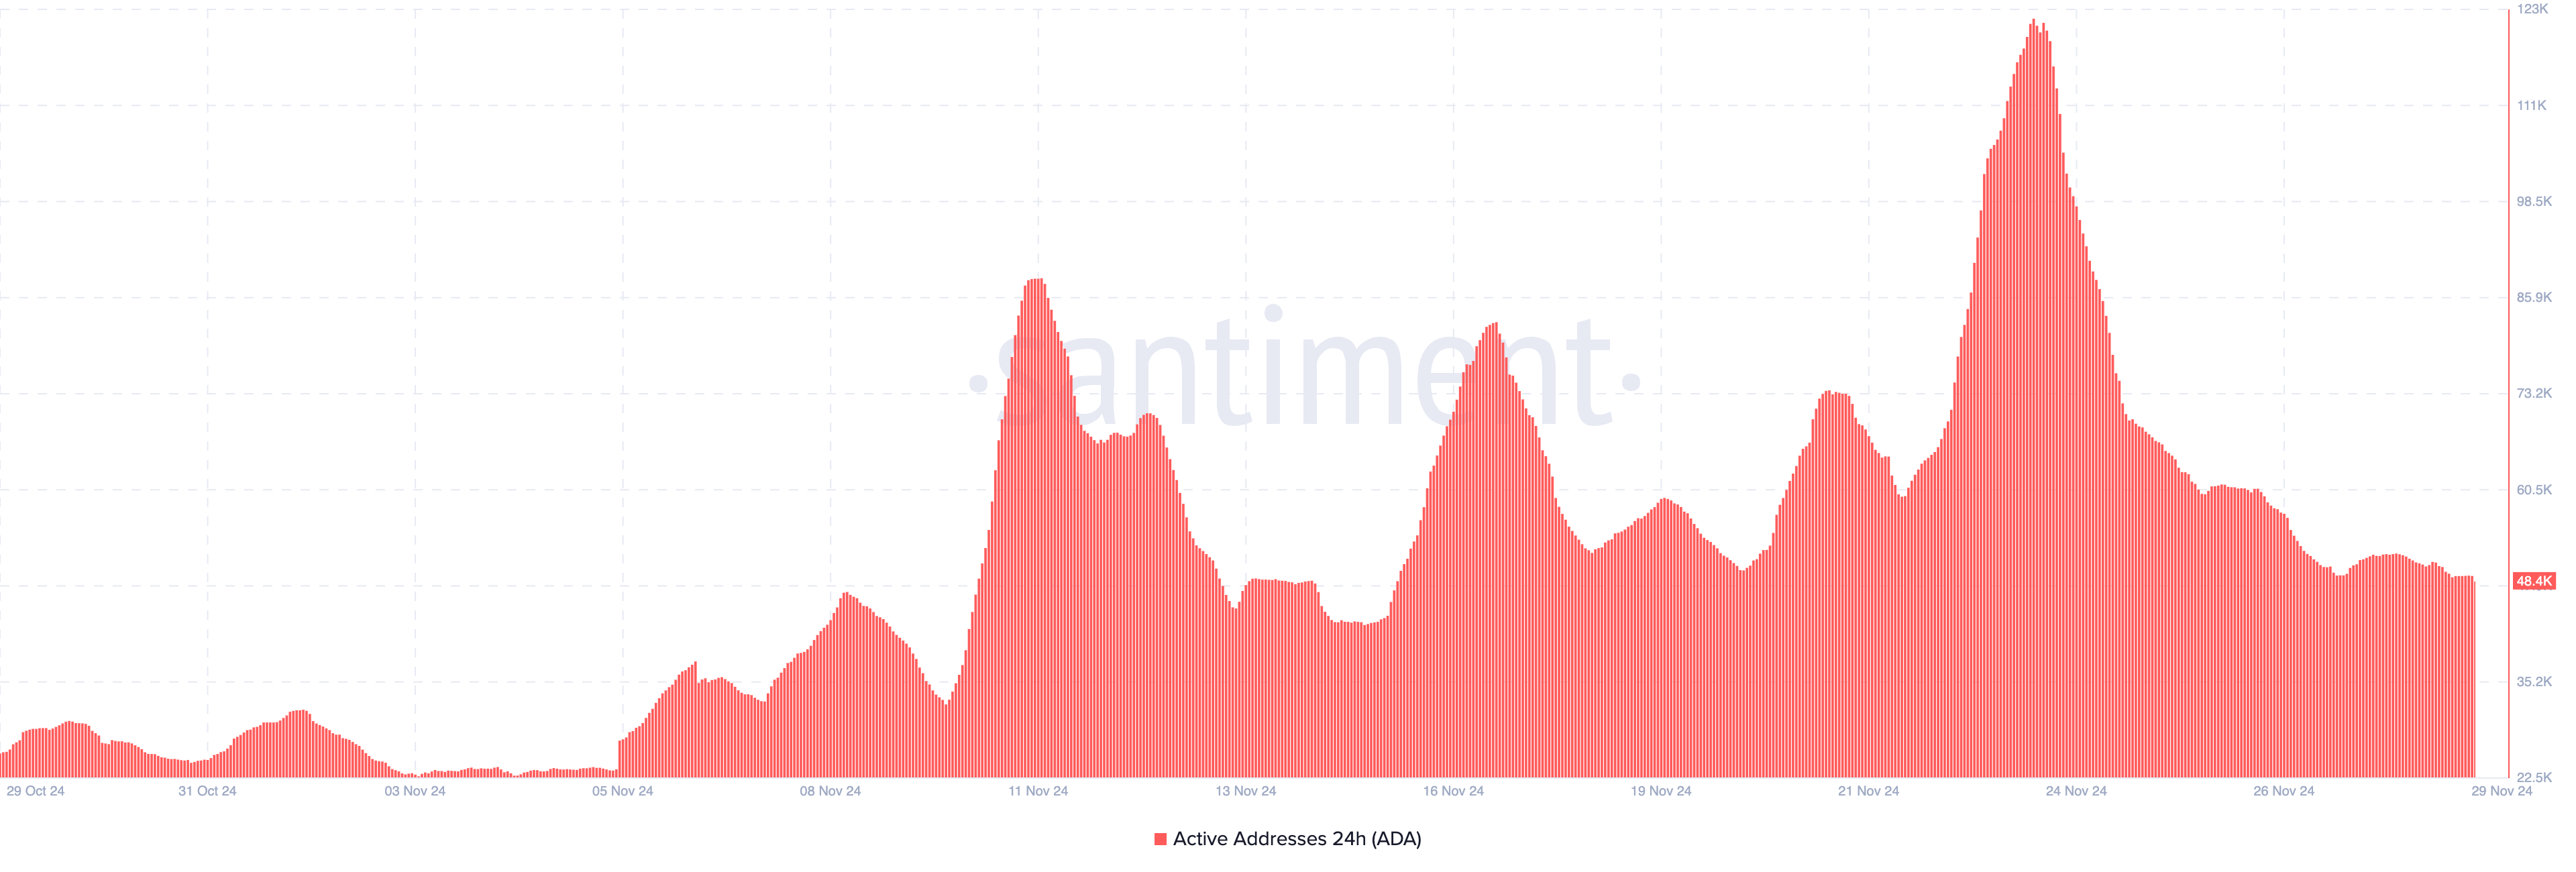 Cardano Active Addresses. Source: Santiment
ADA Price Prediction: Retracement to $0.82?
On the daily chart, ADA’s price trades around $1.04. However, the Relative Strength Index (RSI) has a reading of 76.91. The RSI measures momentum using the speed and size of price changes.
It also tells when a cryptocurrency is overbought or oversold. When the reading is above 70.00, it is overbought. Conversely, when it is below 30.00, it is oversold.
Considering the current outlook, it appears that ADA’s price is overbought, and a decline could be next.
The Bollinger Bands (BB) — an indicator that measures volatility, also validates this bias. The BB, like the RSI, also gauges if an asset is overbought or oversold. When the upper band of the indicator toches the price, it is overbought.
But when the lower band hits the value, it’s oversold. With the upper band of the BB close to hitting ADA, the price could decrease to $0.82.
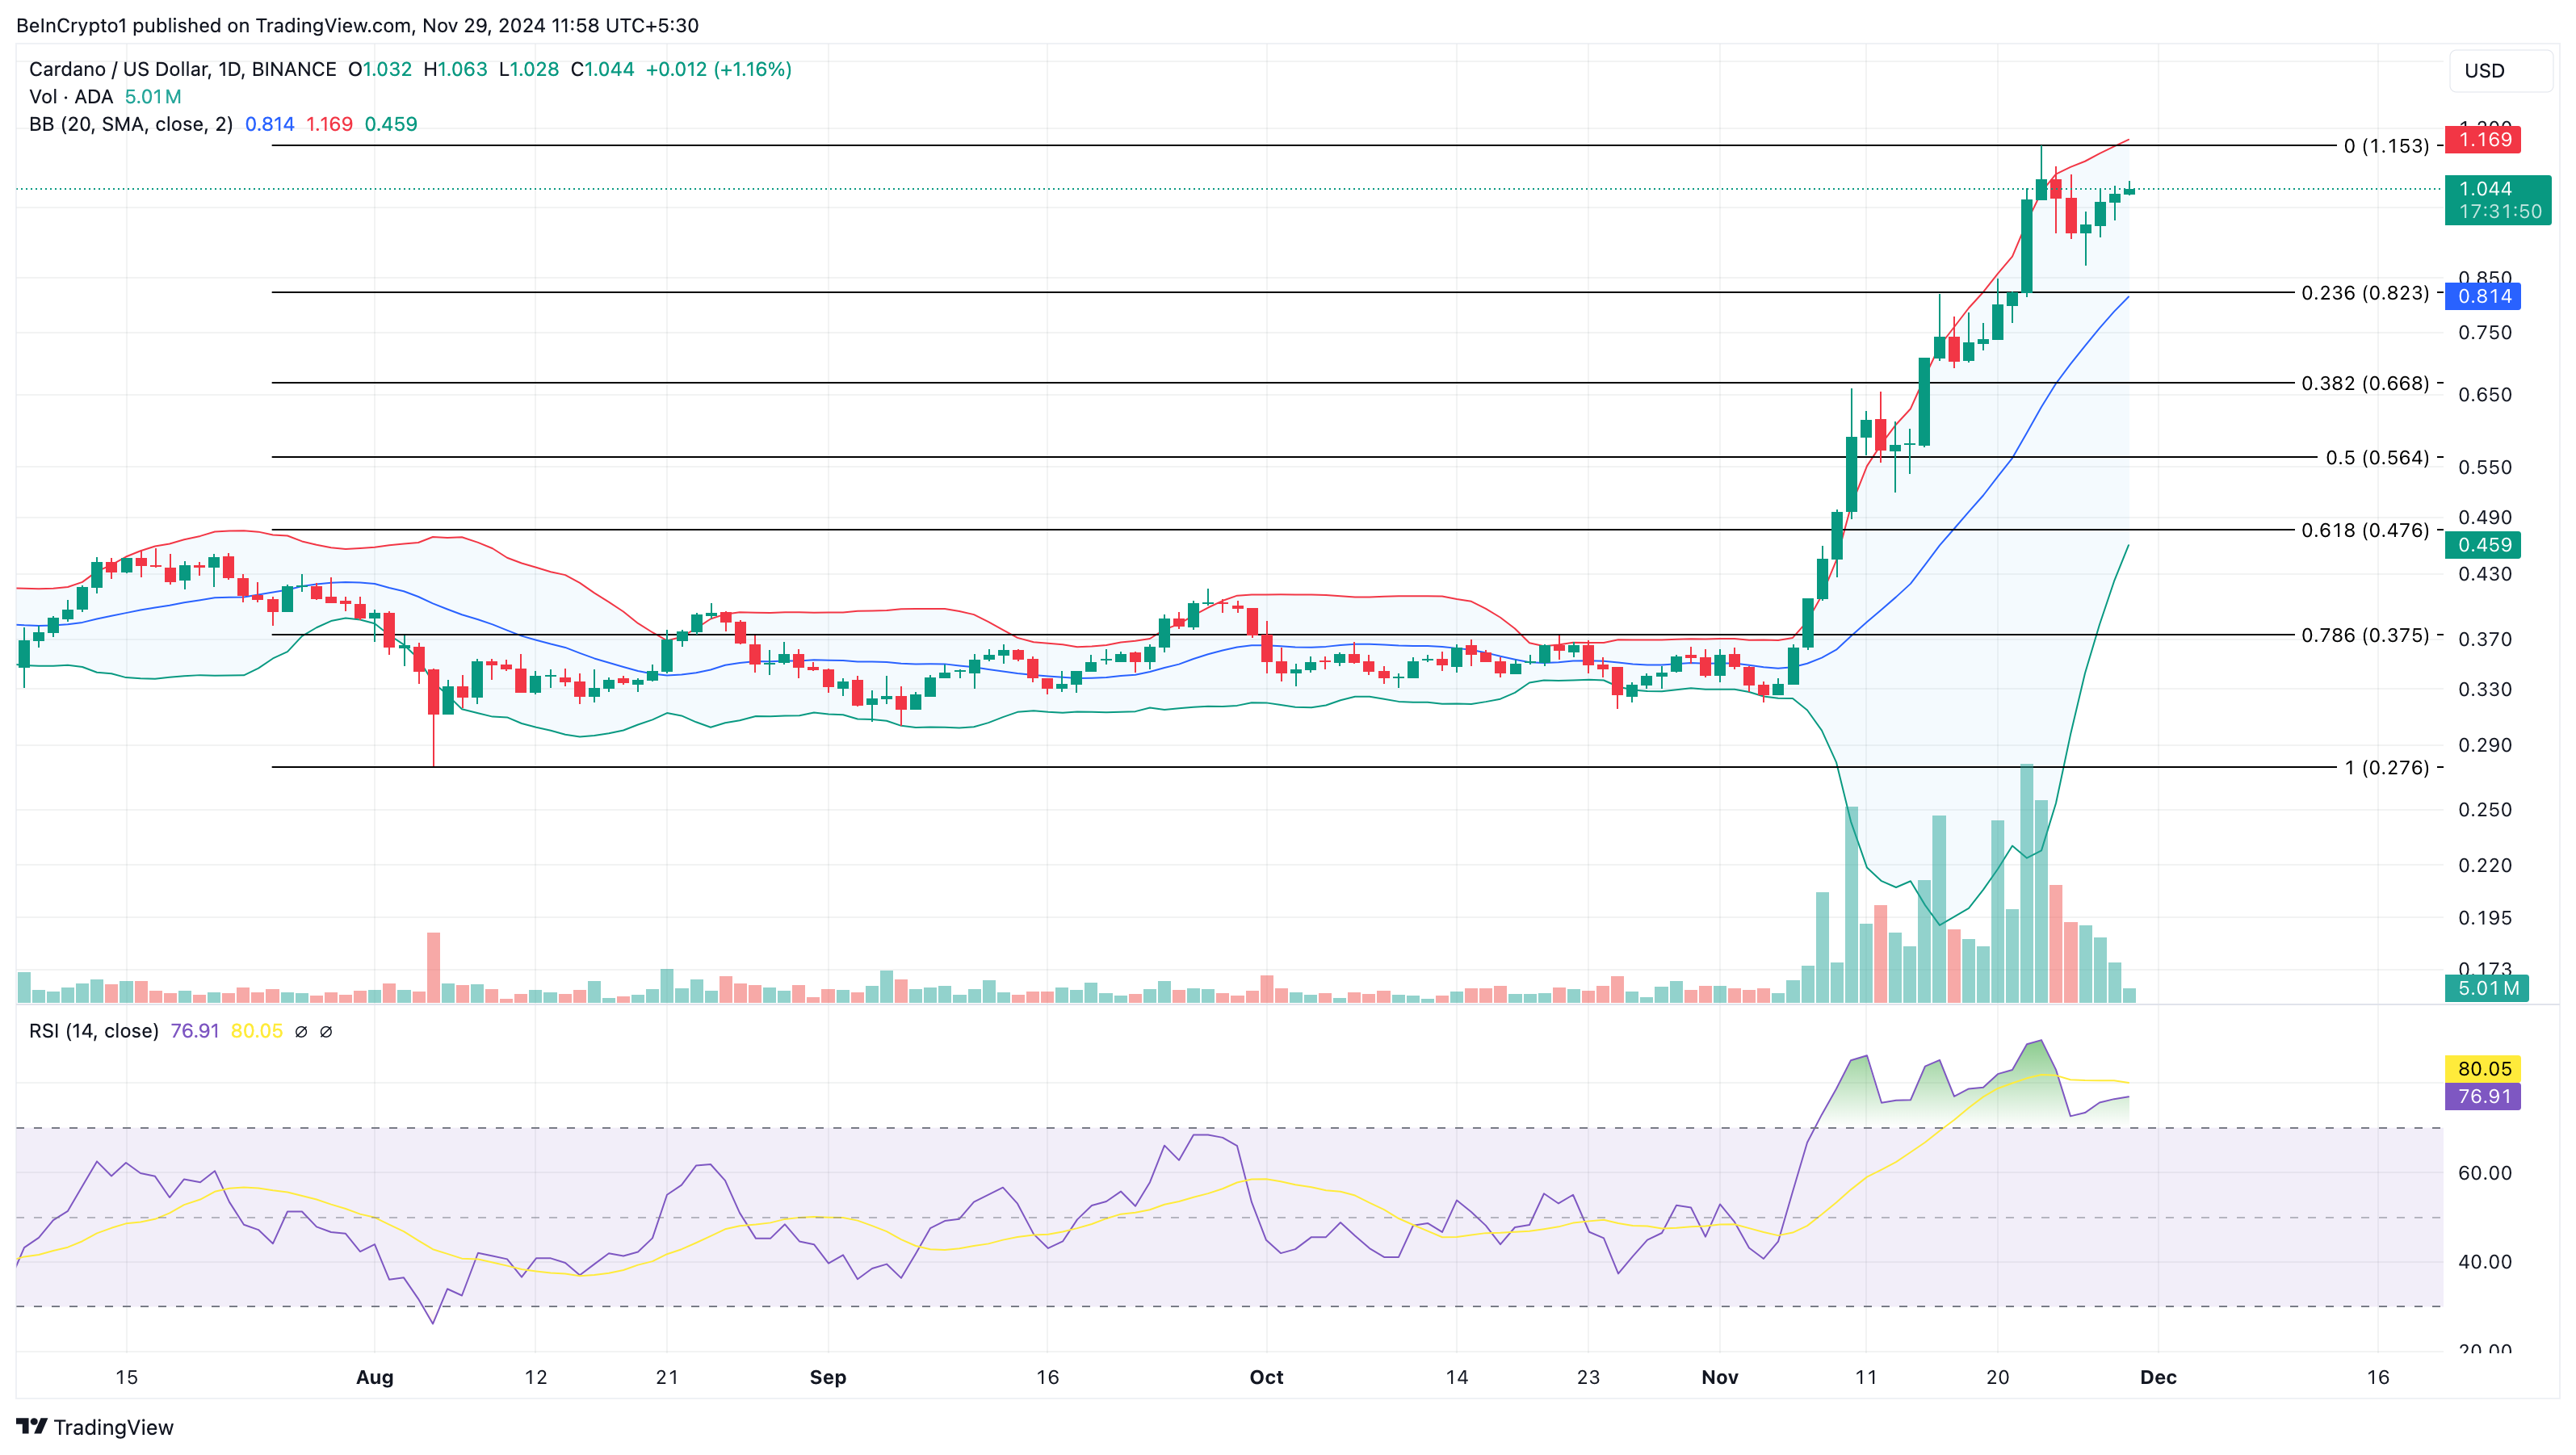 Cardano Daily Analysis. Source: TradingView
However, if the Cardano large transactions increase, this might not happen. Instead, the cryptocurrency’s value could climb above $1.15.
Recommended Articles


