54% of Solana (SOL) Traders Anticipate Recovery After Dip Below $260
On November 23, Solana’s (SOL) price hit a new all-time high, sparking speculation that the altcoin could rally as high as $300. While that did not happen, recent data shows that Solana traders are betting on a rebound.
Why are traders confident? This on-chain analysis explores whether these positions could deliver gains or if many are at risk of liquidation.
Solana Longs Keep Shorts Out of the Way
Data from Coinglass reveals that Solana’s Long/Short ratio on the 1-hour timeframe has climbed to 1.17. This ratio gauges market expectations, indicating whether most traders hold bearish or bullish positions.
When the ratio falls below 1, it indicates more shorts (sellers) than longs (buyers). Conversely, a ratio above 1 suggests a higher number of traders betting on a price increase compared to those anticipating a decline.
Currently, 54% of Solana traders hold long positions, while 46.17% expect a drop below $255. This indicates a bullish leaning among traders, with more optimism about the token’s price rising than falling.
 Solana Long/Short Ratio. Source: Coinglass
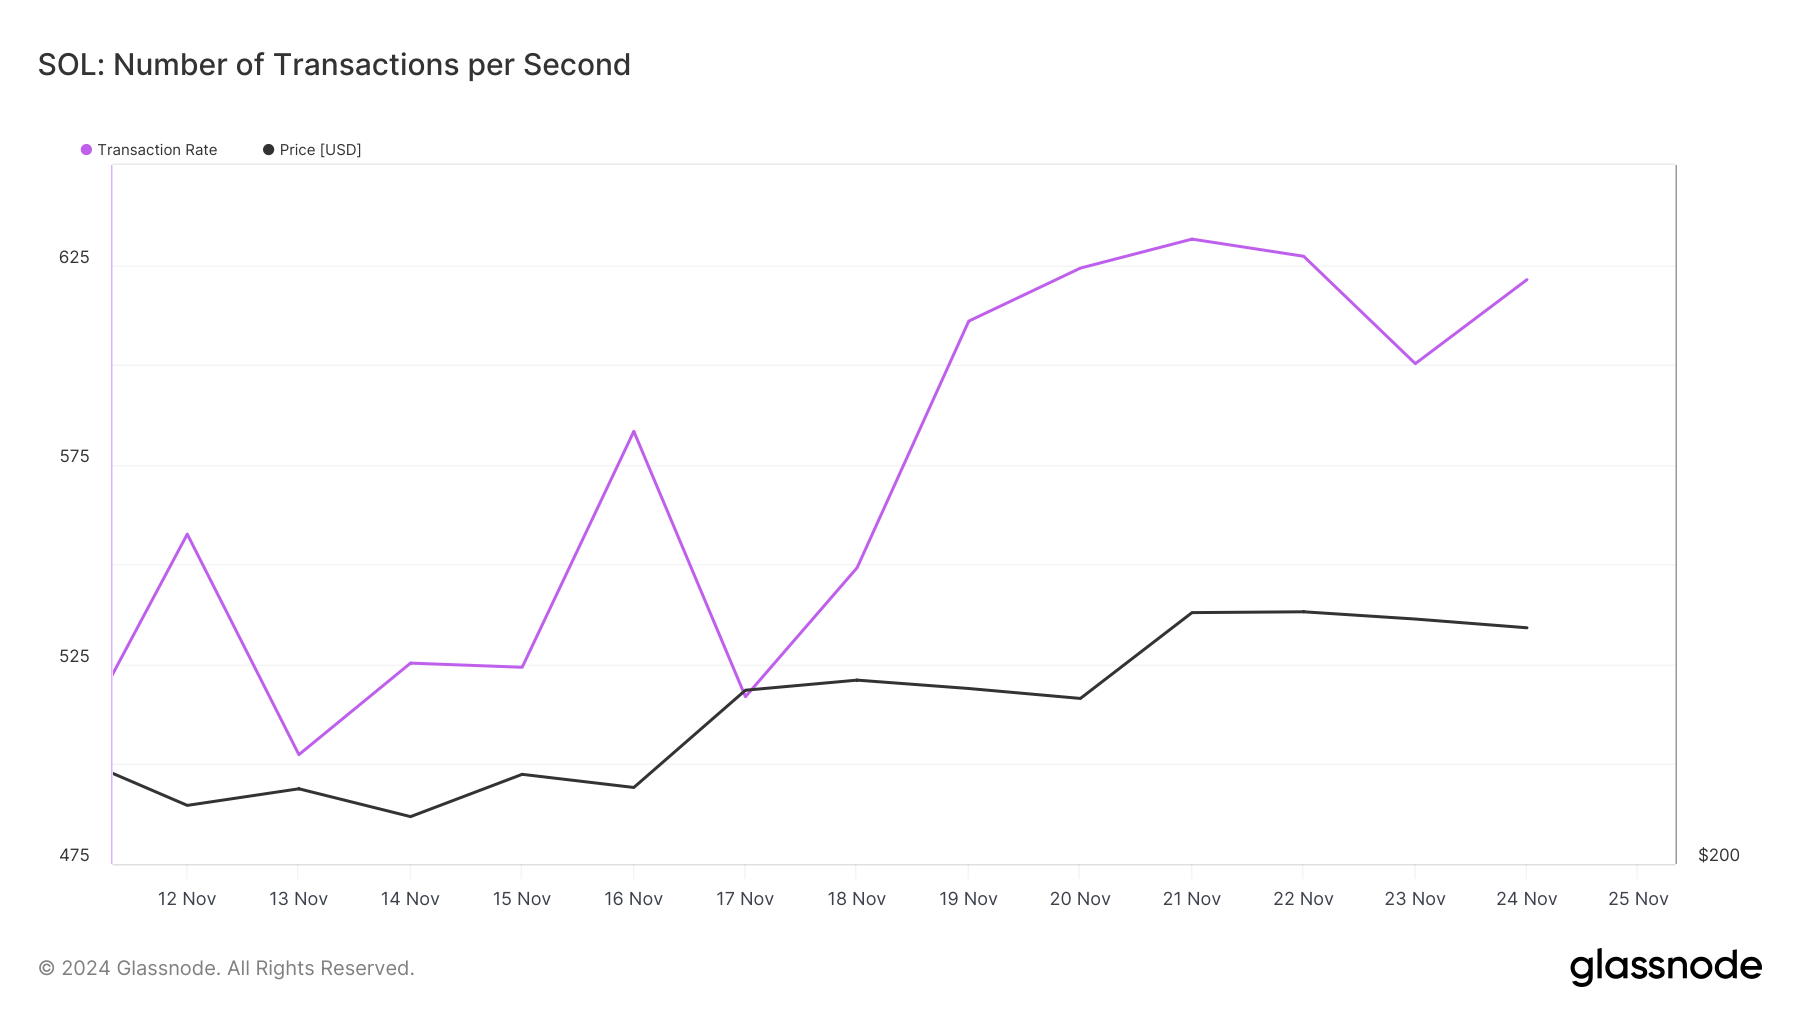
Additionally, it appears that these traders’ positions could prove profitable, thanks to an uptick in Solana’s Transaction Rate, which is the number of successful transactions processed per second on its blockchain.
An increasing Transaction Rate signals heightened user activity and engagement with the cryptocurrency, while a decline indicates reduced interest. According to Glassnode, Solana’s Transaction Rate has been climbing. If this trend continues, it could propel SOL’s price past its all-time high.
 Solana Transaction Rate. Source: Glassnode
SOL Price Prediction: Upside Potential Remains
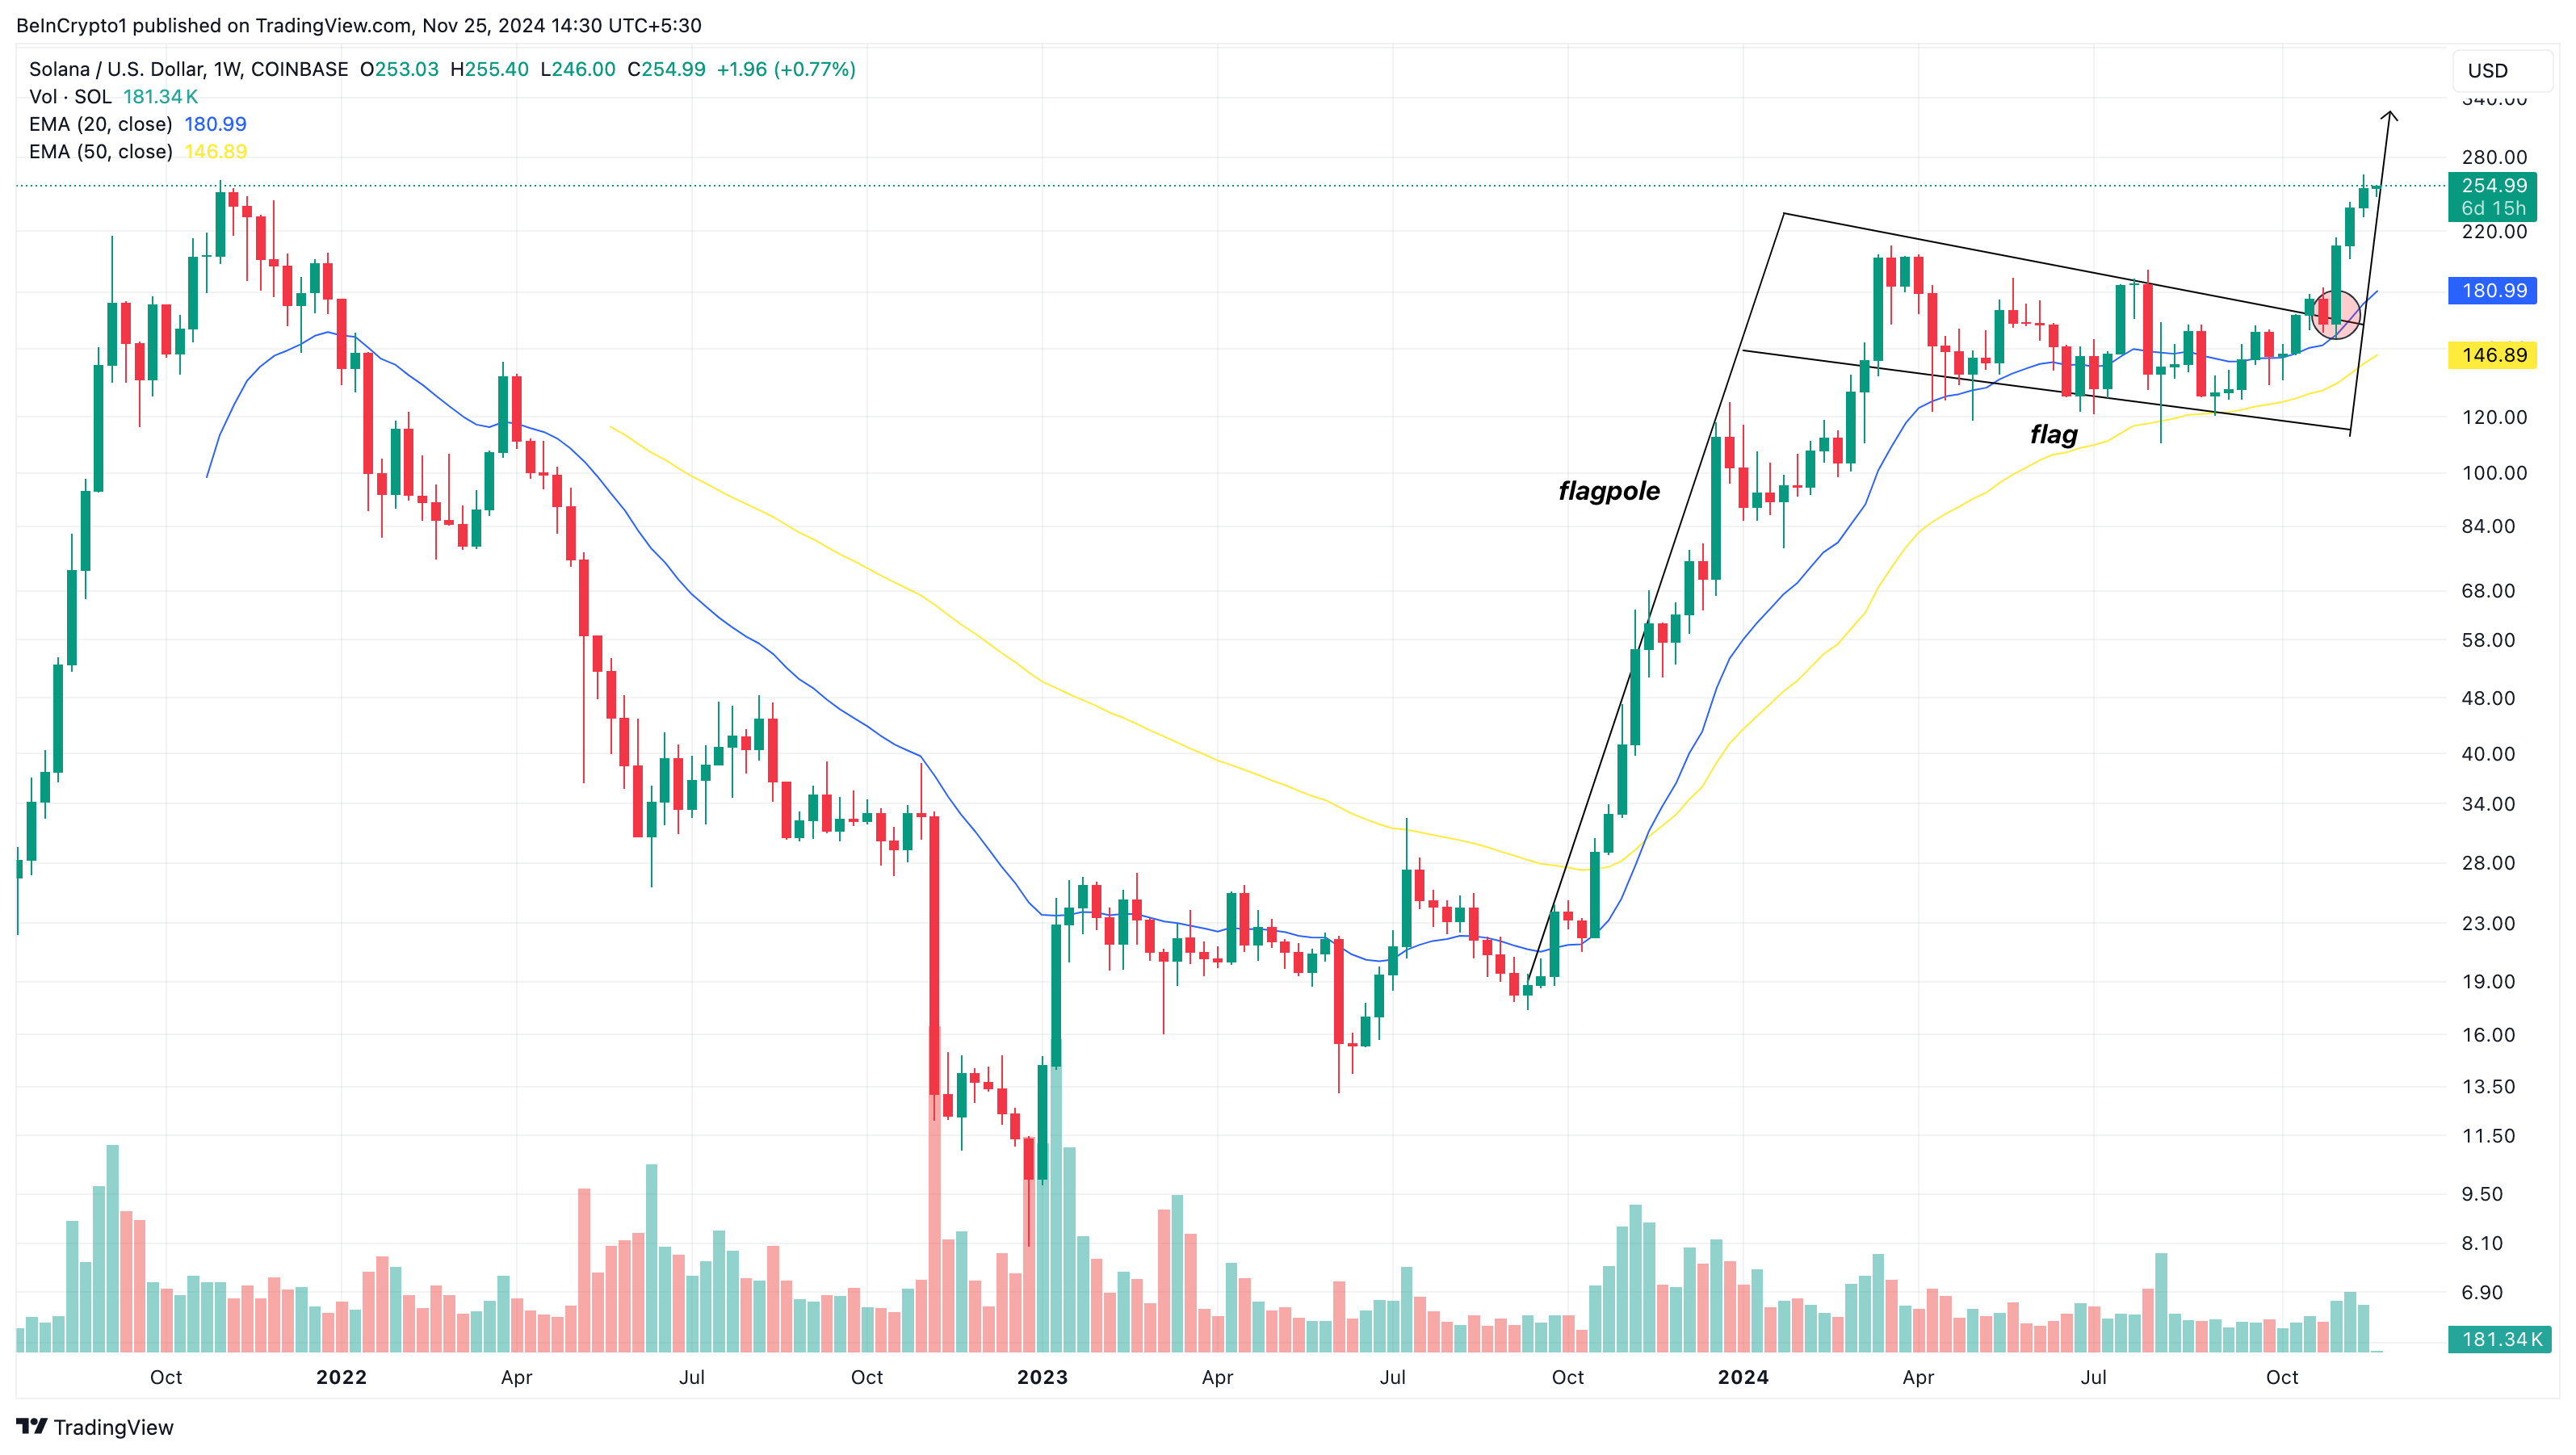
On the weekly chart, Solana’s price has surged above the 20 and 50 Exponential Moving Averages (EMAs), key indicators that measure trends. When the price sits above the EMAs, it signals a bullish trend, while a drop below them typically signals bearish momentum.
With SOL currently priced at $255, above both EMAs, the altcoin seems poised to continue its upward direction. The formation of a bull flag further supports this bullish outlook.
A bull flag is a continuation pattern, indicating that once the price breaks out, it’s likely to maintain the prior upward momentum. As seen below, SOL has already broken out of the consolidation pattern and is heading higher.
 Solana Weekly Analysis. Source: TradingView
As long as the price remains above the upper trendline of the consolidation phase, it could rise toward $325. However, if selling pressure takes hold, this bullish scenario could shift. In that case, SOL might fall below $200.


