Shiba Inu holders withdraw 1.67 trillion SHIB tokens from exchange

Source Fxstreet
  • Shiba Inu’s price retraces after testing its weekly resistance level.
  • On-chain data paints a bullish picture, as SHIB’s exchange outflow shows a spike, and dormant wallets are on the move.
  • A weekly candlestick close below $0.000019 would invalidate the bullish thesis.

Shiba Inu (SHIB) trades slightly higher, around $0.000024, on Thursday after declining more than 5% the previous week. SHIB’s on-chain metrics project a bullish outlook as holders accumulate recent dips, and dormant wallets are on the move, all pointing to a recovery in the cards.

Shiba Inu investors accumulate on the dips

Shiba Inu price faces a corrective pullback after surging more than 50% in early November. However, its on-chain metrics suggest a bullish outlook ahead. Santiment’s exchange outflow data shows a massive spike, indicating that 1.67 trillion SHIB worth nearly $41 million has been withdrawn from exchanges. Historically, when SHIB experienced a similar spike in exchange outflow, the meme coin rallied massively.

Shiba Inu Exchange outflow chart. Source: Santiment

Shiba Inu Exchange outflow chart. Source: Santiment

Santiment’s Age Consumed index also aligns with the bullish outlook. Spikes in this index suggest dormant tokens (tokens stored in wallets for a long time) are in motion and can be used to spot short-term local tops or bottoms.

For Shiba Inu, history shows that the spikes were followed by a rally in meme coin prices. The most recent uptick on November 14 also forecasted that SHIB was ready for an uptrend.

SHIB Age Consumed chart. Source: Santiment

SHIB Age Consumed chart. Source: Santiment

Shiba Inu Price Forecast: A recovery on the cards

Shiba Inu price declined more than 5% after facing resistance around its weekly level of $0.000028 in the second week of November. The weekly resistance at $0.000028 coincides with the 50% price retracement level ( drawn from a March high of $0.000045 to an August low of $0.000010) at $0.000028, making it a key resistance zone. As of this week, the pullback continues, trading at around $0.000023.

If Shiba Inu breaks and closes above $0.000028, it will rally to retest its end-March weekly high of $0.000032.

The Relative Strength Index (RSI) on the weekly chart reads 59, above its neutral level of 50, indicating the bullish momentum is gaining traction.
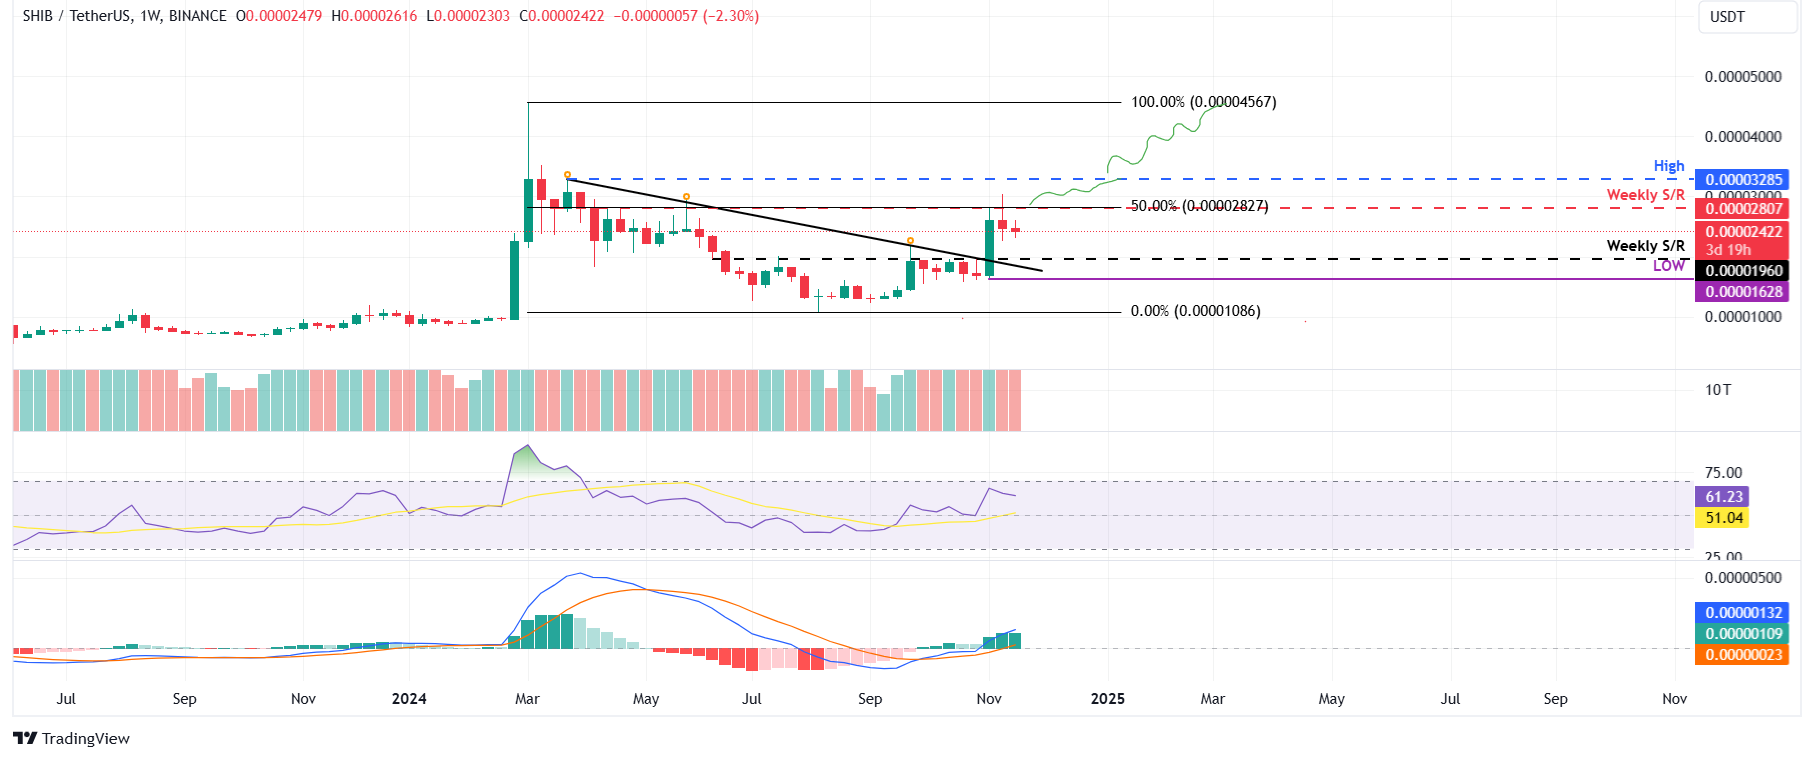
SHIB/USDT weekly chart

SHIB/USDT weekly chart

However, if SHIB continues the pullback and closes below $0.000019 weekly support, it will extend the decline to retest the weekly low of $0.000016.

Disclaimer: For information purposes only. Past performance is not indicative of future results.
placeholder
Understanding the first crypto market crash of 2024 and what to expect nextThe 365-day MVRV ratio suggests that this crash may be just the beginning. If the ETF is rejected before the second quarter of 2024, it could trigger a sharp correction.
Author  FXStreet
Jan 04, Thu
The 365-day MVRV ratio suggests that this crash may be just the beginning. If the ETF is rejected before the second quarter of 2024, it could trigger a sharp correction.
placeholder
Japanese Yen stands tall near one-month top against USD on hawkish BoJ talksThe Japanese Yen (JPY) rallied to the highest level since early February against its American counterpart on Friday amid bets for an imminent shift in the Bank of Japan's (BoJ) policy stance.
Author  FXStreet
Mar 11, Mon
The Japanese Yen (JPY) rallied to the highest level since early February against its American counterpart on Friday amid bets for an imminent shift in the Bank of Japan's (BoJ) policy stance.
placeholder
Natural Gas sinks to pivotal level as China’s demand slumpsNatural Gas price (XNG/USD) edges lower and sinks to $2.56 on Monday, extending its losing streak for the fifth day in a row. The move comes on the back of China cutting its Liquified Natural Gas (LNG) imports after prices rose above $3.0 in June. It
Author  FXStreet
Jul 01, Mon
Natural Gas price (XNG/USD) edges lower and sinks to $2.56 on Monday, extending its losing streak for the fifth day in a row. The move comes on the back of China cutting its Liquified Natural Gas (LNG) imports after prices rose above $3.0 in June. It
placeholder
Is It Too Late to Buy MicroStrategy Stock?Bitcoin is soaring again. The cryptocurrency's price recently passed $90,000 to a new all-time high. It's up by close to 1,000% in the last five years. That has to make MicroStrategy (NASDAQ: MSTR) and its ex-CEO, Michael Saylor, happy.
Author  The Motley Fool
Nov 18, Mon
Bitcoin is soaring again. The cryptocurrency's price recently passed $90,000 to a new all-time high. It's up by close to 1,000% in the last five years. That has to make MicroStrategy (NASDAQ: MSTR) and its ex-CEO, Michael Saylor, happy.
placeholder
Pinduoduo Earnings Incoming: Morgan Stanley Sees Long-Term Profit Potential​Insights – On November 21, Chinese e-commerce giant Pinduoduo (PDD) will release its Q3 2024 earnings.
Author  Mitrade
Yesterday 08: 44
​Insights – On November 21, Chinese e-commerce giant Pinduoduo (PDD) will release its Q3 2024 earnings.
goTop
quote