
This Is Why Hedera (HBAR) May Have Hit Overextended Territory After 180% Surge
HBAR, the native cryptocurrency of the Hedera Hashgraph network, has seen a meteoric rise of over 180% in the past week. It currently trades at $0.13, a price high last observed in April 2024.
However, this rapid ascent has pushed the token’s price into overbought territory. This overextension suggests that a price correction may be imminent for the HBAR token.
Hedera Traders Overextends Its Price
Readings from HBAR’s Relative Strength Index (RSI) confirm that its market is overheated. As of this writing, the indicator stands at 92.35, its all-time high.
The RSI measures an asset’s overbought and oversold market conditions. It ranges between 0 and 100, with values above 70 suggesting that the asset is overbought and due for a decline. In contrast, values under 30 indicate that the asset is oversold and may experience a rebound.
HBAR’s RSI reading of 92.35 indicates that it is in extremely overbought territory. It suggests that HBAR buyers have significantly outpaced sellers, driving the price to an unsustainable level. While the asset’s price can continue rising in the short term, such a high RSI often precedes a correction or pullback.
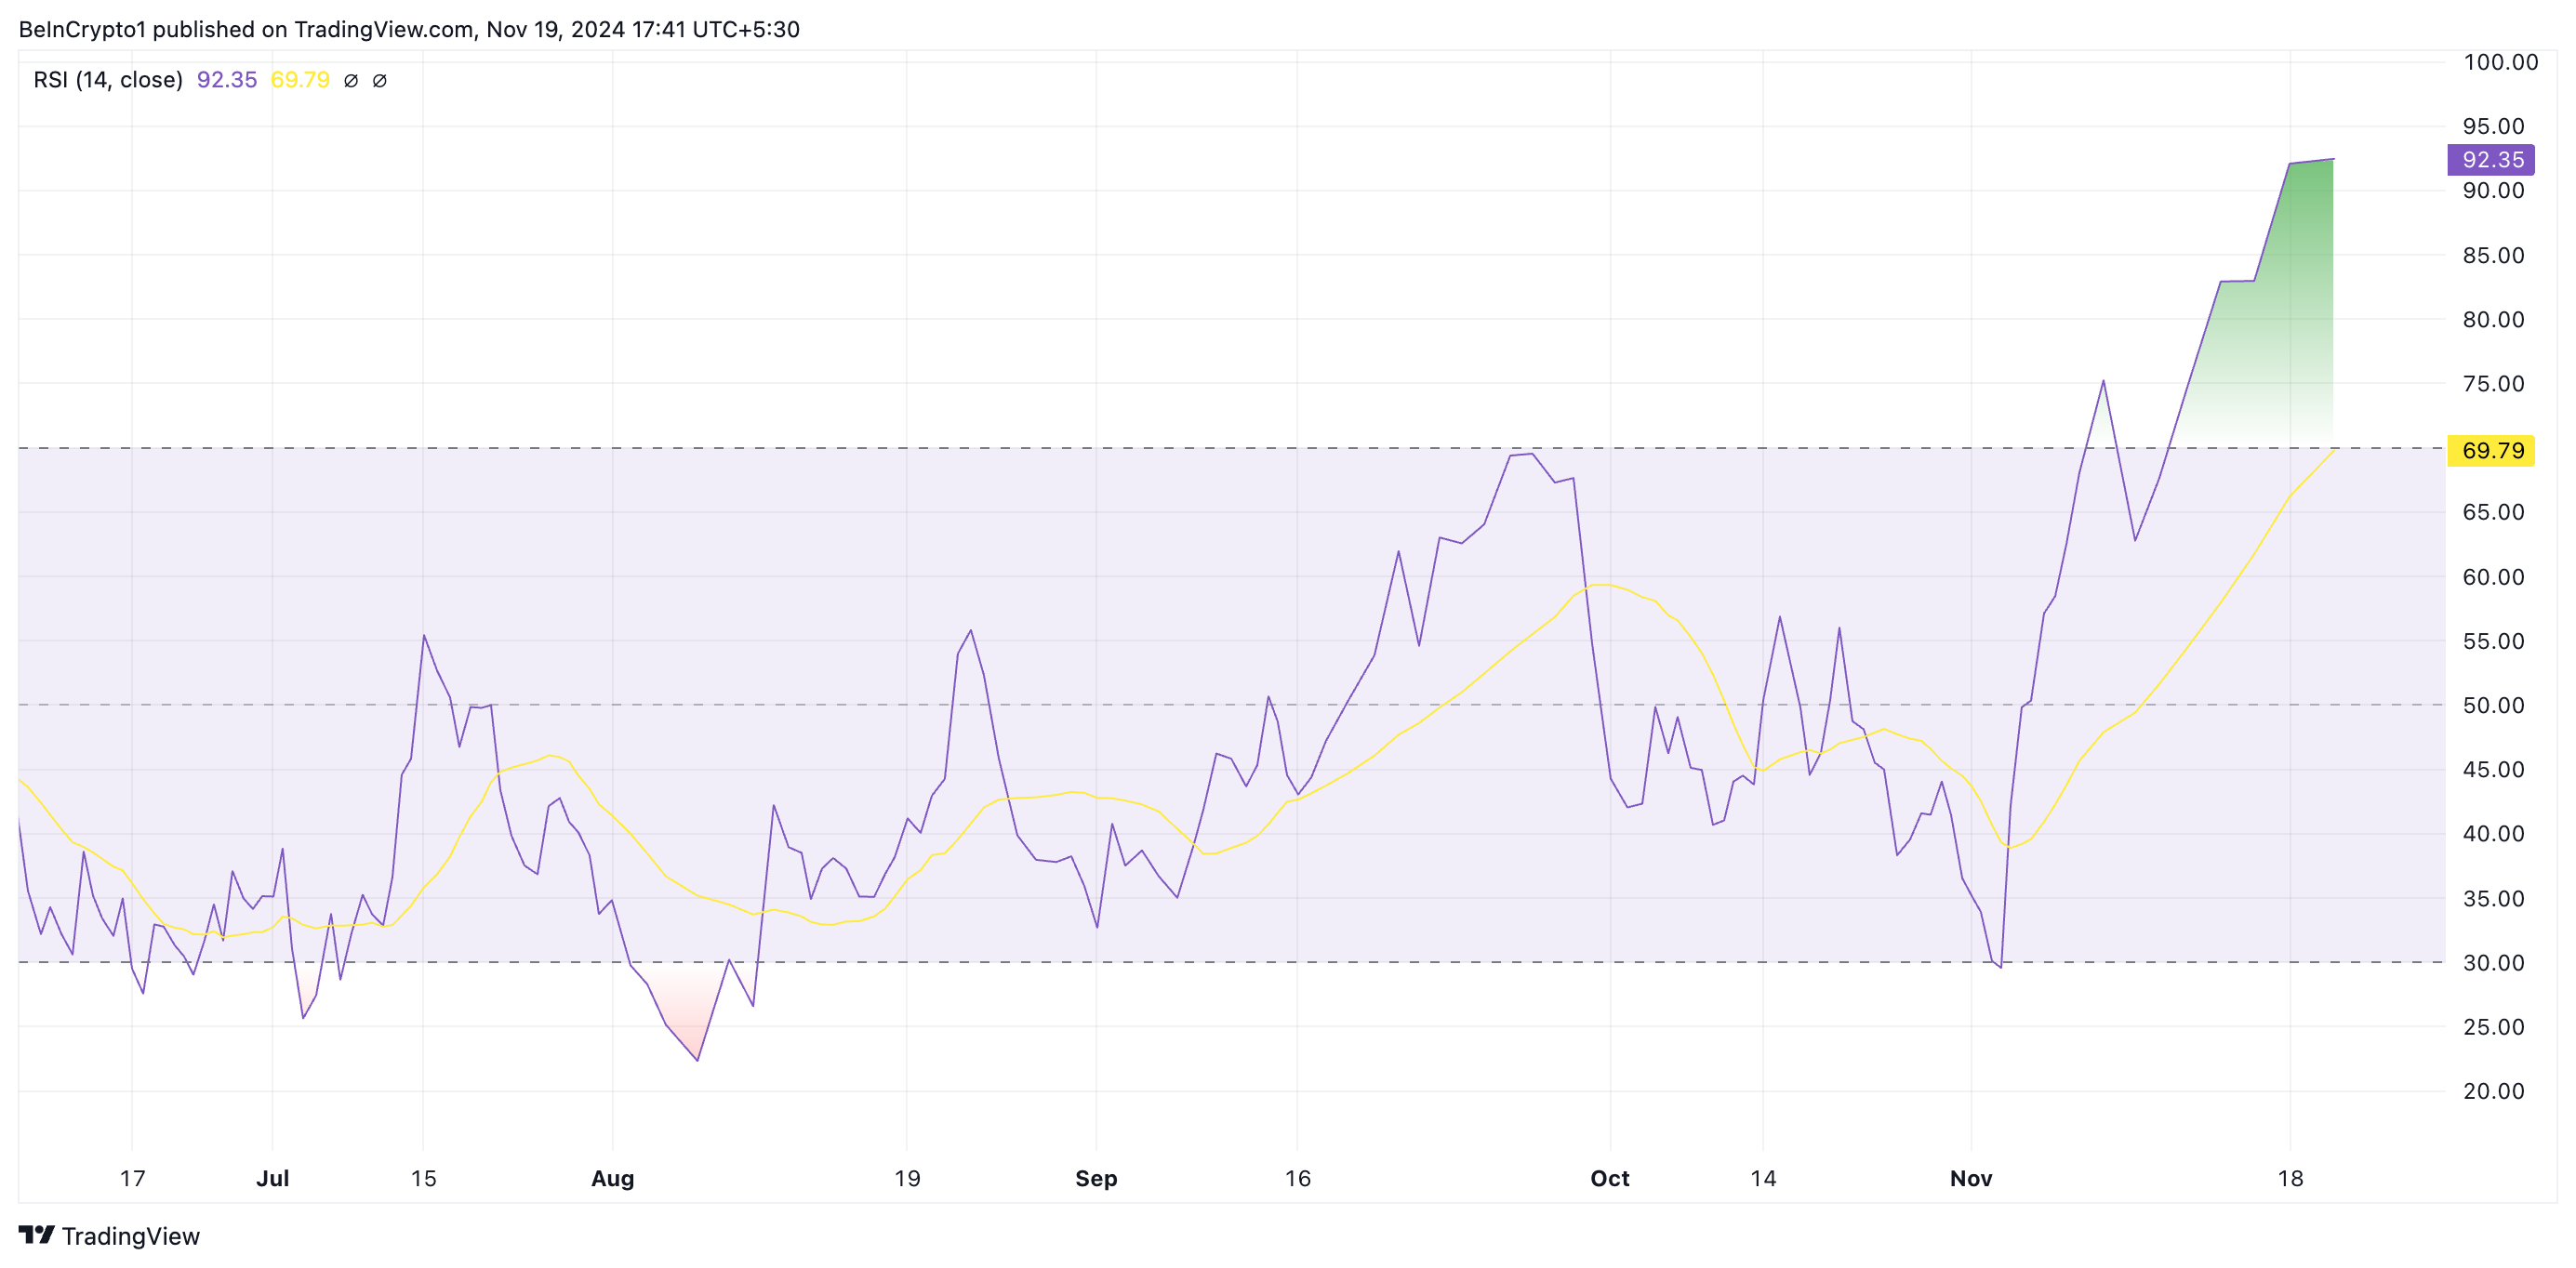 HBAR RSI. Source: TradingView
Further, HBAR’s price has breached the upper band of its Bollinger Bands indicator, also confirming that it is overbought among market participants.
The Bollinger Bands indicator measures market volatility and identifies potential buy and sell signals. It consists of three main components: the middle band, the upper band, and the lower band.
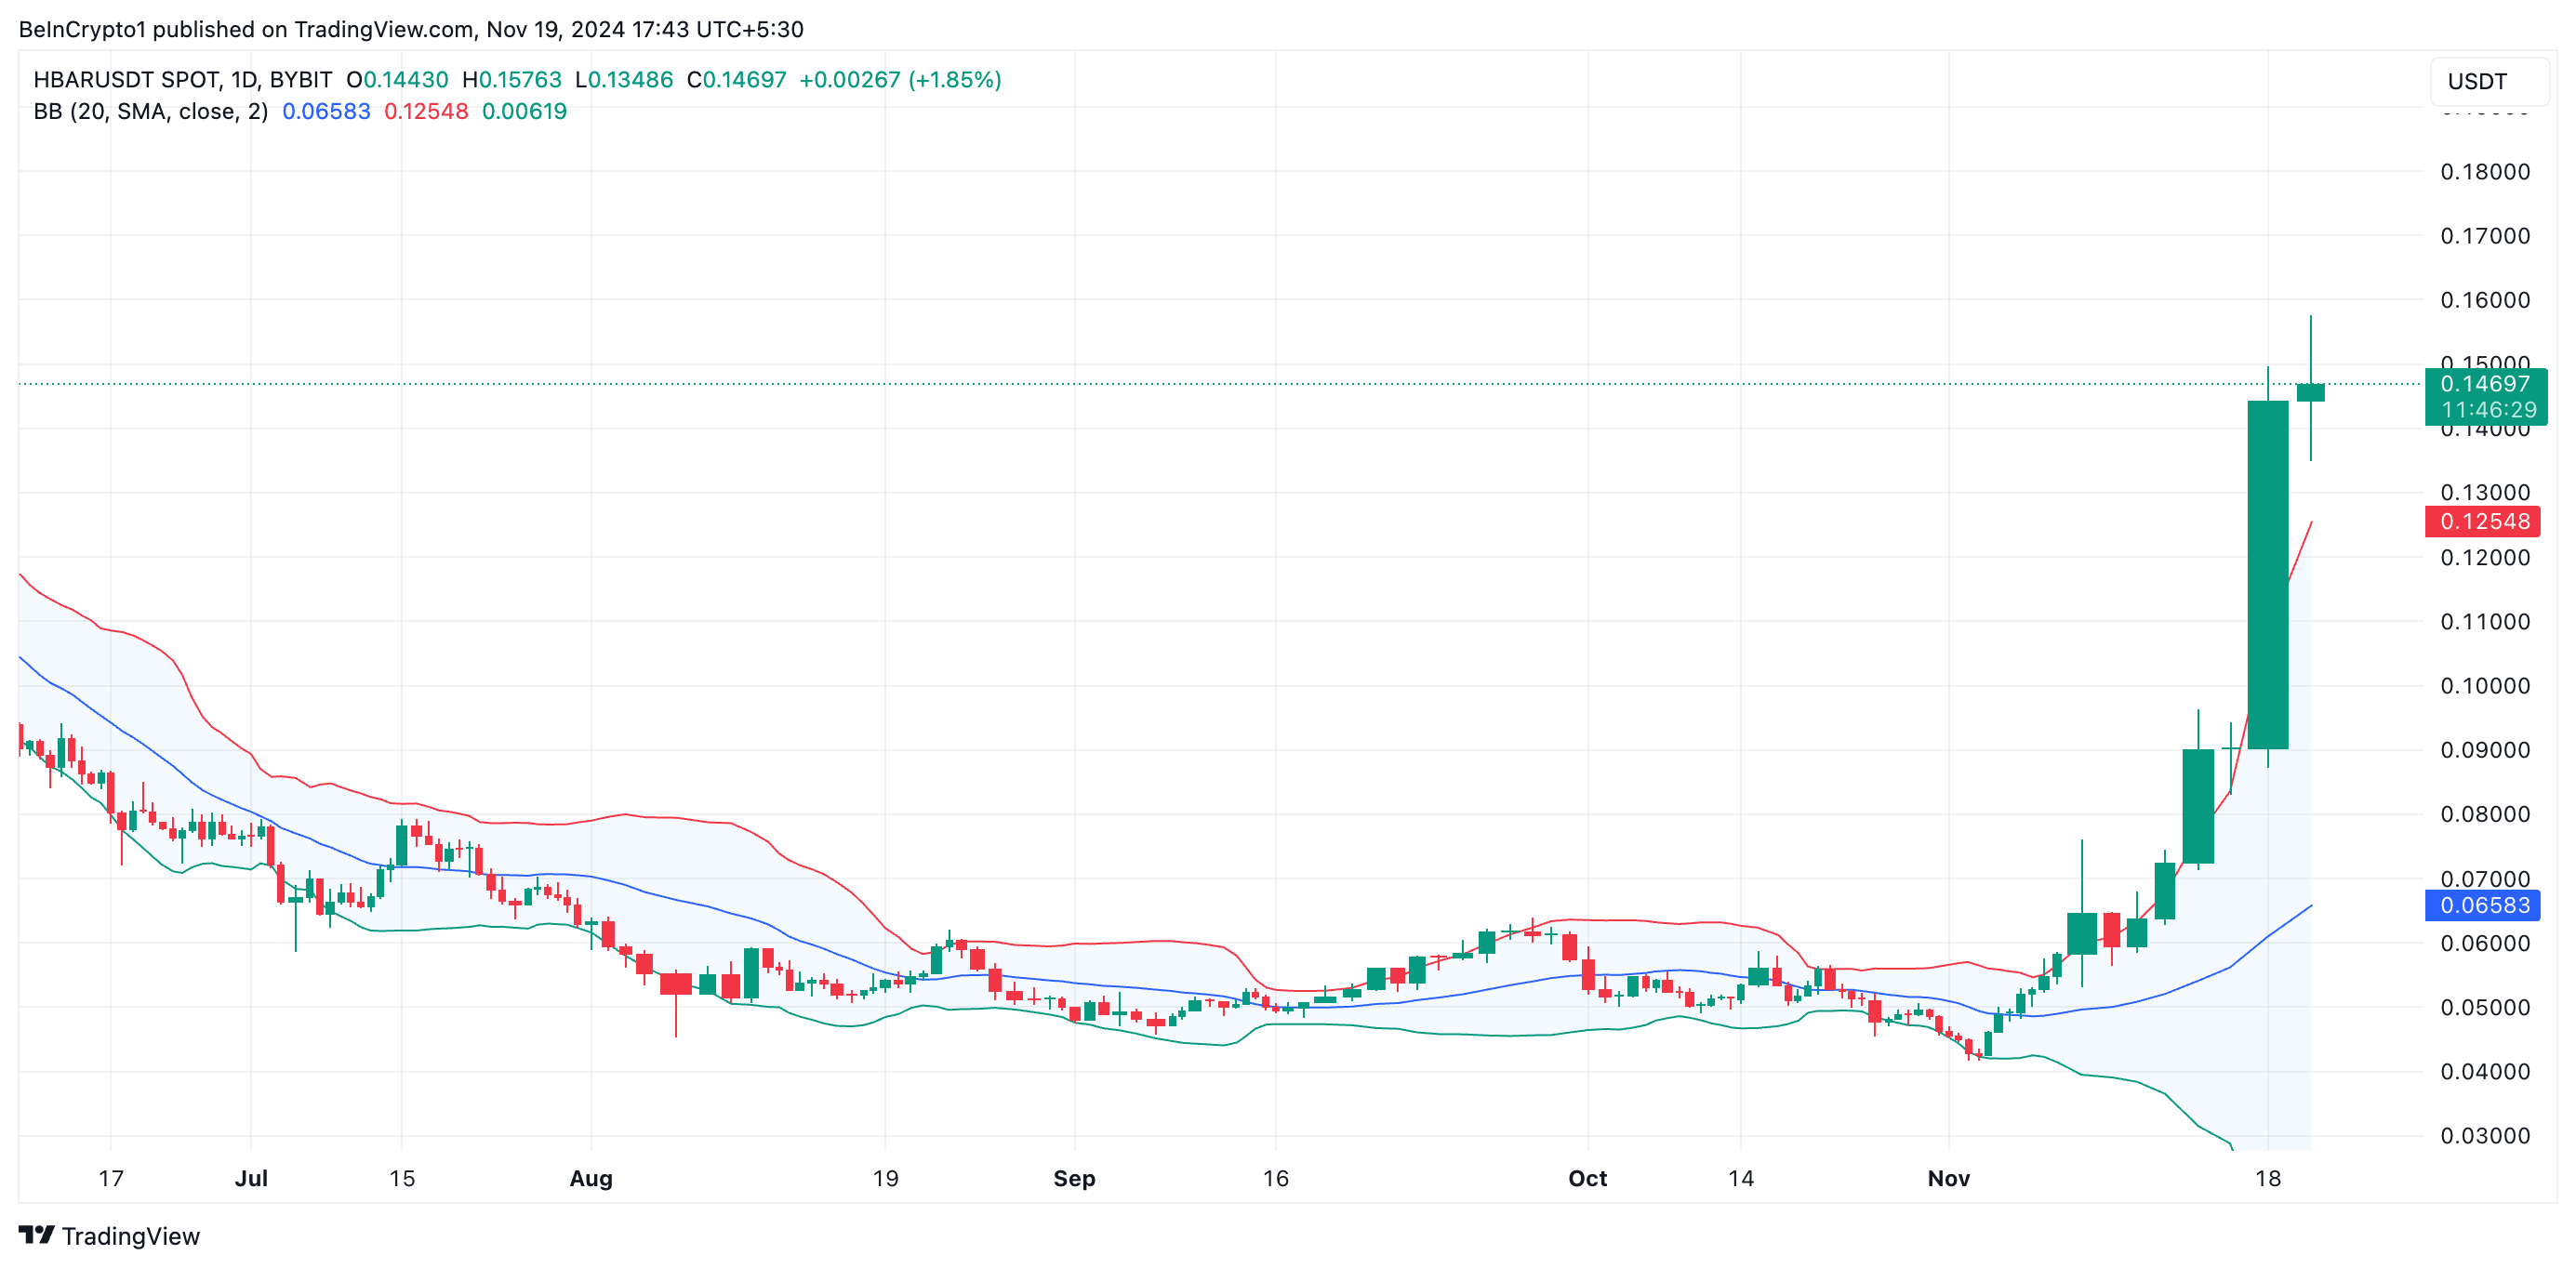 HBAR Bollinger Bands. Source: TradingView
The middle band is a 20-period moving average that serves as a baseline for the price trend. The upper band is calculated as the middle band plus two standard deviations of the price, accounting for price volatility above the moving average. The lower band is the middle band minus two standard deviations of the price, representing volatility below the moving average.
When the price trades above the upper band, it often suggests that the asset is overbought, as it has moved significantly higher than its average price. This could indicate the possibility of a price pullback.
HBAR Price Prediction: A Pullback Is Imminent
Once buyers’ exhaustion sets in, HBAR’s price will experience a pullback. At its current value, it trades above support formed at $0.12. When buying pressure starts to fade, it will test this price level. Should it fail to hold, the token’s price may plummet toward $0.11.
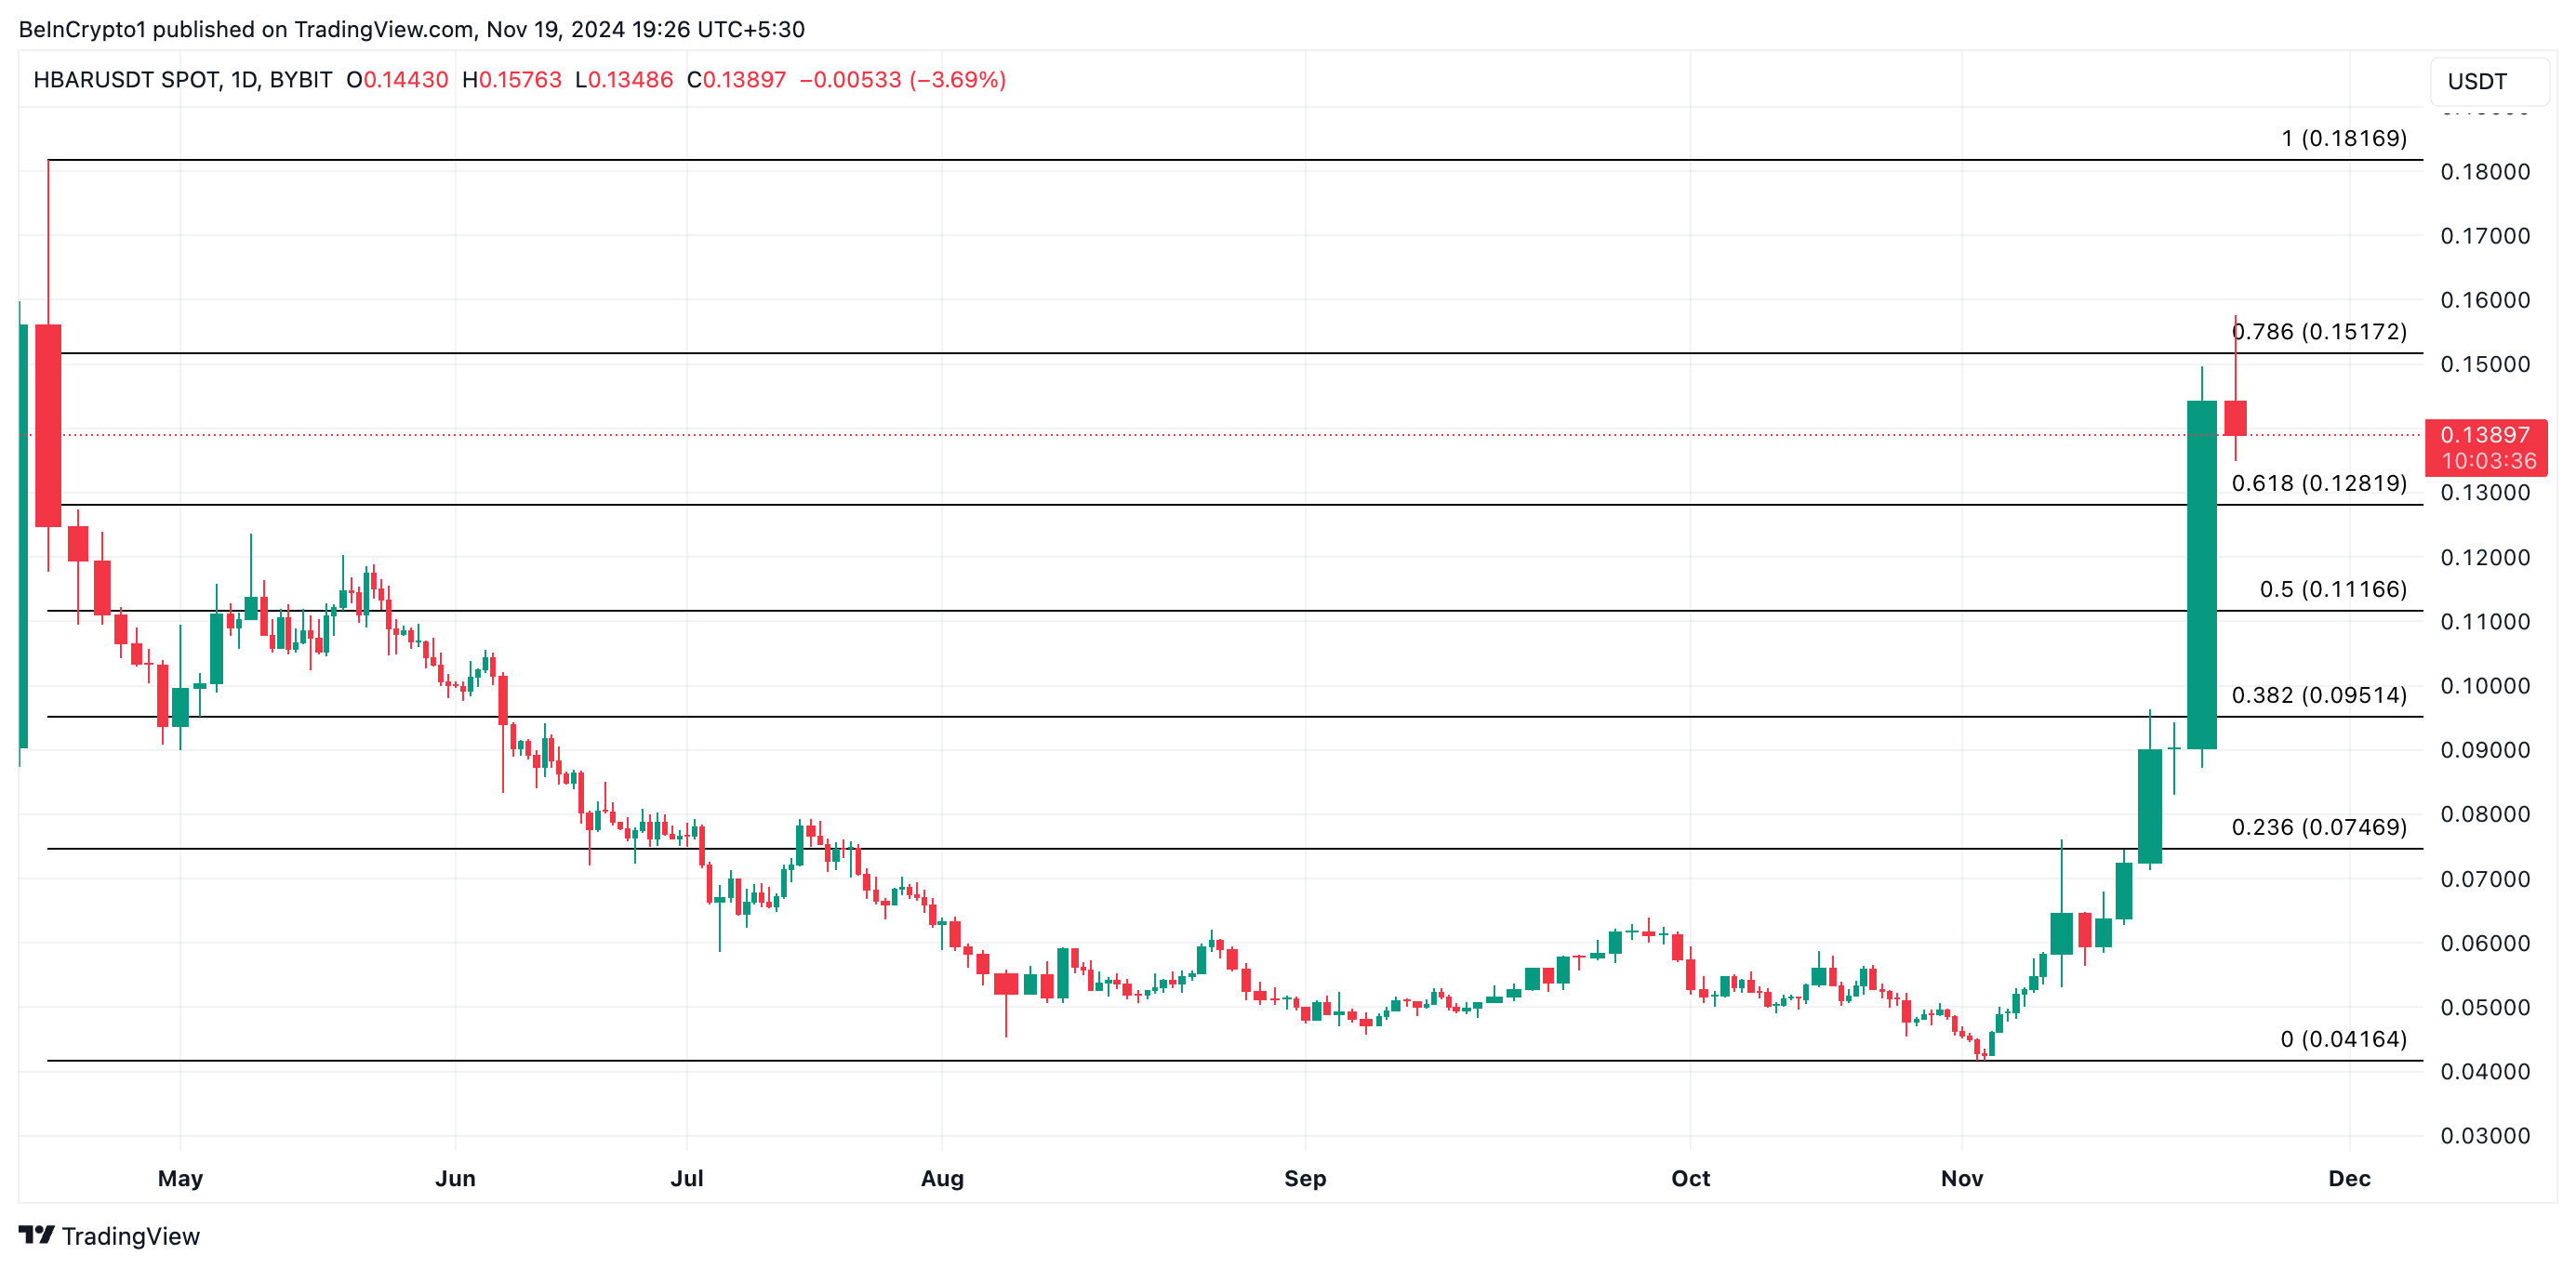 HBAR Price Analysis. Source: TradingView
However, if the uptrend continues, the HBAR token will reclaim its cycle peak of $0.15 and attempt to rally past it, invalidating the bearish projection above. A successful break above this level will set HBAR on the path to trading at its year-to-date high of $0.18.
Recommended Articles


