Solana bulls target new all-time highs

Source Fxstreet
  • Solana’s price extends its gains on Tuesday after rallying more than 45% in the last two weeks.
  • On-chain data paints a bullish picture as SOL’s Open Interest, trading volume and fees reach new record highs.
  • The weekly chart shows the breakout of a bullish pattern, with the technical target at a new all-time high of $276.

Solana (SOL) extends its bullish momentum and trades in green at around $242.80 at the time of writing on Tuesday after rallying more than 45% in the last two weeks. On-chain data hints at further gains as SOL’s Open Interest, trading volume, and fees reach new record highs.

The technical charts show a bullish breakout pattern and suggest a continuation of the rally, with a target set for a new all-time high (ATH) of $276. 

Reasons for Solana pointing to a fresh all-time high

Solana price has rallied more than 45% since early November as US President-elected Donald Trump’s pro-crypto stance fueled the ongoing rally in cryptocurrencies.

Diving deep into SOL’s on-chain metrics provides a clear picture of a bullish outlook. According to Coinglass data, Solana’s Open Interest (OI) has risen steadily since mid-October and reached its highest level of $5.64 billion on Monday. An increasing OI represents new or additional money entering the market and new buying, which suggests a bullish trend. 

SOL Open Interest chart. Source: Coinglass

SOL Open Interest chart. Source: Coinglass

Another aspect bolstering the platform’s bullish outlook is a recent surge in traders’ interest and liquidity in the SOL chain. DefiLlama data shows that SOL Chain’s weekly trading volume rose from $18.14 billion in the second week of November to $41.60 billion the next week, the highest since its launch in 2020. 
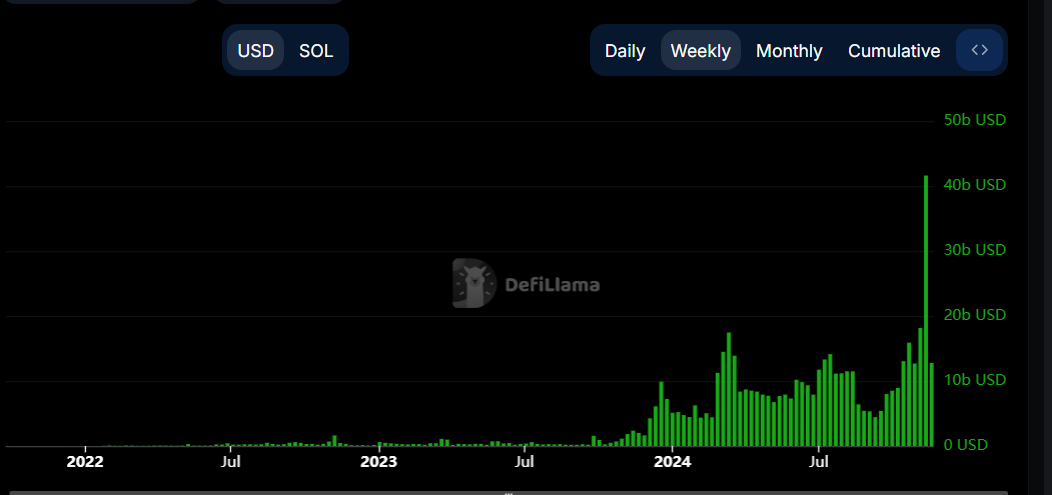
Solana weekly trading volume chart. Source: DefiLlama

Solana weekly trading volume chart. Source: DefiLlama

DefiLlama data also shows that Solana generated $49.64 million in fees last week, a new all-time high weekly fee, further bolstering the bullish outlook.
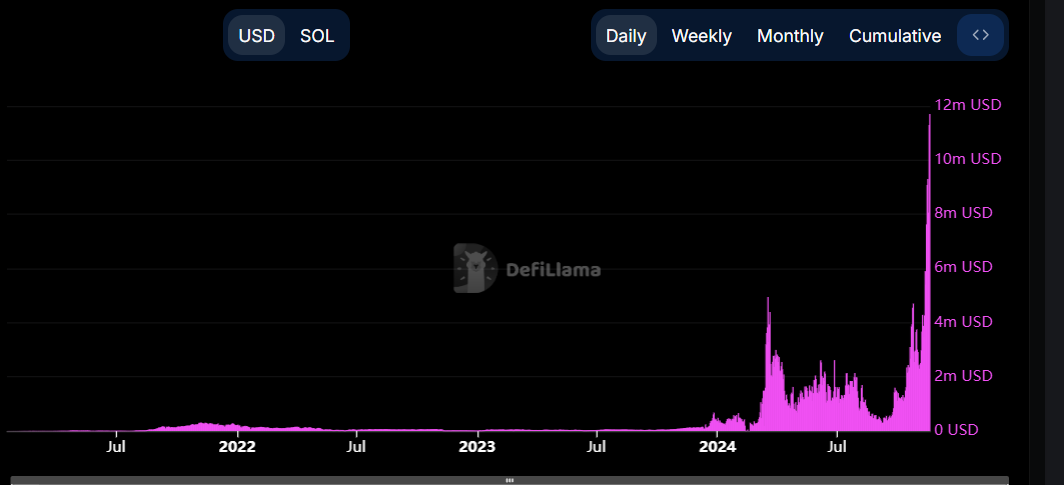
Solana weekly fee chart. Source: DefiLlama

Solana weekly fee chart. Source: DefiLlama

Solana Price Forecast: Projects a new all-time high of $276

Solana’s weekly chart shows that SOL has broken above a downward-sloping parallel channel pattern at around $210.18 and rallied over 45% in two weeks, closing above the yearly high of $210.18 reached on March 18. This pattern is formed by connecting multiple weekly highs and lows from early March to October. A breakout of this pattern, confirmed by a weekly close above the breakout level, favors the bulls. As of this week, SOL’s price extends its gains and trades around $242.80, nearing its all-time high of $259.90.

If Solana continues its upward momentum, the pattern’s technical target (obtained by measuring the distance between the two trendlines and extrapolating it higher) projects a target of a new ATH of $276.55.

The Relative Strength Index (RSI) momentum indicator on the weekly chart reads 69, indicating that bullish momentum is gaining traction while still below overbought conditions.
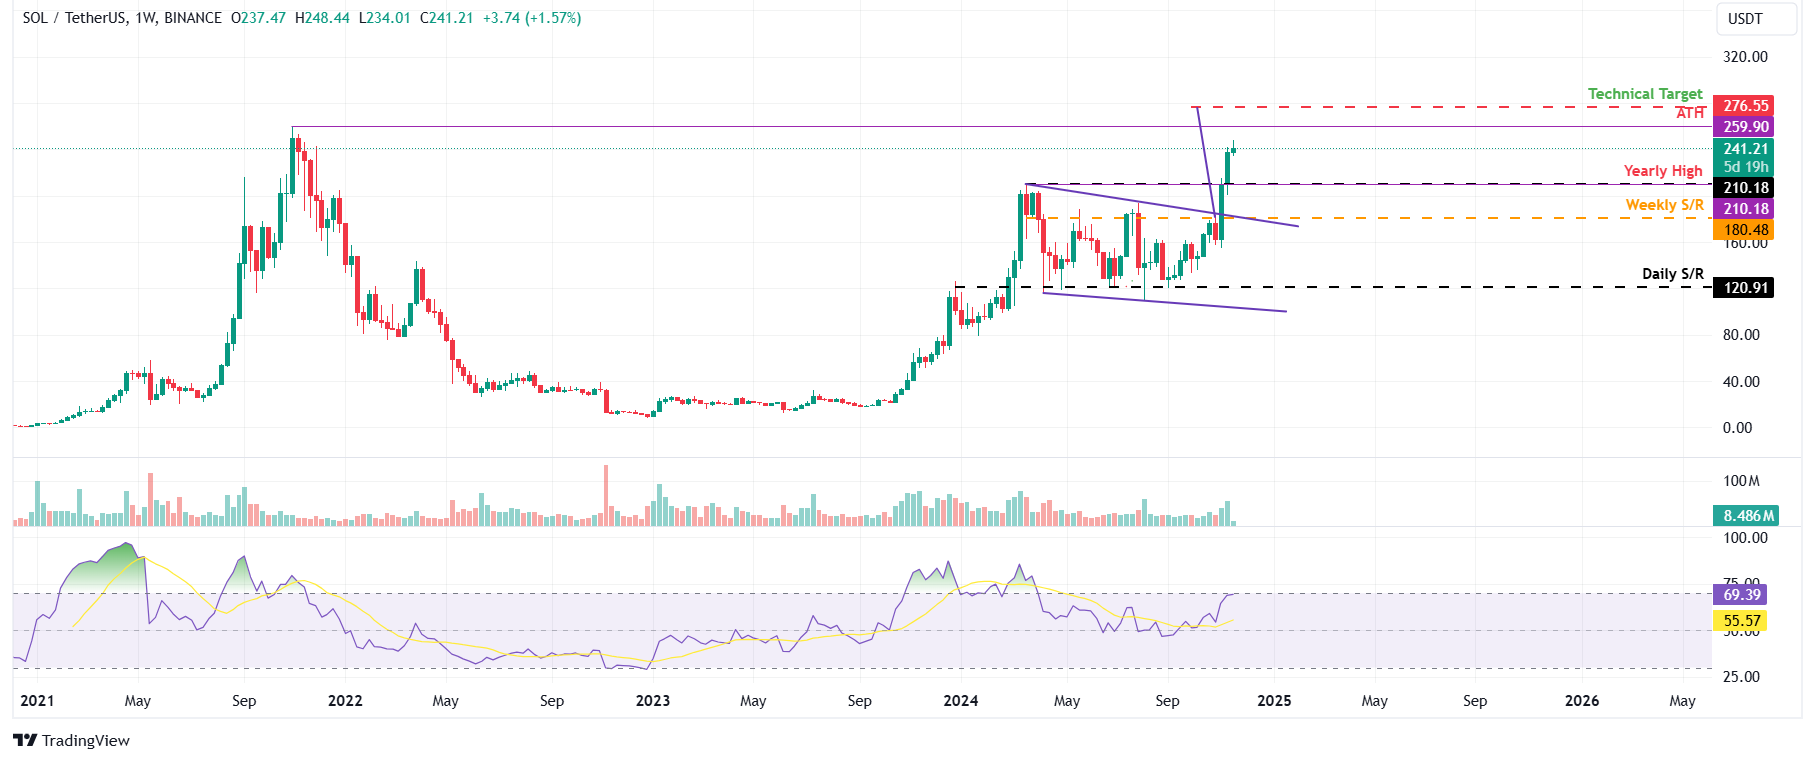
SOL/USDT weekly chart

SOL/USDT weekly chart

Disclaimer: For information purposes only. Past performance is not indicative of future results.
placeholder
Natural Gas sinks to pivotal level as China’s demand slumpsNatural Gas price (XNG/USD) edges lower and sinks to $2.56 on Monday, extending its losing streak for the fifth day in a row. The move comes on the back of China cutting its Liquified Natural Gas (LNG) imports after prices rose above $3.0 in June. It
Author  FXStreet
Jul 01, Mon
Natural Gas price (XNG/USD) edges lower and sinks to $2.56 on Monday, extending its losing streak for the fifth day in a row. The move comes on the back of China cutting its Liquified Natural Gas (LNG) imports after prices rose above $3.0 in June. It
placeholder
Rivian stock rises despite revenue miss in Q3Electric vehicle maker Rivian Automotive (NASDAQ:RIVN) saw its stock rise 3% despite reporting third quarter revenue that fell short of analyst expectations.
Author  Investing.com
Nov 08, Fri
Electric vehicle maker Rivian Automotive (NASDAQ:RIVN) saw its stock rise 3% despite reporting third quarter revenue that fell short of analyst expectations.
placeholder
Is It Too Late to Buy MicroStrategy Stock?Bitcoin is soaring again. The cryptocurrency's price recently passed $90,000 to a new all-time high. It's up by close to 1,000% in the last five years. That has to make MicroStrategy (NASDAQ: MSTR) and its ex-CEO, Michael Saylor, happy.
Author  The Motley Fool
Yesterday 06: 57
Bitcoin is soaring again. The cryptocurrency's price recently passed $90,000 to a new all-time high. It's up by close to 1,000% in the last five years. That has to make MicroStrategy (NASDAQ: MSTR) and its ex-CEO, Michael Saylor, happy.
placeholder
Microstrategy outperforms Warren Buffet’s Berkshire Hathaway by the largest margin since the dot-com bubbleMichael Saylor’s Microstrategy is outperforming Warren Buffet’s Berkshire Hathaway by the largest margin. The software company has surged by 2,295.74% since August, when it first bought its Bitcoin holdings, while Berkshire Hathaway has surged by 36.02% in the same duration.
Author  Cryptopolitan
Yesterday 07: 03
Michael Saylor’s Microstrategy is outperforming Warren Buffet’s Berkshire Hathaway by the largest margin. The software company has surged by 2,295.74% since August, when it first bought its Bitcoin holdings, while Berkshire Hathaway has surged by 36.02% in the same duration.
placeholder
Weekly Market Outlook: NVIDIA, Walmart Earnings; Key Signals from ECB’s LagardeInsights – This week, Bank of Japan Governor Kazuo Ueda mentioned Japan’s moderate economic recovery and hinted at further rate hikes if trends align with expectations.
Author  Mitrade
Yesterday 09: 31
Insights – This week, Bank of Japan Governor Kazuo Ueda mentioned Japan’s moderate economic recovery and hinted at further rate hikes if trends align with expectations.
Related Instrument
goTop
quote