


Ethereum Price Forecast: ETH could stage 60% rally despite recent decline
Ethereum price today: $3,090
- Ethereum's rising exchange reserve and decreasing on-chain activity are potentially responsible for its recent price decline.
- Ethereum ETFs halted their inflow streak after recording outflows of $3.2 million.
- Ethereum could rally 60% if it validates the inverted head and shoulders pattern by bouncing off the $2,817 support level.
Ethereum (ETH) is trading near the $3,000 psychological level on Friday, as its rising exchange reserve and declining network fees hint at potential reasons for its recent price decline. If ETH bounces off the $2,817 support level, it could break out of its recent decline and stage a 60% rally.
Ethereum's on-chain metrics indicate reasons price decline
Ethereum has been on a downtrend since reaching a three-month high of $3,372 on Tuesday. A key number of on-chain activities reveal potential reasons for its decline:
- Ethereum exchange reserves increased by more than 141,000 ETH worth over $430 million in the past 24 hours, per CryptoQuant's data. When an asset's exchange reserve rises, it indicates the potential for higher selling pressure. The increase in ETH's exchange reserves could be the reason for its 7% decline in the past two days.
-638673024891406824.png)
Ethereum Exchange Reserve | CryptoQuant
- Another potential reason for the price decline could be a slight drop in on-chain activity. Ethereum's total fees, which measure the total amount users pay to process transactions on its blockchain, declined from 5.65K ETH on Wednesday to 3.88K ETH on Thursday. ETH's total fees had been in an uptrend since November 9 before the decline on Thursday, indicating a drop in user activity.
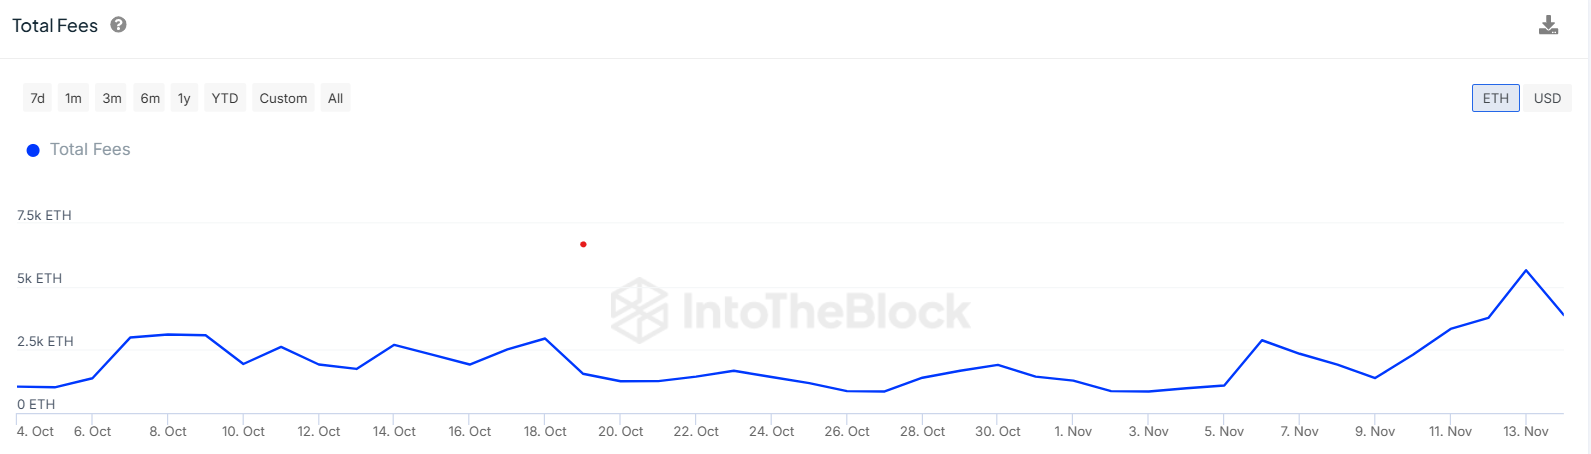
Ethereum Total Network Fees | IntoTheBlock
- Meanwhile, Ethereum exchange-traded funds (ETFs) broke their inflow streak on Thursday after recording net outflows of $3.2 million, per Coinglass data. This marks their first net outflows since November 4. Despite the outflows, ETH ETFs' trading volume remained elevated, crossing $1.63 billion — their highest volume since the first three weeks of launch.
Ethereum Price Forecast: ETH could rally 60% if it bounces off $2,817 support
Ethereum is down 1.7% following $54.48 million in liquidations in the past 24 hours. Liquidated long and short positions accounted for $37.81 million and $16.66 million, respectively.
The top altcoin is testing its 14-day Exponential Moving Average (EMA) near the $3,000 psychological level. If ETH continues the decline, it could bounce off the $2,817 key support level, which held for nearly four months between April and July.
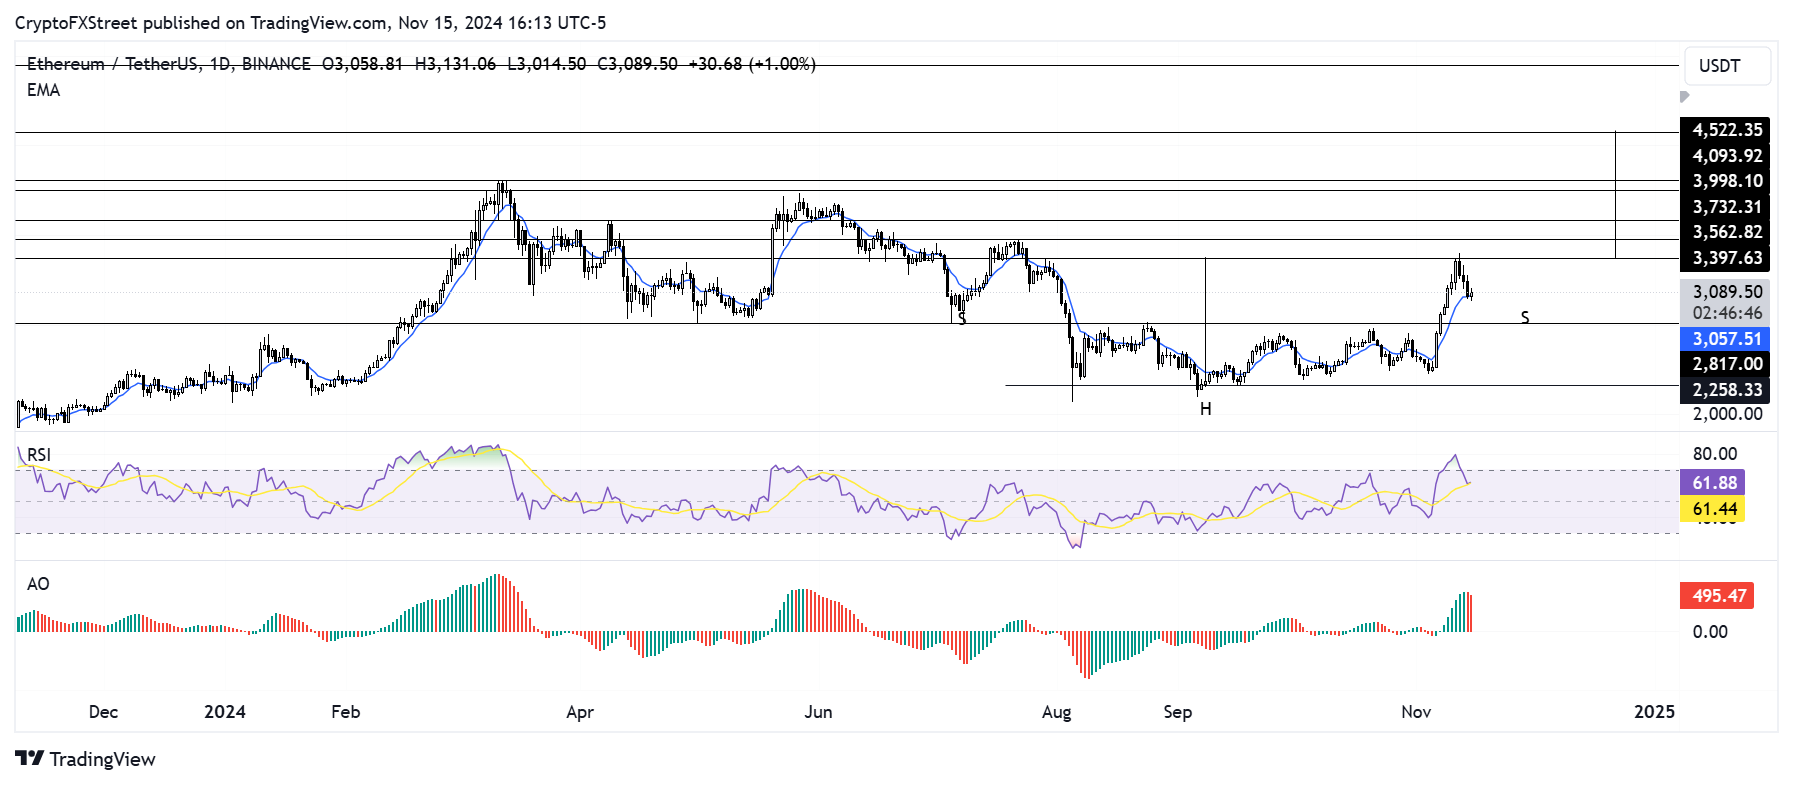
ETH/USDT daily chart
A bounce off the $2,817 support level will validate an inverted head-and-shoulders pattern that could see ETH rally nearly 60% to $4,522. However, it has to overcome several key resistance levels around $3,400, $3,562, $3,732 and its yearly high resistance of $4,093.
The Relative Strength Index (RSI) has crossed below its yellow moving average line, indicating a potential correction toward $2,817.
The Awesome Oscillator (AO) has posted consecutive red bars above its neutral level, indicating the bullish momentum is weakening.
A daily candlestick close below $2,817 will invalidate the bullish thesis.
Ethereum FAQs
Ethereum is a decentralized open-source blockchain with smart contracts functionality. Its native currency Ether (ETH), is the second-largest cryptocurrency and number one altcoin by market capitalization. The Ethereum network is tailored for building crypto solutions like decentralized finance (DeFi), GameFi, non-fungible tokens (NFTs), decentralized autonomous organizations (DAOs), etc.
Ethereum is a public decentralized blockchain technology, where developers can build and deploy applications that function without the need for a central authority. To make this easier, the network leverages the Solidity programming language and Ethereum virtual machine which helps developers create and launch applications with smart contract functionality.
Smart contracts are publicly verifiable codes that automates agreements between two or more parties. Basically, these codes self-execute encoded actions when predetermined conditions are met.
Staking is a process of earning yield on your idle crypto assets by locking them in a crypto protocol for a specified duration as a means of contributing to its security. Ethereum transitioned from a Proof-of-Work (PoW) to a Proof-of-Stake (PoS) consensus mechanism on September 15, 2022, in an event christened “The Merge.” The Merge was a key part of Ethereum's roadmap to achieve high-level scalability, decentralization and security while remaining sustainable. Unlike PoW, which requires the use of expensive hardware, PoS reduces the barrier of entry for validators by leveraging the use of crypto tokens as the core foundation of its consensus process.
Gas is the unit for measuring transaction fees that users pay for conducting transactions on Ethereum. During periods of network congestion, gas can be extremely high, causing validators to prioritize transactions based on their fees.
Recommended Articles


