GOAT’s Bullish Momentum Slows with a 6% Slide From All-Time High
The price of the popular meme coin Goatseus Maximus (GOAT) soared to a new all-time high of $0.89 during Thursday’s trading session. However, a surge in profit-taking quickly followed, pushing the altcoin down to $0.82 at press time — a 6% dip from its peak.
With key technical indicators pointing to an overheated market, GOAT price drop may be inevitable. Here’s what to watch for next.
GOAT Market Heats Up
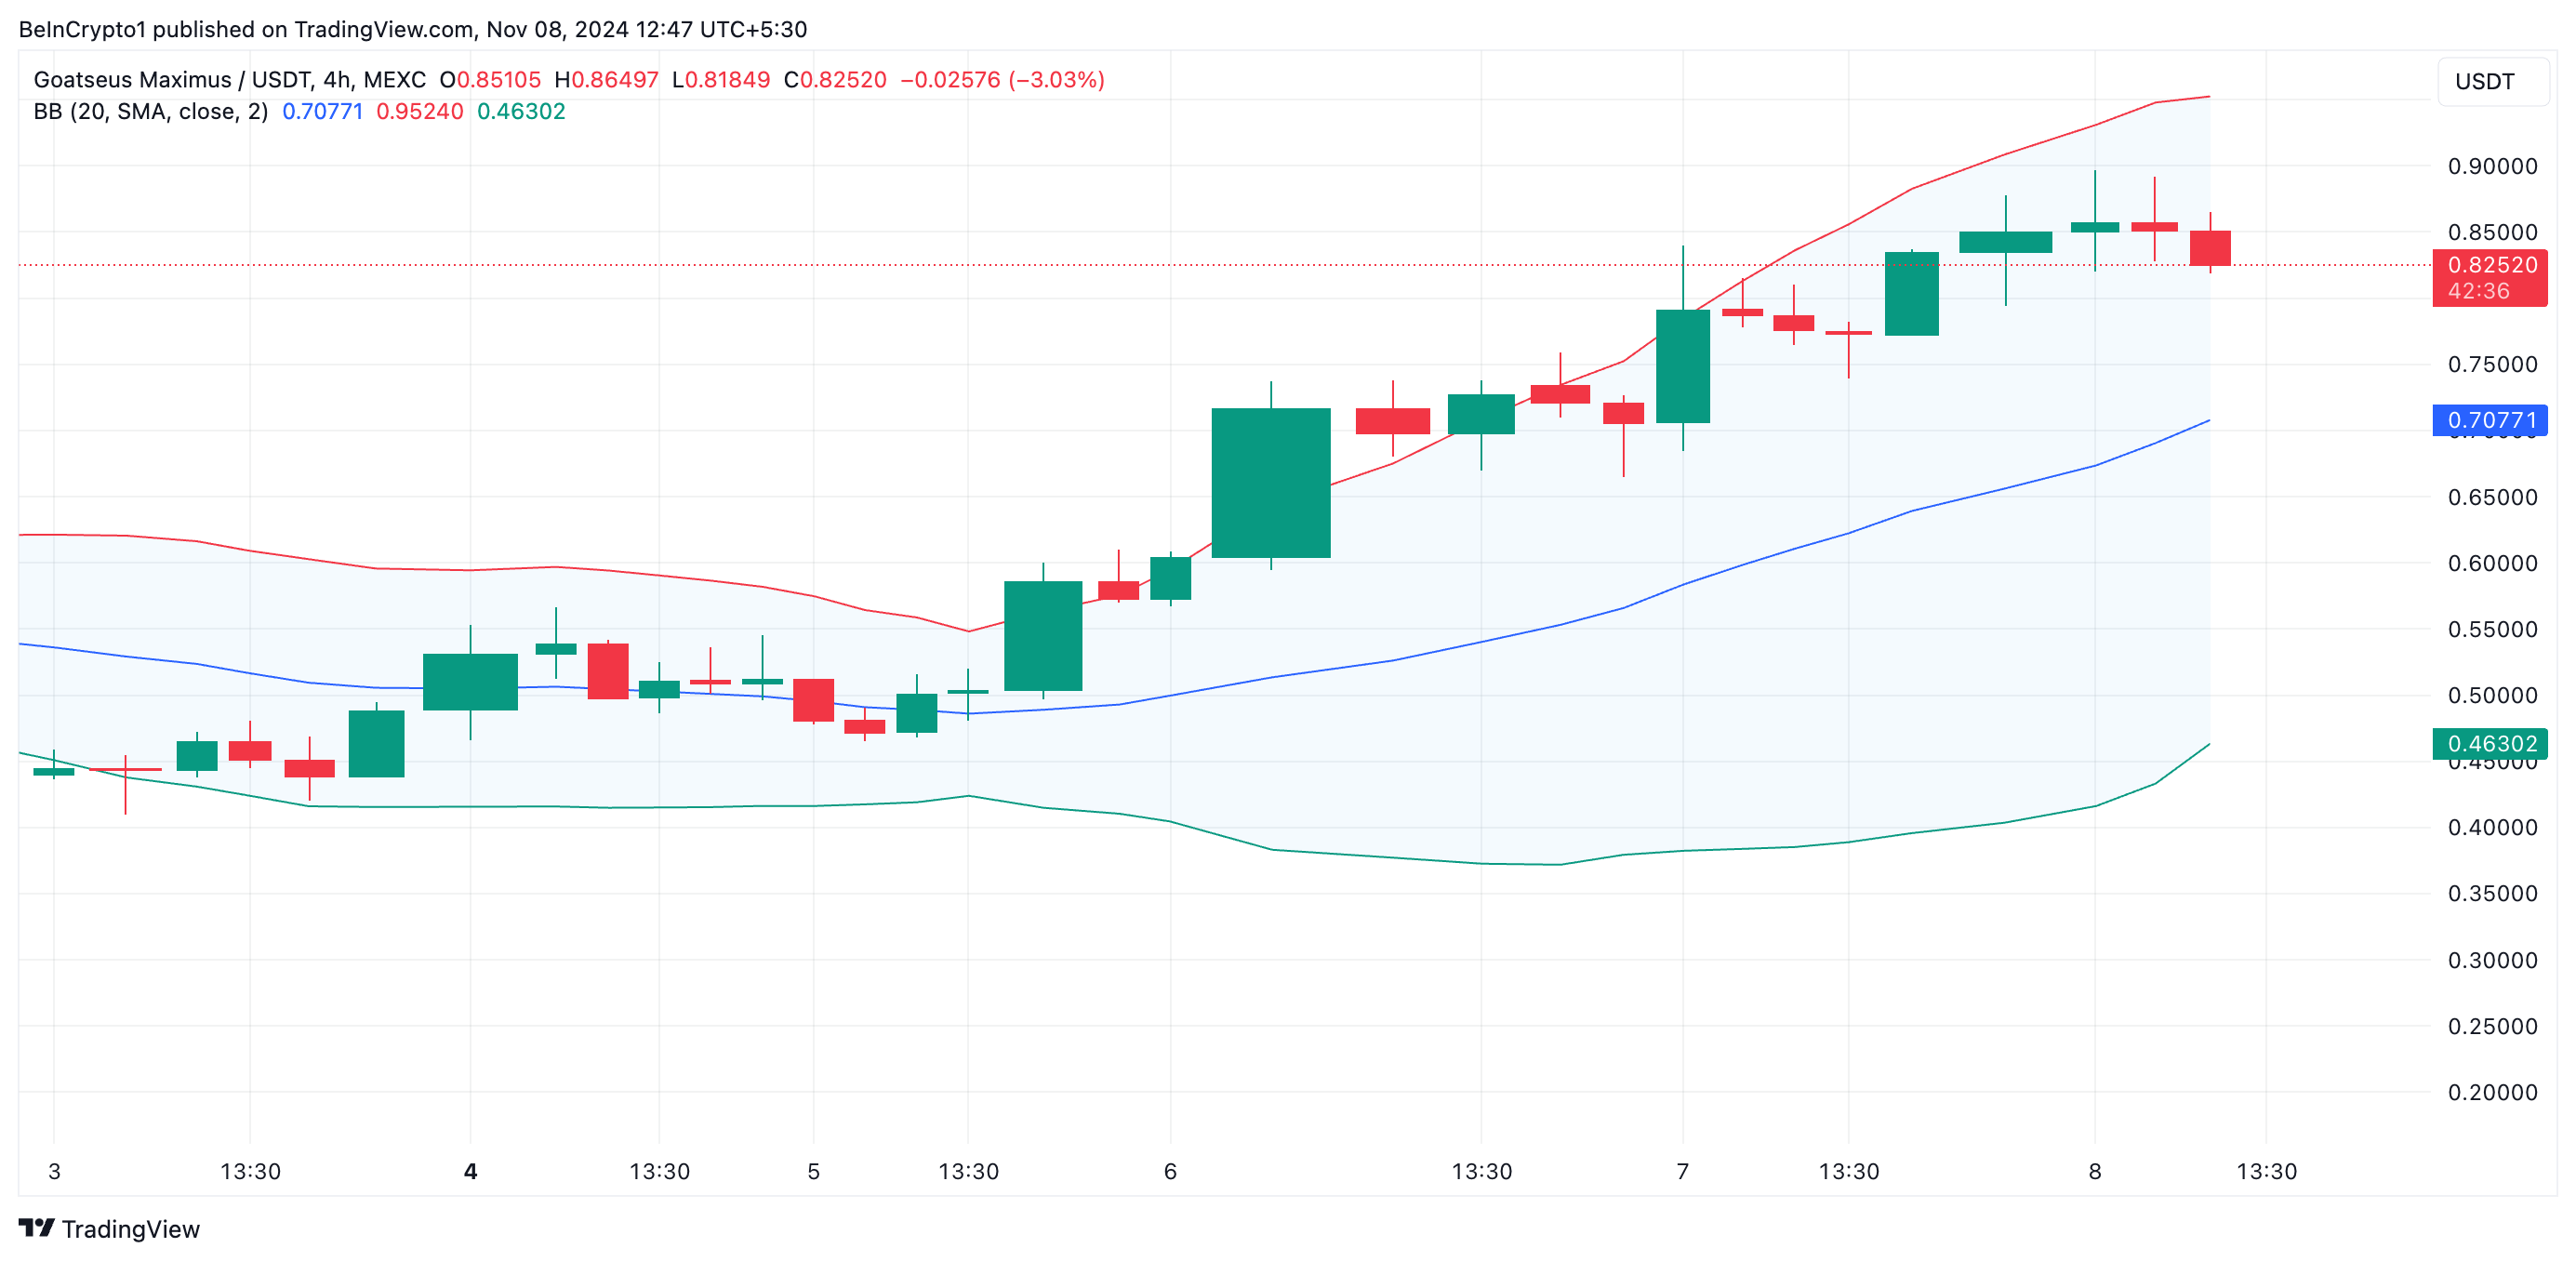
The widening gap in GOAT’s Bollinger Bands observed on a four-hour chart, reflects a surge in market volatility.
Bollinger Bands is a technical indicator that plots three lines around an asset’s price: a simple moving average at the center, with an upper and lower band marking standard deviations above and below this average. When the gap between these bands widens, it indicates increasing market volatility and potential for sharp price movements.
As of this writing, the widening distance between the upper and lower bands suggests that GOAT is at risk of significant price swings, which could break in either direction.
Read more: 11 Top Solana Meme Coins to Watch in October 2024
 GOAT Bollinger Bands. Source: TradingView
More so, the spike in GOAT’s price has pushed it toward the upper band of this indicator. When an asset’s price trades close to this line, the market is becoming overheated. This means that the asset may soon become overbought and may witness a correction.
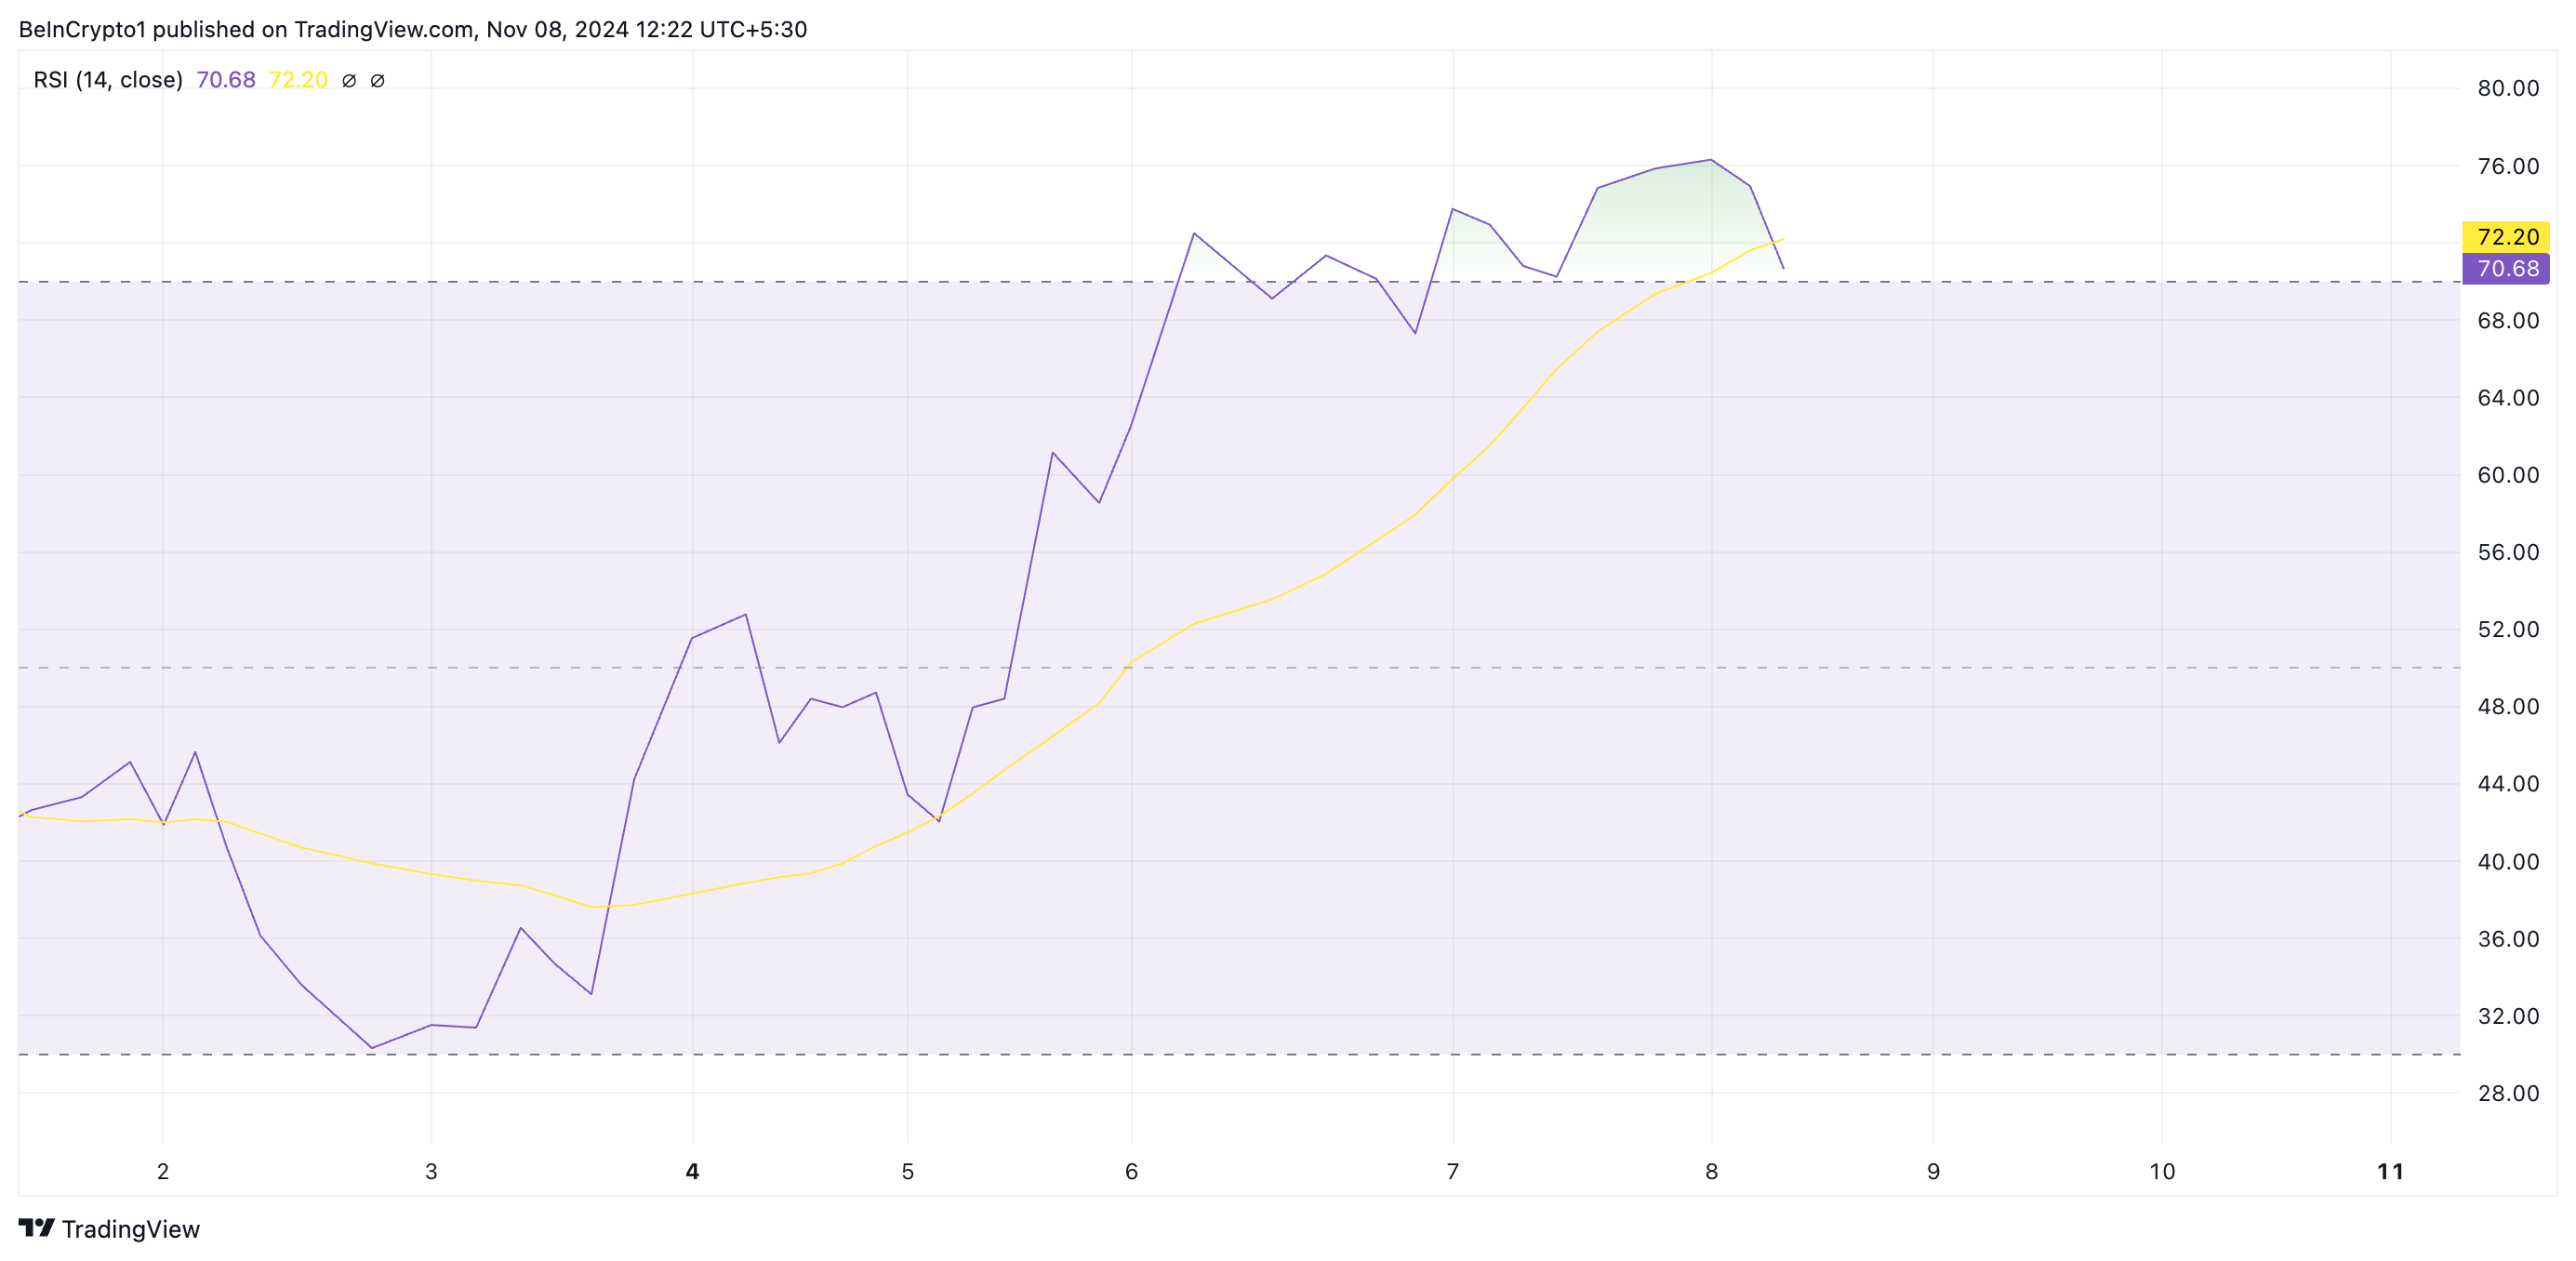
Notably, GOAT’s Relative Strength Index (RSI) confirms the overheated condition of the market. As of this writing, this is at 70.68.
The RSI indicator assesses whether an asset is overbought or oversold on a scale from 0 to 100. Values above 70 indicate an overbought condition, suggesting a potential correction, while values below 30 point to an oversold state, hinting at a possible rebound. GOAT’s current RSI of 70.68 indicates that it is overbought and may be gearing for a correction.
 GOAT RSI. Source: TradingView
GOAT Price Prediction: Brace For More Dip
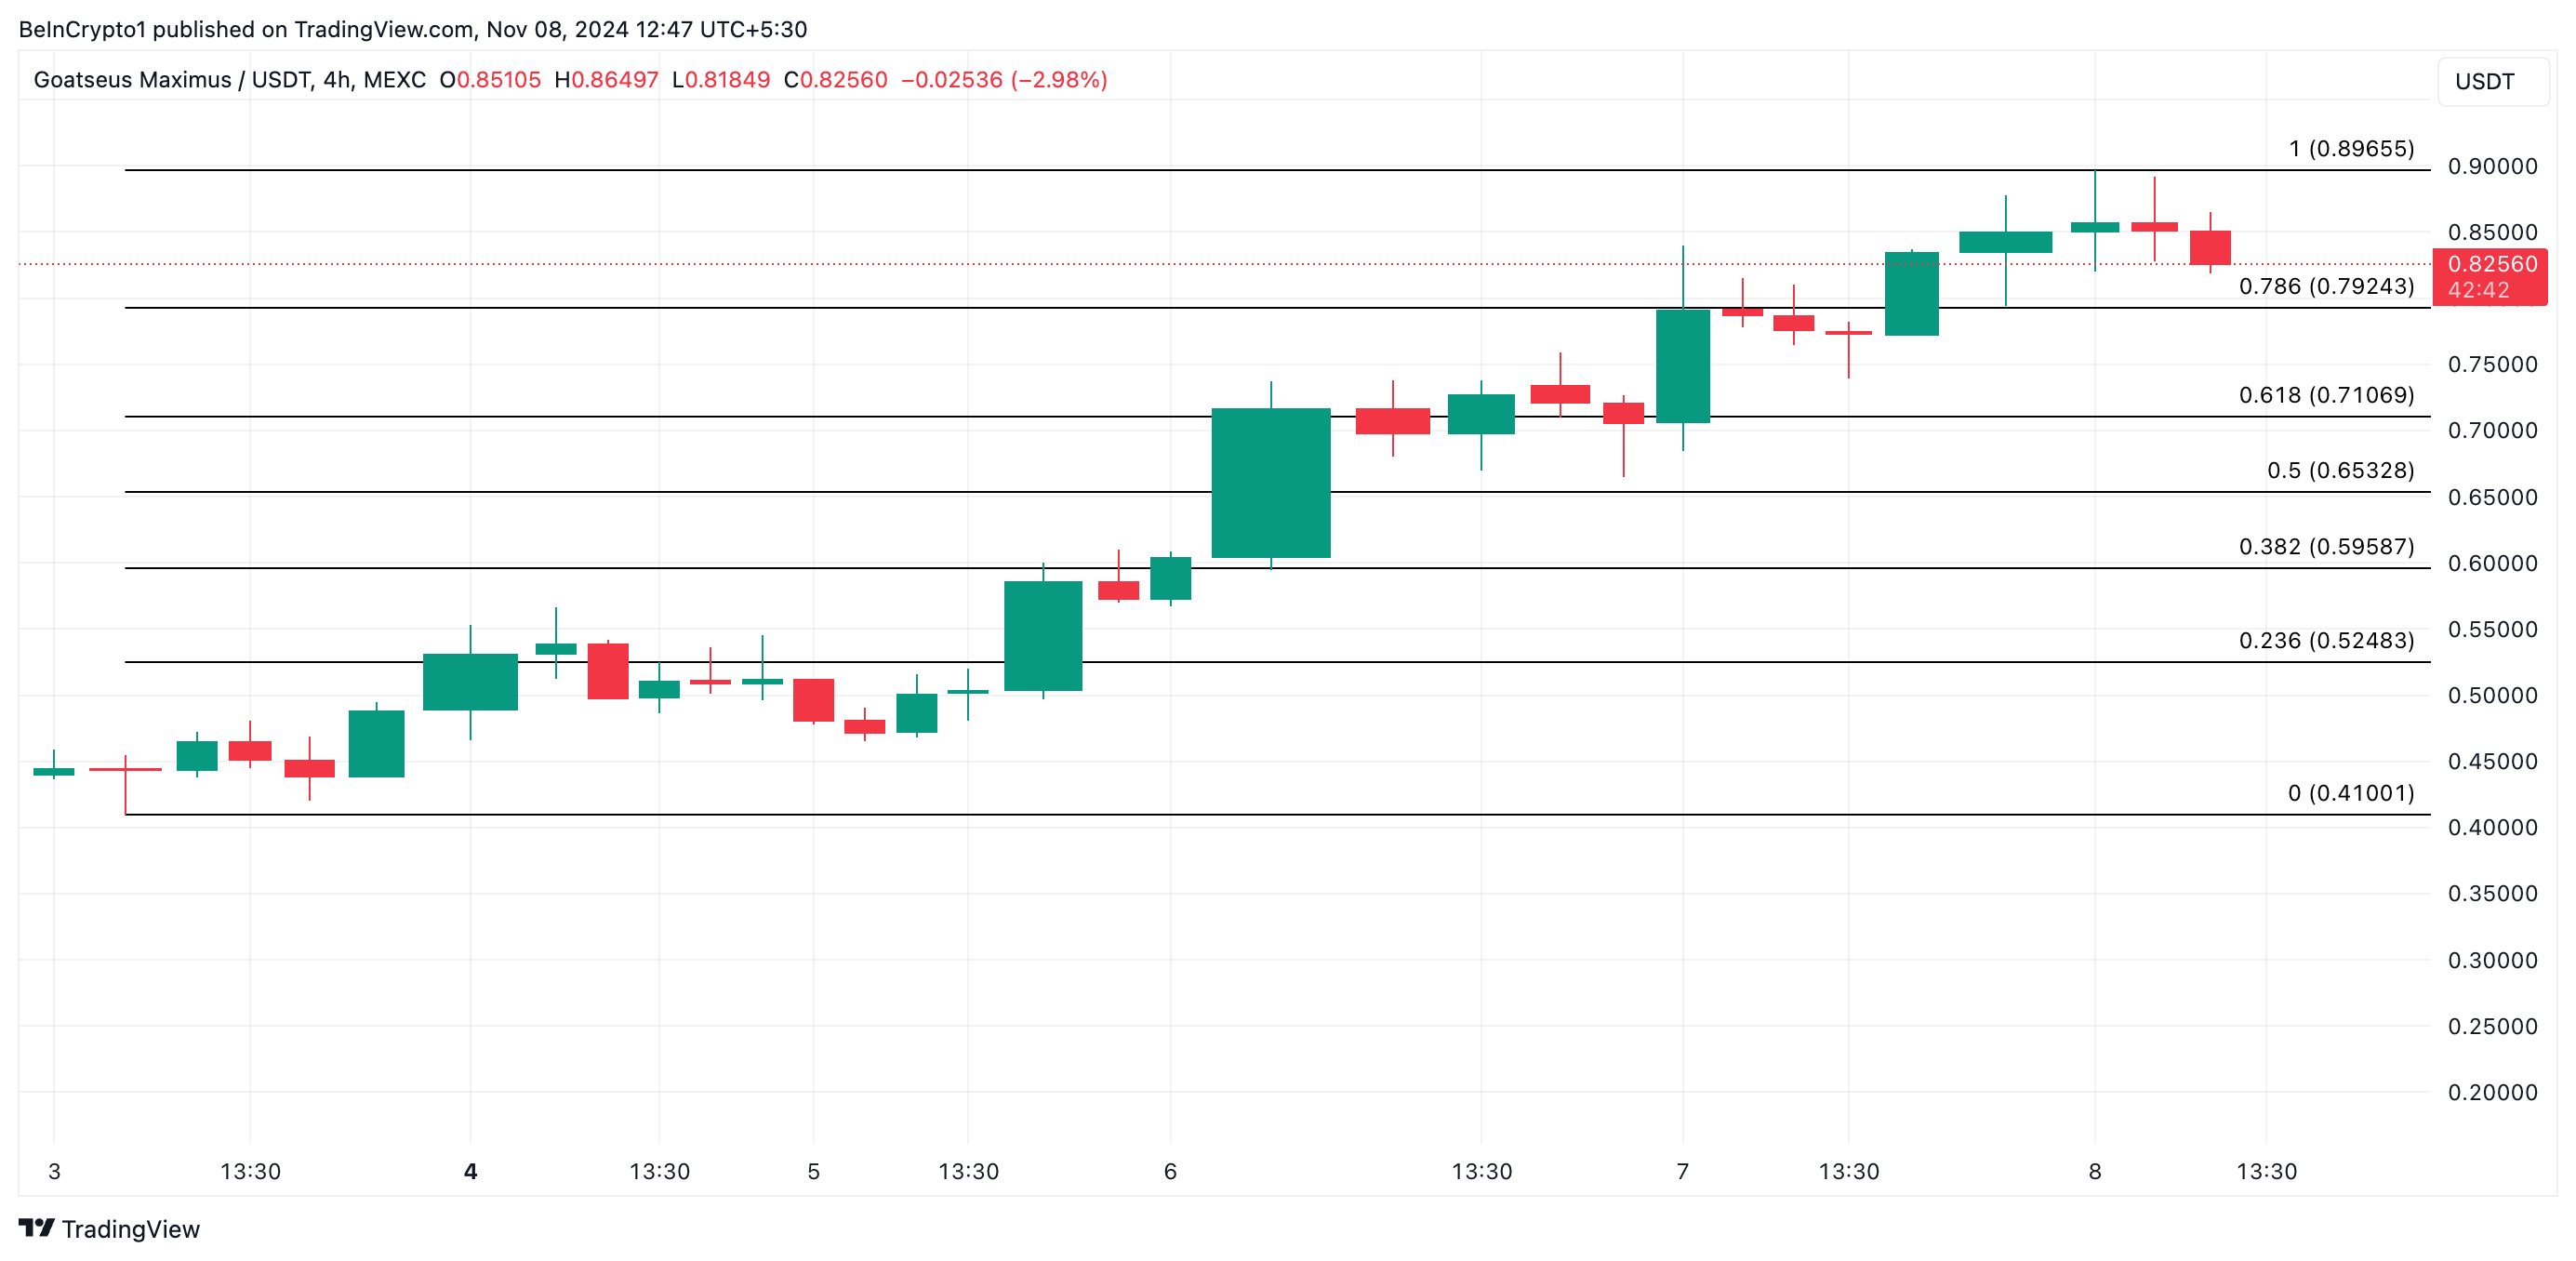
A combination of heightened volatility and overbought market conditions suggests that GOAT’s price may continue to pull back. Using the Fibonacci Retracement tool, should this occur, the price could decline toward $0.71, where significant support is located. If this level fails to hold, the GOAT’s price may drop further to $0.52.
Read more: 7 Hot Meme Coins and Altcoins that are Trending in 2024
 GOAT Price Analysis. Source: TradingView
On the other hand, if GOAT resumes its uptrend, it could reclaim its all-time high of $0.89, potentially rallying beyond that level and invalidating the bearish outlook outlined above.


