


dYdX price prediction 2024 – 2030: Will dYdX hit $10?
Key Takeaways
- dYdX price faces volatility around $0.9.
- Our dYdX price prediction for 2024 expects a maximum price of $2.8.
- In 2030, we expect the dYdX price to touch $29.58.
The dYdX exchange captured significant attention late last year with the launch of its proprietary blockchain. The platform aimed to migrate its existing dYdX tokens from Ethereum to this new mainnet. However, in the fall of 2024, the platform disclosed that it was reducing its workforce by 35%.
As dYdX’s on-chain activities surge, questions arise, such as: “Does dYdX have the potential to hit the $10 mark soon?” or “Will dYdX ever go up?” or “Where will dYdX be in 5 years?” Let’s answer them using our dYdX price prediction.
Overview
| Cryptocurrency | dYdX |
| Token | dYdX |
| Price | $0.94 |
| Market Cap | $611.61M |
| Trading Volume | $36.99M |
| Circulating Supply | 643.93M dYdX |
| All-time High | $4.53 |
| All-time Low | $0.8067 |
| 24-hour high | $0.948 |
| 24-hour low | $0.937 |
dYdX price prediction: Technical analysis
| Metric | Value |
| Current Price | $ 0.975013 |
| Price Prediction | $ 3.23 (226.16%) |
| Fear & Greed Index | 69 (Greed) |
| Sentiment | Bearish |
| Volatility | 9.46% |
| Green Days | 16/30 (53%) |
| 50-Day SMA | $ 0.974762 |
| 200-Day SMA | $ 1.459201 |
| 14-Day RSI | 48.13 |
dYdX price analysis: dYdX faces increased bear pressure, potential breakout above $1.1 soon?
TL;DR Breakdown:
- dYdX price analysis shows that dYdX is facing bearish pressure.
- Resistance for dYdX is present at $1.11.
- Support for dYdX/USD is present at $0.9.
The dYdX price analysis for November 3 confirms that dYdX is facing increased selling pressure toward the $0.9 mark. However, dYdX’s price now aims for a quick surge above the immediate resistance level.
dYdX price analysis 1-day chart: dYdX price faces bearish volatility below $1
An analysis of the daily dYdX price chart shows that the token is facing intense bearish pressure as it aims to hold on to its momentum. As a result, the dYdX price is now aiming for a trend below the $1 mark. The 24-hour volume has declined to $11.5 million, raising interest in trading today. dYdX is trading at $0.94, decreasing by over 1.6% in the last 24 hours.

The RSI-14 trend line has declined from its previous level and currently trades below the midline at 44, hinting that a bearish pressure is on the edge. The SMA-14 level suggests volatility in the next few hours.
dYdX/USD 4-hour price chart: Bulls aim for an immediate correction
The 4-hour dYdX price chart suggests that bears are strengthening their position as they are aiming to hold the price below the EMA trend lines. Currently, bears are maintaining selling confidence as the dYdX price aims for a retest of support at $0.9.
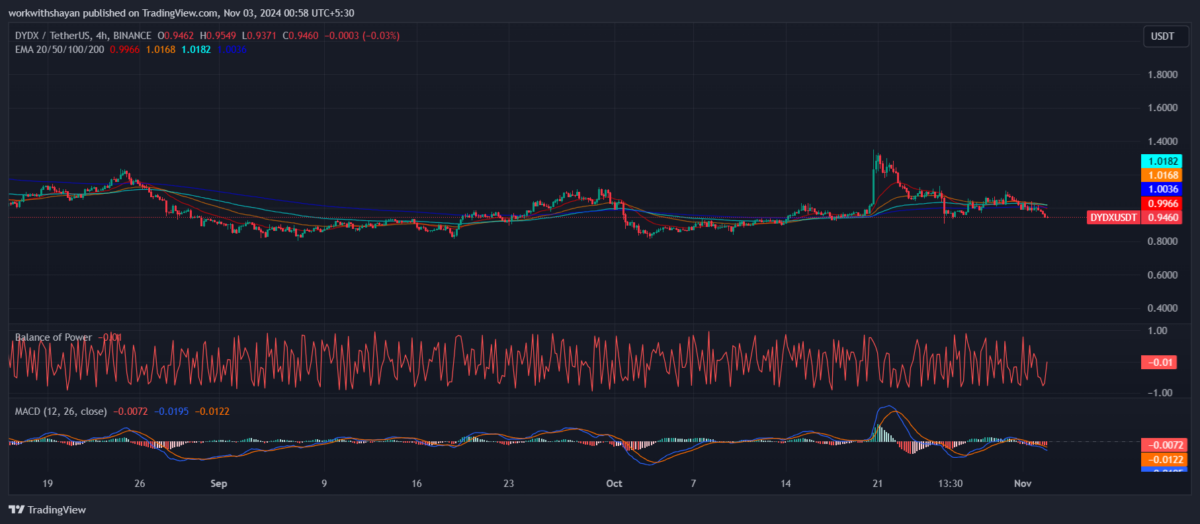
dYdX aims for immediate correction
The BoP indicator trades in a bearish region at 0.01, showing that short-term sellers are taking a chance to accelerate a downward trend. Additionally, the MACD trend line has formed red candles below the signal line and the indicator aims for a negative momentum, strengthening short-position holders’ confidence.
dYdX technical indicators: Levels and action
Daily simple moving average (SMA)
| Period | Value | Action |
| SMA 3 | $ 0.999137 | SELL |
| SMA 5 | $ 1.026175 | SELL |
| SMA 10 | $ 1.008047 | SELL |
| SMA 21 | $ 1.035951 | SELL |
| SMA 50 | $ 0.974762 | BUY |
| SMA 100 | $ 1.014133 | SELL |
| SMA 200 | $ 1.459201 | SELL |
Daily Exponential Moving Average (EMA)
| Period | Value | Action |
| EMA 3 | $ 1.014938 | SELL |
| EMA 5 | $ 0.99862 | SELL |
| EMA 10 | $ 0.973451 | BUY |
| EMA 21 | $ 0.95601 | BUY |
| EMA 50 | $ 0.974783 | BUY |
| EMA 100 | $ 1.120012 | SELL |
| EMA 200 | $ 1.491762 | SELL |
What to expect from dYdX price analysis next?
The hourly price chart confirms that dYdX is attempting a dip below the immediate support line; however, bulls are eyeing an upside recovery rally in the coming hours. If dYdX’s price holds momentum above $1.1113, it will fuel a bullish rally to $1.31.
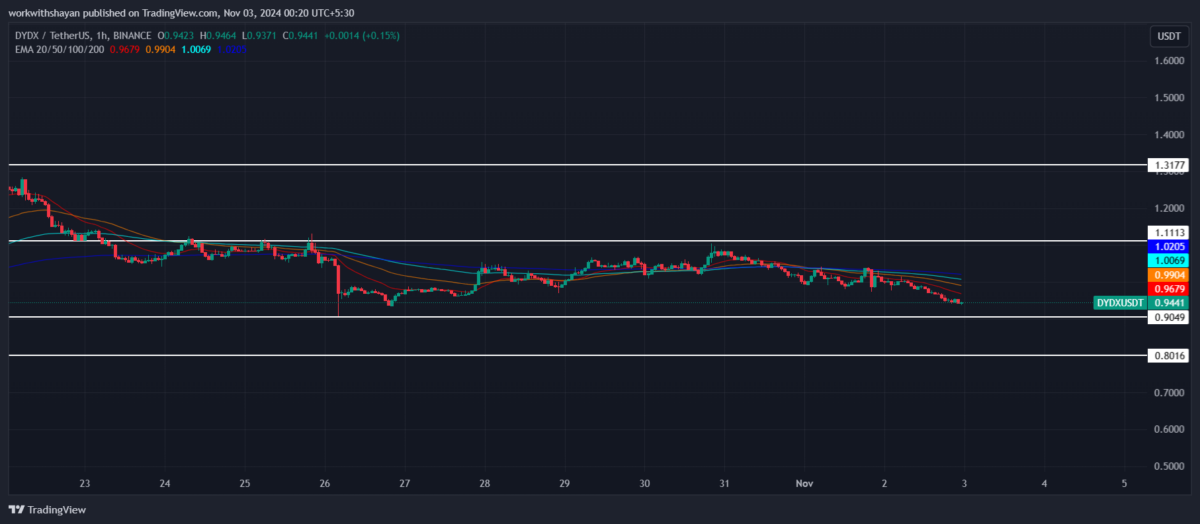
If bulls fail to initiate a surge, the dYdX price may drop below the immediate support line at $0.9, beginning a bearish trend to $0.8.
Is dYdX a good investment?
The rising institutional demand for dYdX makes it a good investment option. However, dYdX has a short investment history filled with very volatile phases. Whether it is a good investment depends on your financial profile, investment portfolio, risk tolerance, and investment goals.
Why is dYdX down today?
Today, dYdX faced intense selling pressure as it dropped below the crucial $1 support line. This created a surge in stop-loss orders for holders. However, buyers are defending further declines and aiming for a quick recovery.
Will dYdX price recover?
If buyers hold the buying momentum of dYdX and send it past the $1 mark, we might see a significant recovery in the coming hours. The current low might be a good time to buy and this might create a strong support level for dYdX’s price.
Will dYdX reach $10?
Depending on market sentiments, dYdX might hit the $10 mark by the end of 2027. However, any bearish news might weaken this prediction.
Will the dYdX price reach $100?
$100 will be a significant milestone for dYdX. However, it is achievable if dYdX continues to attract institutional interest in the coming years.
Is dYdX a good long-term investment?
As several institutions continue to accumulate dYdX, and it faces a rise in global recognition, dYdX has a solid long-term future.
Recent news/opinion on dYdX
- dYdX announced a 35% cut in staff strength
The decentralized trading platform dYdX, based in Switzerland, has announced a 35% cut in its core workforce. CEO Antonio Juliano shared the initial news in a short post on X, describing the decision as “sad” and committing to share a more detailed explanation later.
dYdX price prediction November 2024
October was a rollercoaster month for dYdX as increasing trading volume pushed dYdX price above the $1 mark. However, the current trend suggests a bearish pullback in the dYdX price. Is there hope for a turnaround in November?
dYdX’s price might attempt to surge toward $1.4 from its recent low and be pushed further, at least $1.8 if strong downward pressures are not seen. However, we might see a rejection on the bearish side, leading to a consolidation around $0.8.
| dYdX price prediction | Minimum price | Average price | Maximum price |
| dYdX price prediction November 2024 | $0.8 | $1.4 | $1.8 |
dYdX price prediction 2024
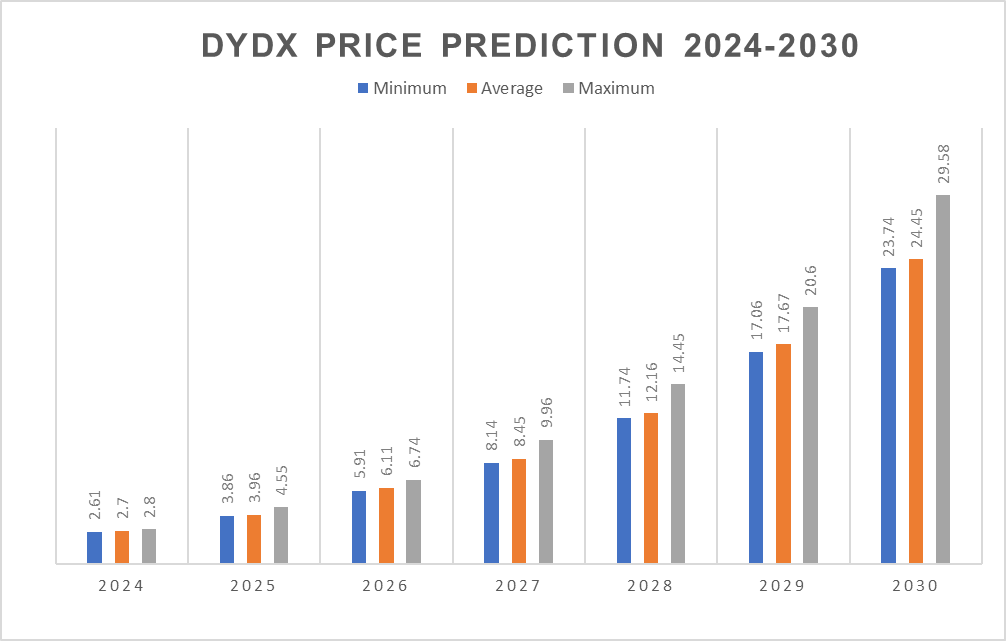
The price of 1 dYdX is expected to reach a minimum level of $2.61 by the end of 2024. Traders and investors can expect a maximum level of $2.80 and an average price of $2.70 if the bulls show up.
| dYdX price prediction | Minimum price | Average price | Maximum price |
| dYdX price prediction 2024 | $2.61 | $2.7 | $2.8 |
dYdX price predictions 2025-2030
| Year | Minimum price ($) | Average price ($) | Maximum price ($) |
| 2025 | 3.86 | 3.96 | 4.55 |
| 2026 | 5.91 | 6.11 | 6.74 |
| 2027 | 8.14 | 8.45 | 9.96 |
| 2028 | 11.74 | 12.16 | 14.45 |
| 2029 | 17.06 | 17.67 | 20.6 |
| 2030 | 23.74 | 24.45 | 29.58 |
dYdX price prediction 2025
The unit price of dYdX in 2025 is expected to hit a minimum of $3.86. According to expert analysis, dYdX could reach up to $4.55, with an average price of $3.96.
dYdX price prediction 2026
In 2026, dYdX could see its price range between a minimum of $5.91 and a maximum of $6.74. Traders can expect an average price of $6.11 throughout the year.
dYdX price prediction 2027
For 2027, the price forecast indicates a minimum level of $8.14 and a potential high of $9.96, with the average settling around $8.45.
dYdX price prediction 2028
Looking ahead to 2028, projections suggest a minimum price of $11.74 and a maximum price of $14.45 for dYdX, with an average price of $12.16.
dYdX price forecast 2029
By 2029, the dYdX price is anticipated to range from a minimum of $17.06 to a maximum of $20.60, averaging around $17.67.
dYdX (dYdX) price prediction 2030
For 2030, the dYdX price is forecasted to potentially reach a minimum of $23.74, a maximum of $29.58, and an average trading value of $24.45.
dYdX market price prediction: Analysts’ dYdX price forecast
| Firm Name | 2024 | 2025 |
| Coincodex | $2.9 | $2.5 |
| Digital Coin Price | $3.5 | $4.8 |
| Changelly | $2.8 | $5.4 |
Cryptopolitan’s dYdX (dYdX) price prediction
Per Cryptopolitan, the price of dYdX is expected to reach a minimum level of $1.5, a maximum level of $2, and an average price of $1.62 by the end of 2024. If the market stays positive, we expect the dYdX price to trade well above $5 by 2027.
However, the future market potential for dYdX entirely depends on its buying demand, regulation, and investor sentiment in long-term holding.
dYdX historical price sentiment

- Last Week (Oct. 25, 2024): $1.12
- Last Month (Oct. 1, 2024): $1.04
- Three Months Ago (Aug. 1, 2024): $1.20
- Launch Price (Dec. 12, 2023): $2.38
- All-Time High (March 7, 2024): $4.53
- All-Time Low (Sept. 6, 2024): $0.8067
- Current price range (November): $0.937 – $0.948
Recommended Articles


