Potential Death Cross Puts Dogwifhat (WIF) Price at Risk of Sharp Decline
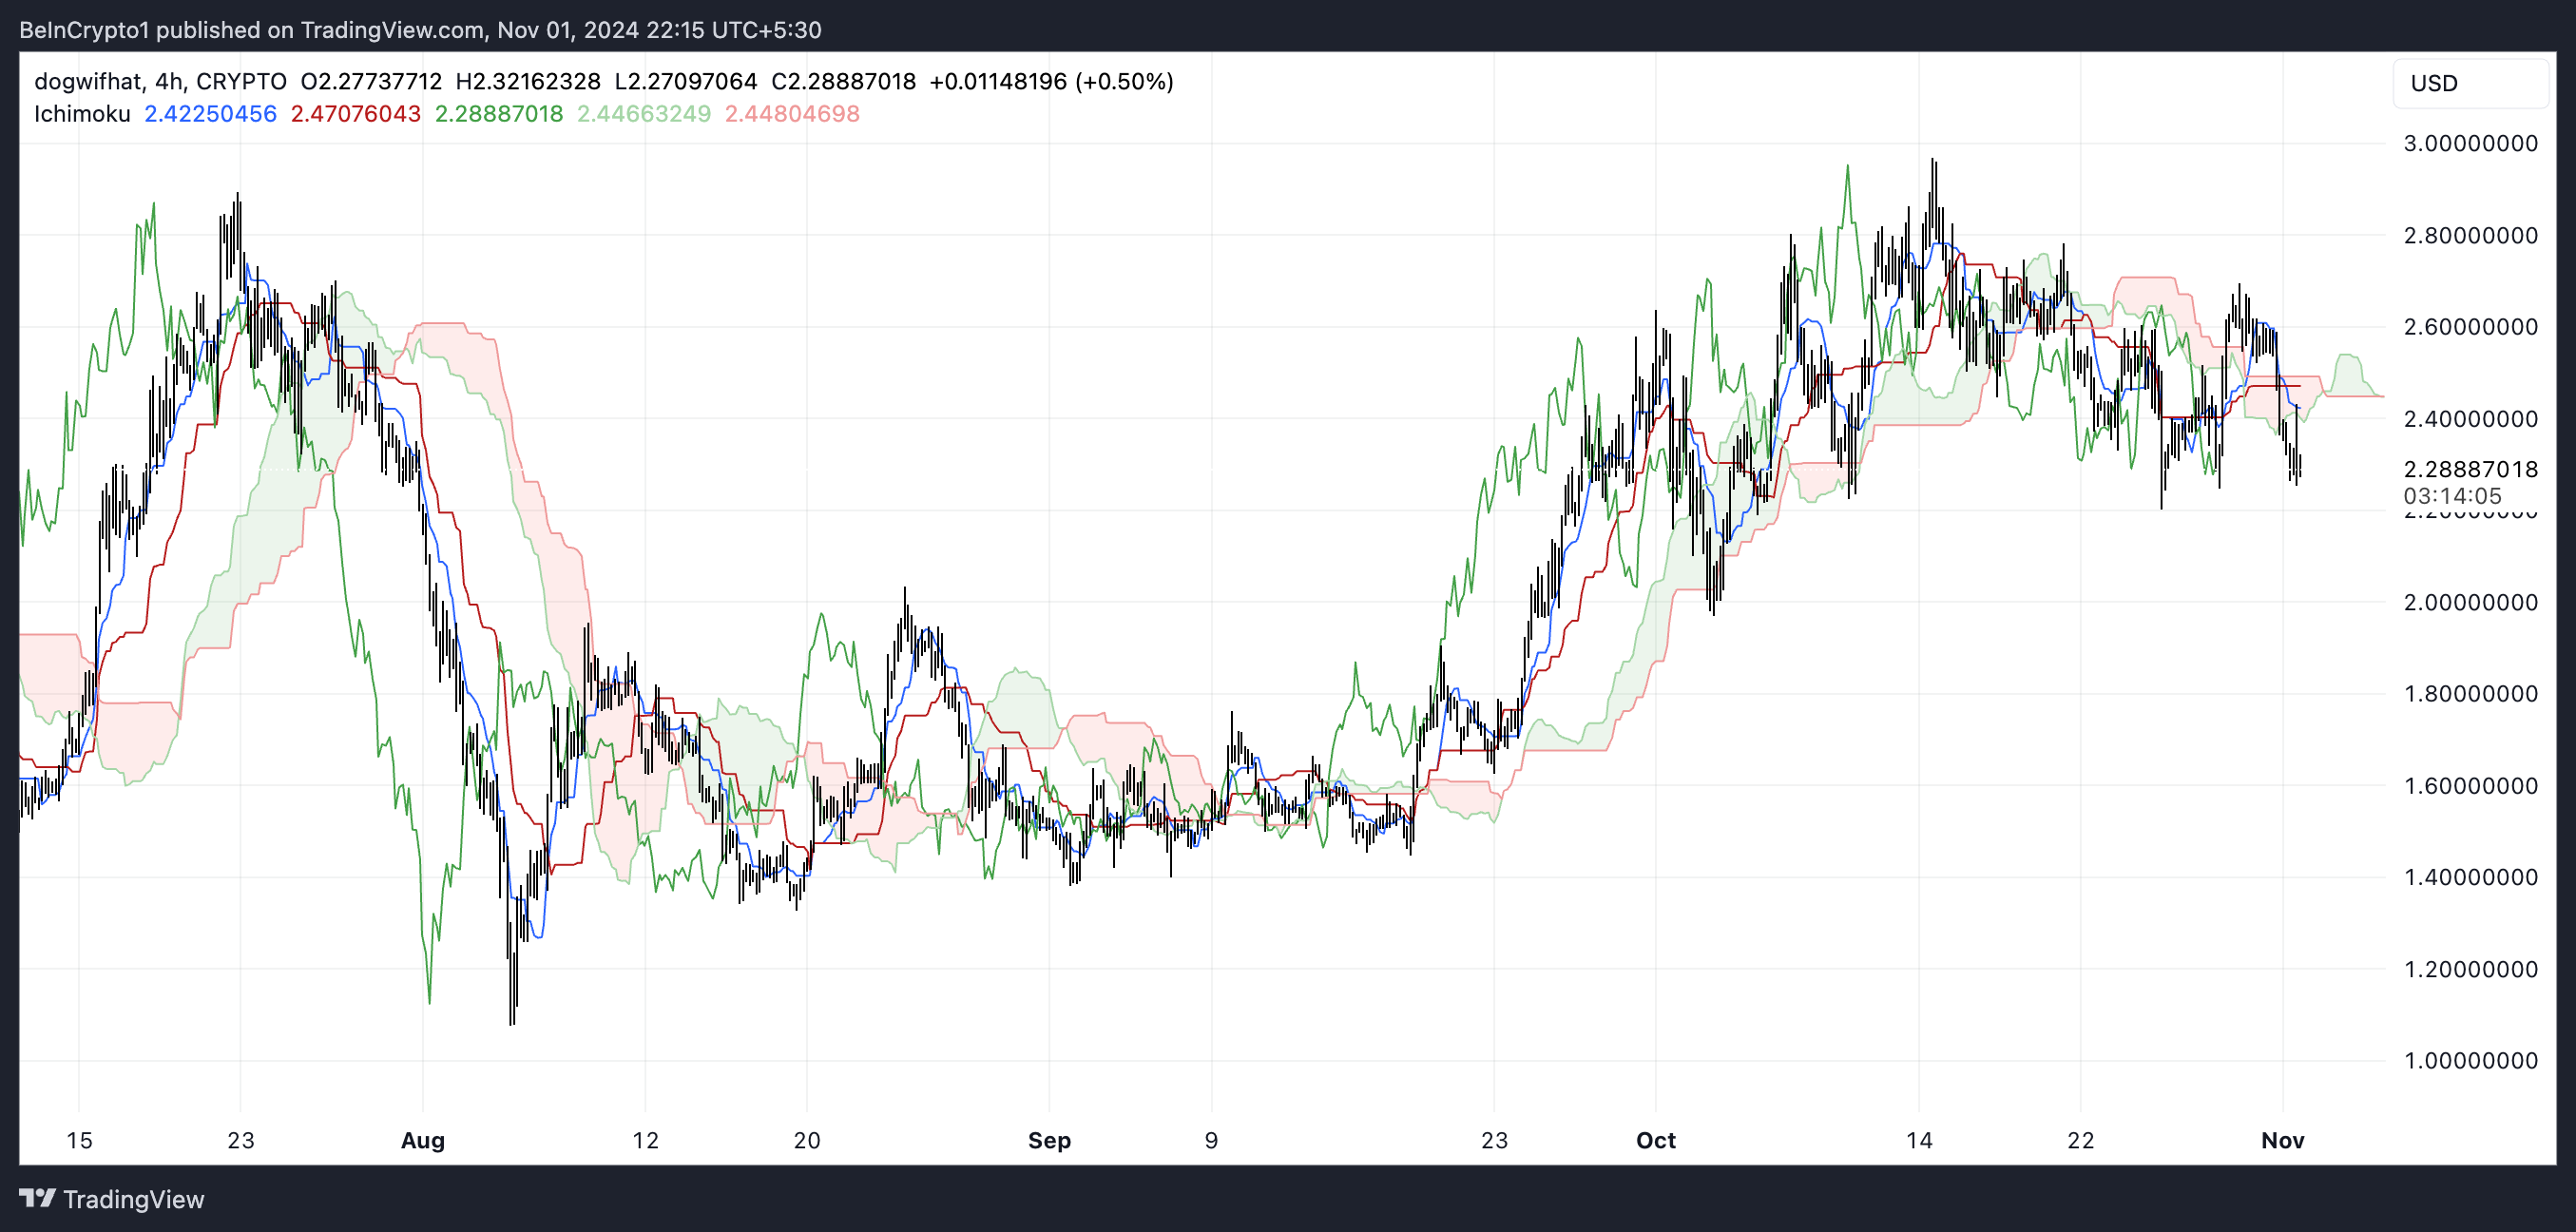
Dogwifhat (WIF) price has shown mixed signals, with gains of 22.43% over the last three months but a decline of 5.53% in the past week. The Ichimoku Cloud on the WIF chart indicates a period of indecision, with the price hovering near the cloud and reflecting a neutral market stance.
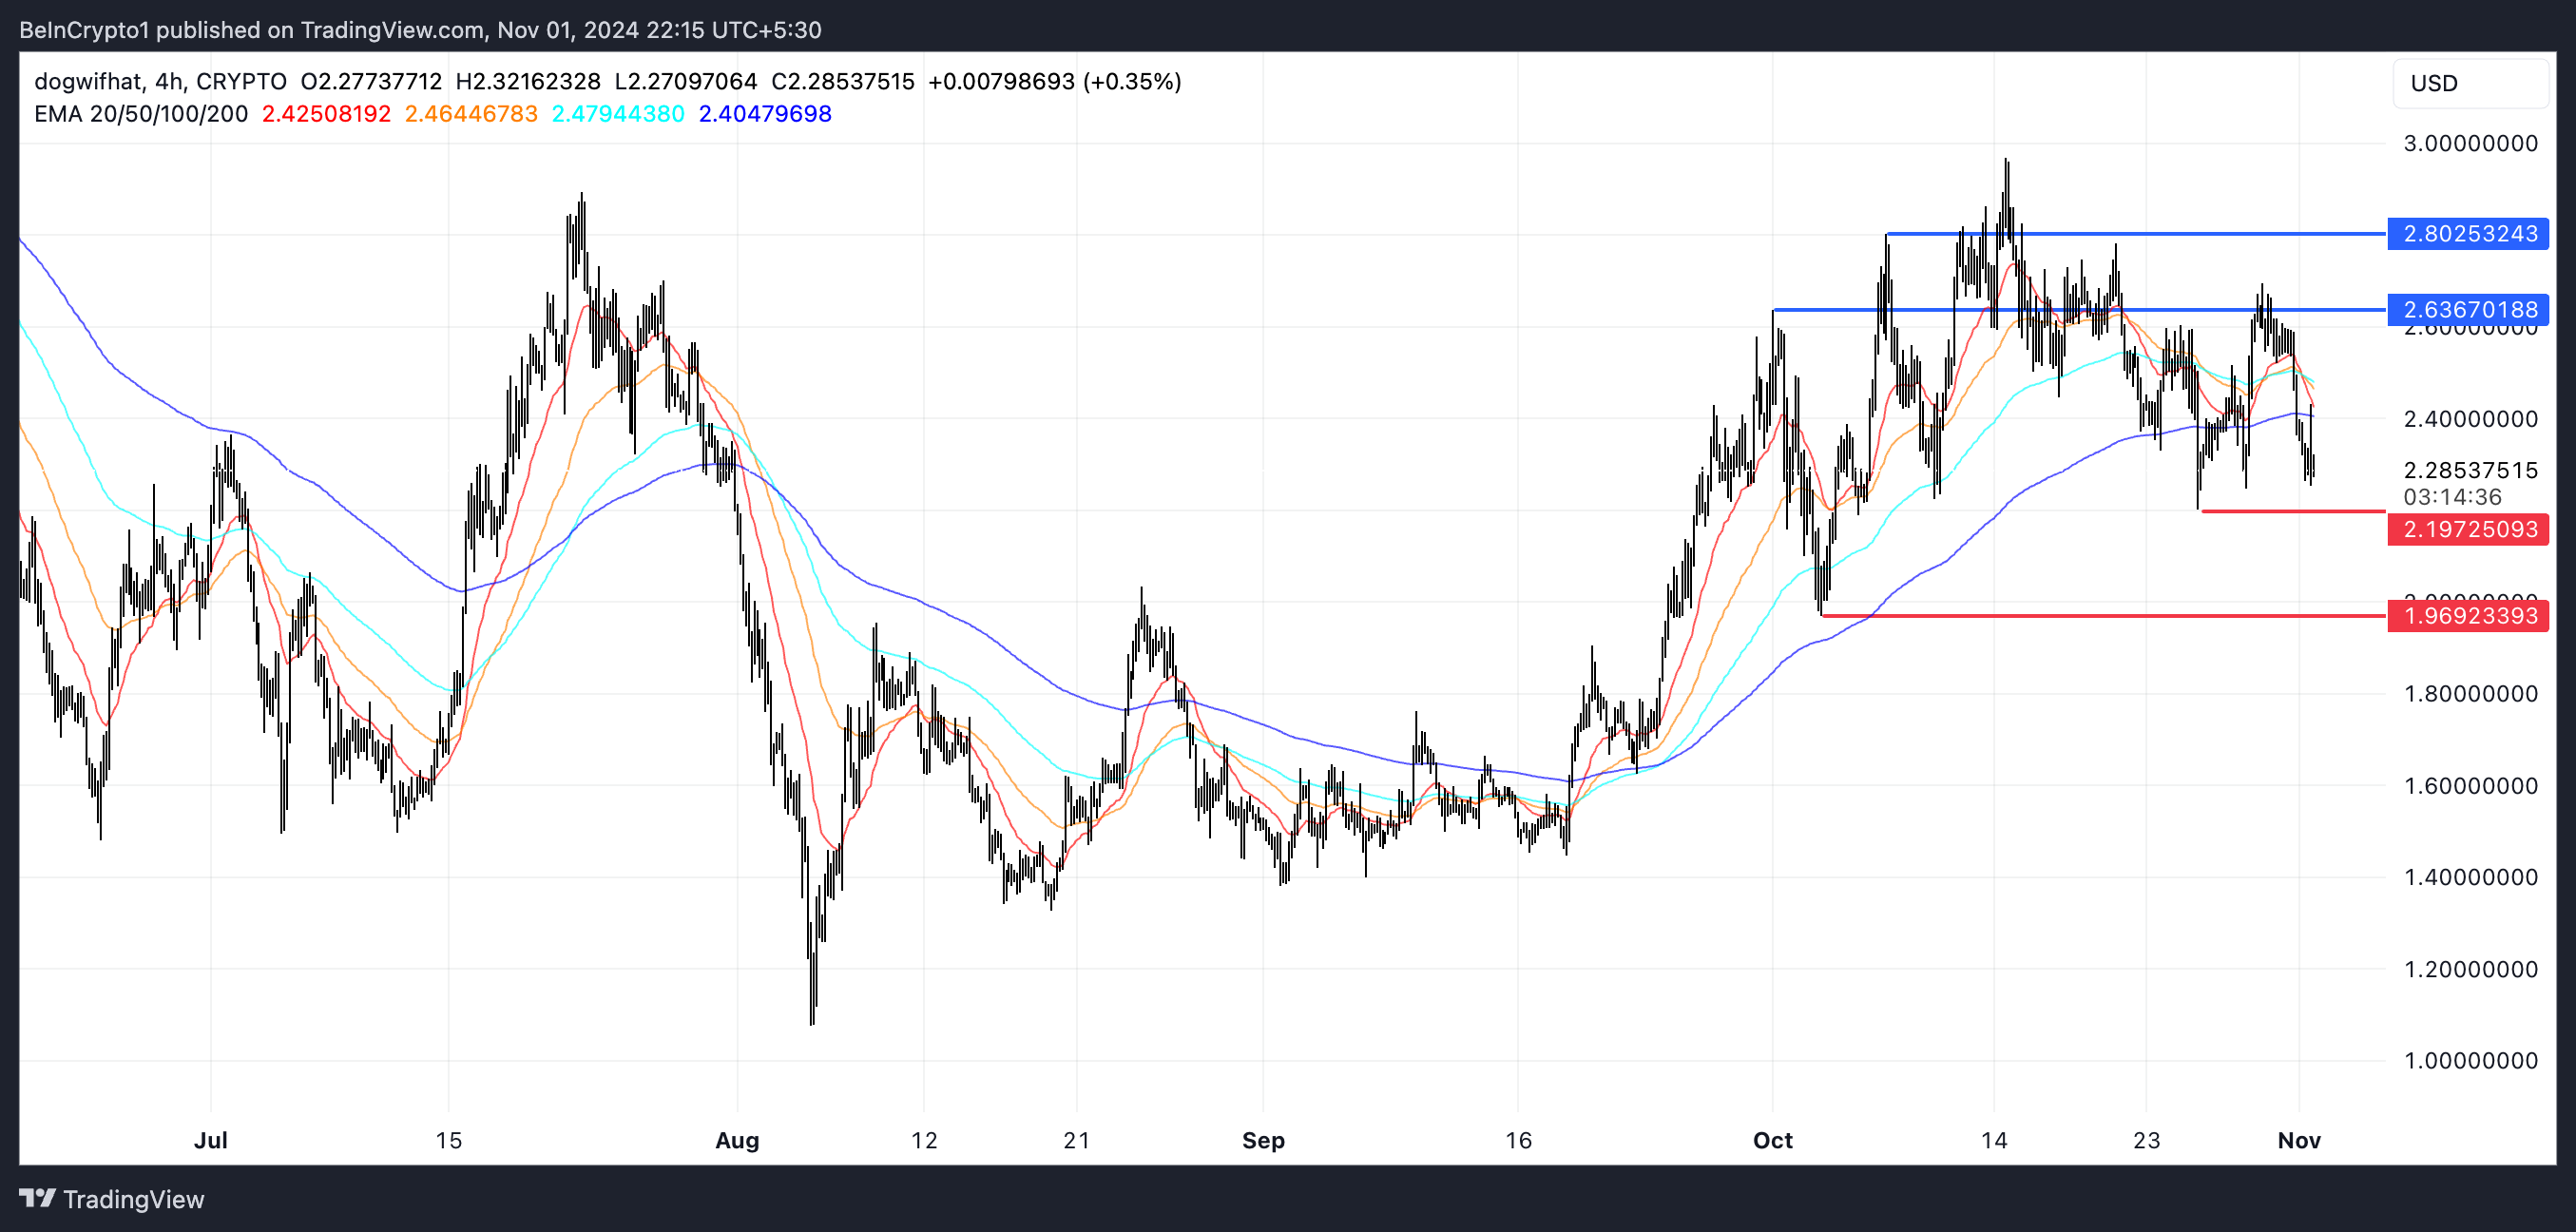
The ADX suggests the current downtrend lacks strength, though the EMA lines are nearing a bearish “death cross” formation. If the downtrend gains momentum, WIF could see further declines; however, a reversal could push it back toward key resistance levels.
WIF Ichimoku Cloud Shows Mixed Signals
The Ichimoku Cloud on the WIF chart shows that the price is moving close to the cloud, indicating a period of indecision.
When prices sit within the cloud, it usually signals a neutral phase, where neither buyers nor sellers are in control. The cloud’s alternating colors — red and green — reflect this mixed sentiment.
Read more: How to Buy Solana Meme Coins: A Step-By-Step Guide
 WIF Ichimoku Cloud. Source: TradingView
The leading span lines, Senkou Span A and Senkou Span B, hint at future support and resistance. The cloud’s thin sections suggest the price could break out if momentum increases. A move above the cloud could confirm a bullish trend, while a drop below may indicate a bearish shift.
Dogwifhat ADX Shows the Current Downtrend Is Not That Strong Yet
WIF’s ADX has risen to 19.07 from around 15 a few days ago, indicating a slight increase in trend strength.
However, an ADX below 20 typically suggests a weak or non-existent trend, meaning that the recent changes in WIF’s price haven’t been strong enough to establish a solid direction.
 WIF ADX. Source: TradingView
The ADX, or Average Directional Index, measures the strength of a trend without indicating its direction. Generally, an ADX above 25 points to a strong trend, while values below 20 reflect a lack of clear trend momentum.
Currently, WIF is in a downtrend, but with the ADX still below 20, it suggests that the downtrend lacks strong momentum and could be prone to reversals or fluctuations.
WIF Price Prediction: Death Cross Could Trigger 14% Correction
WIF’s EMA lines currently show a bearish setup, with the price positioned below them and the short-term EMAs nearing a “death cross” as they approach crossing below the long-term EMAs. This formation often signals a stronger downtrend, suggesting that selling pressure might increase if it fully forms.
Read more: How To Buy Dogwifhat (WIF) and Everything Else To Know
 WIF EMA Lines and Support and Resistance. Source: TradingView
However, indicators like the ADX and Ichimoku Cloud reveal that the current downtrend may still be weak. If momentum reverses, WIF price could attempt to test resistance at $2.63, and potentially even $2.80. That could be also driven by SOL price, since WIF is one of the most relevant meme coins in the Solana ecosystem.
Conversely, if the death cross completes and the downtrend gains strength, WIF might drop further to test support at $2.19, and possibly as low as $1.96, implying a potential 14% decline.
