Toncoin Price Drop Signals a Possible Buy-the-Dip Moment, But There Is a Catch
Toncoin (TON), the Telegram-linked cryptocurrency, has seen a double-digit decline over the past month, now trading at $4.85 — an 11% drop in 30 days.
On-chain data suggests that Toncoin’s recent price drop may have left it undervalued, hinting at a potential buying opportunity for dip-seeking investors. But the question remains: is now the right time to buy Toncoin?
Toncoin Flashes Buy Signal, But It Comes With Risks
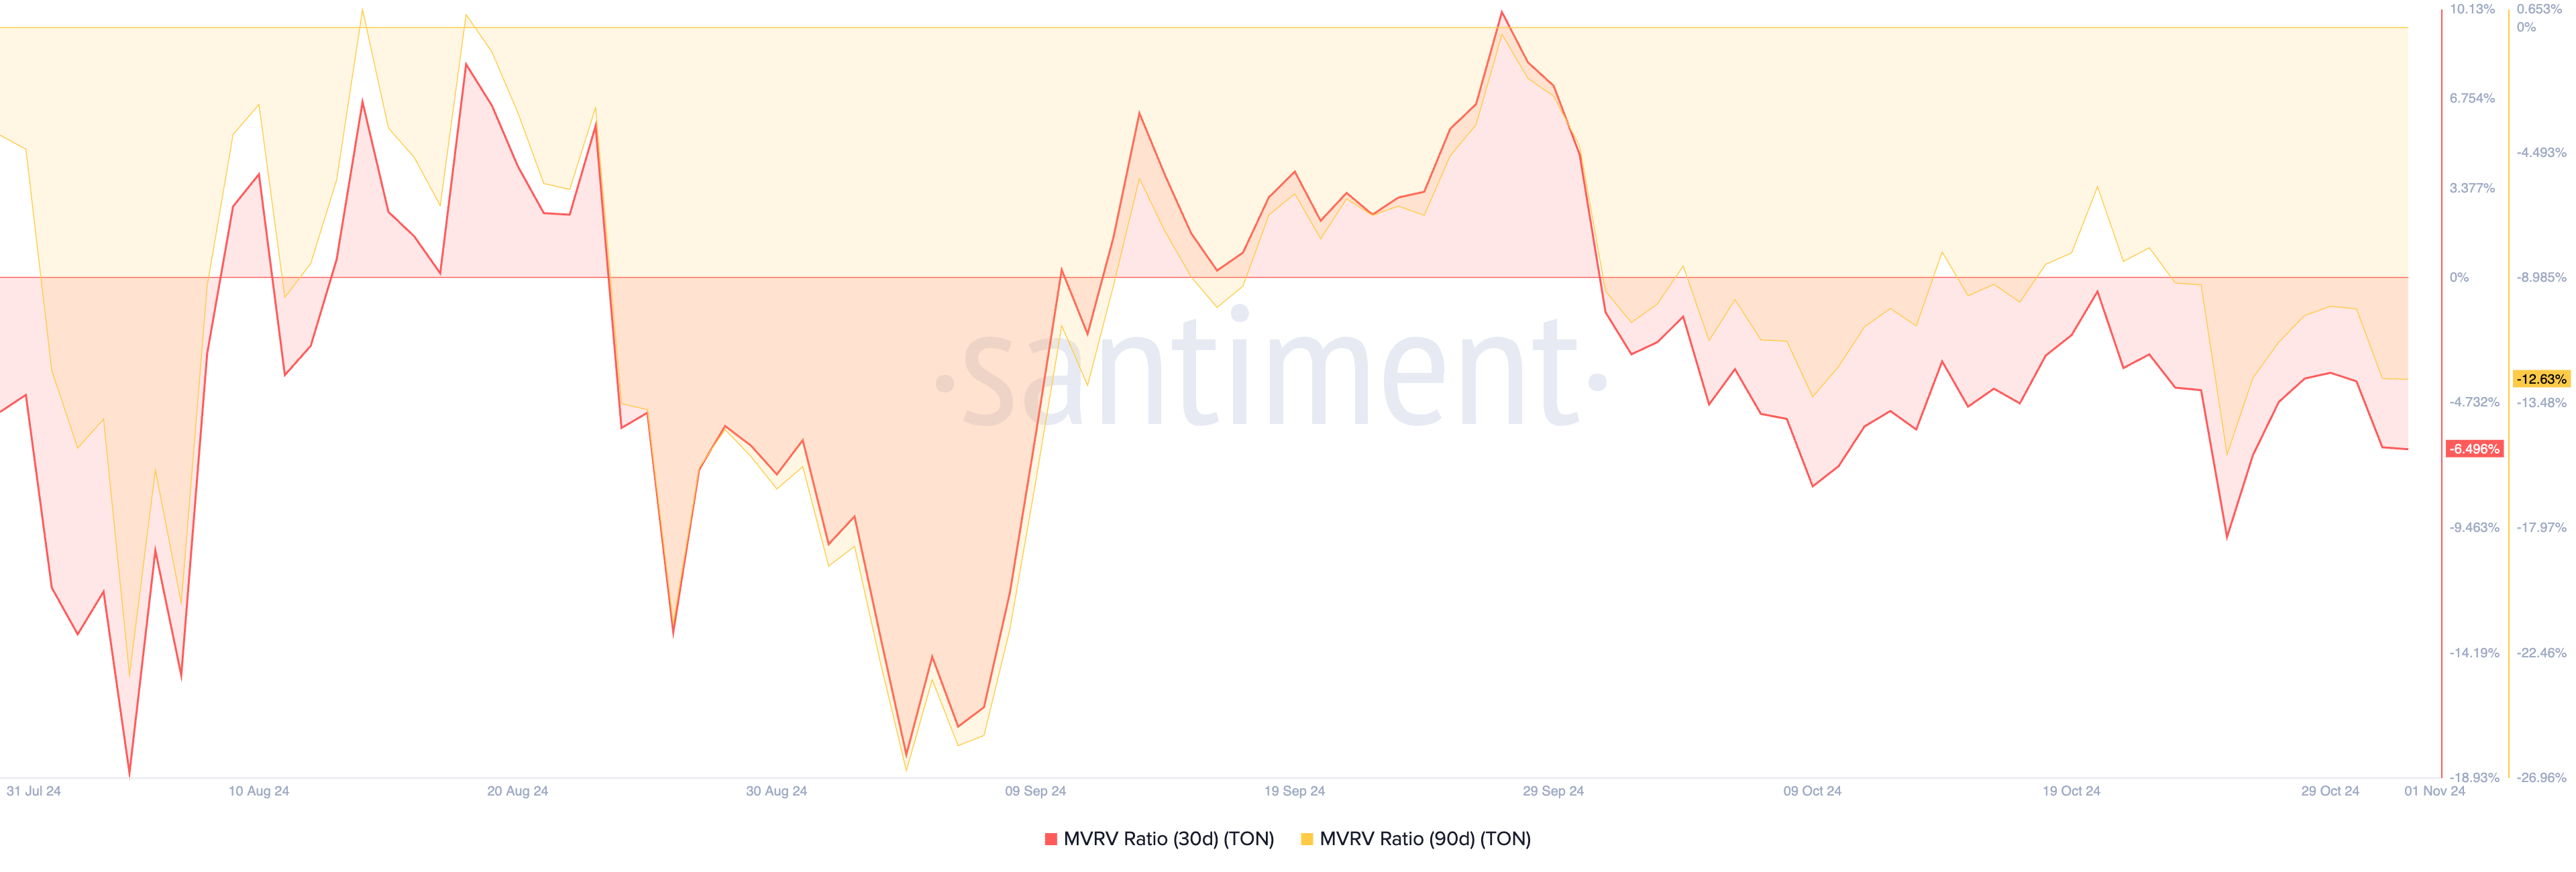
Toncoin’s Market Value to Realized Value (MVRV) ratio, an indicator that measures the overall profitability of its holders, suggests that the altcoin has been undervalued in recent weeks. Currently, its 30-day and 90-day MVRV ratios stand at -6.49% and -12.63%, respectively.
A negative MVRV ratio indicates that an asset is trading below the average acquisition price for most investors. This means that if all holders sold at the current market price, they would incur losses.
Nonetheless, historically, a negative MVRV is a buy signal. It suggests the asset is undervalued, offering a potential buying opportunity for traders aiming to buy low and sell high.
Read more: What Are Telegram Bot Coins?
 Toncoin MVRV Ratio. Source: Santiment
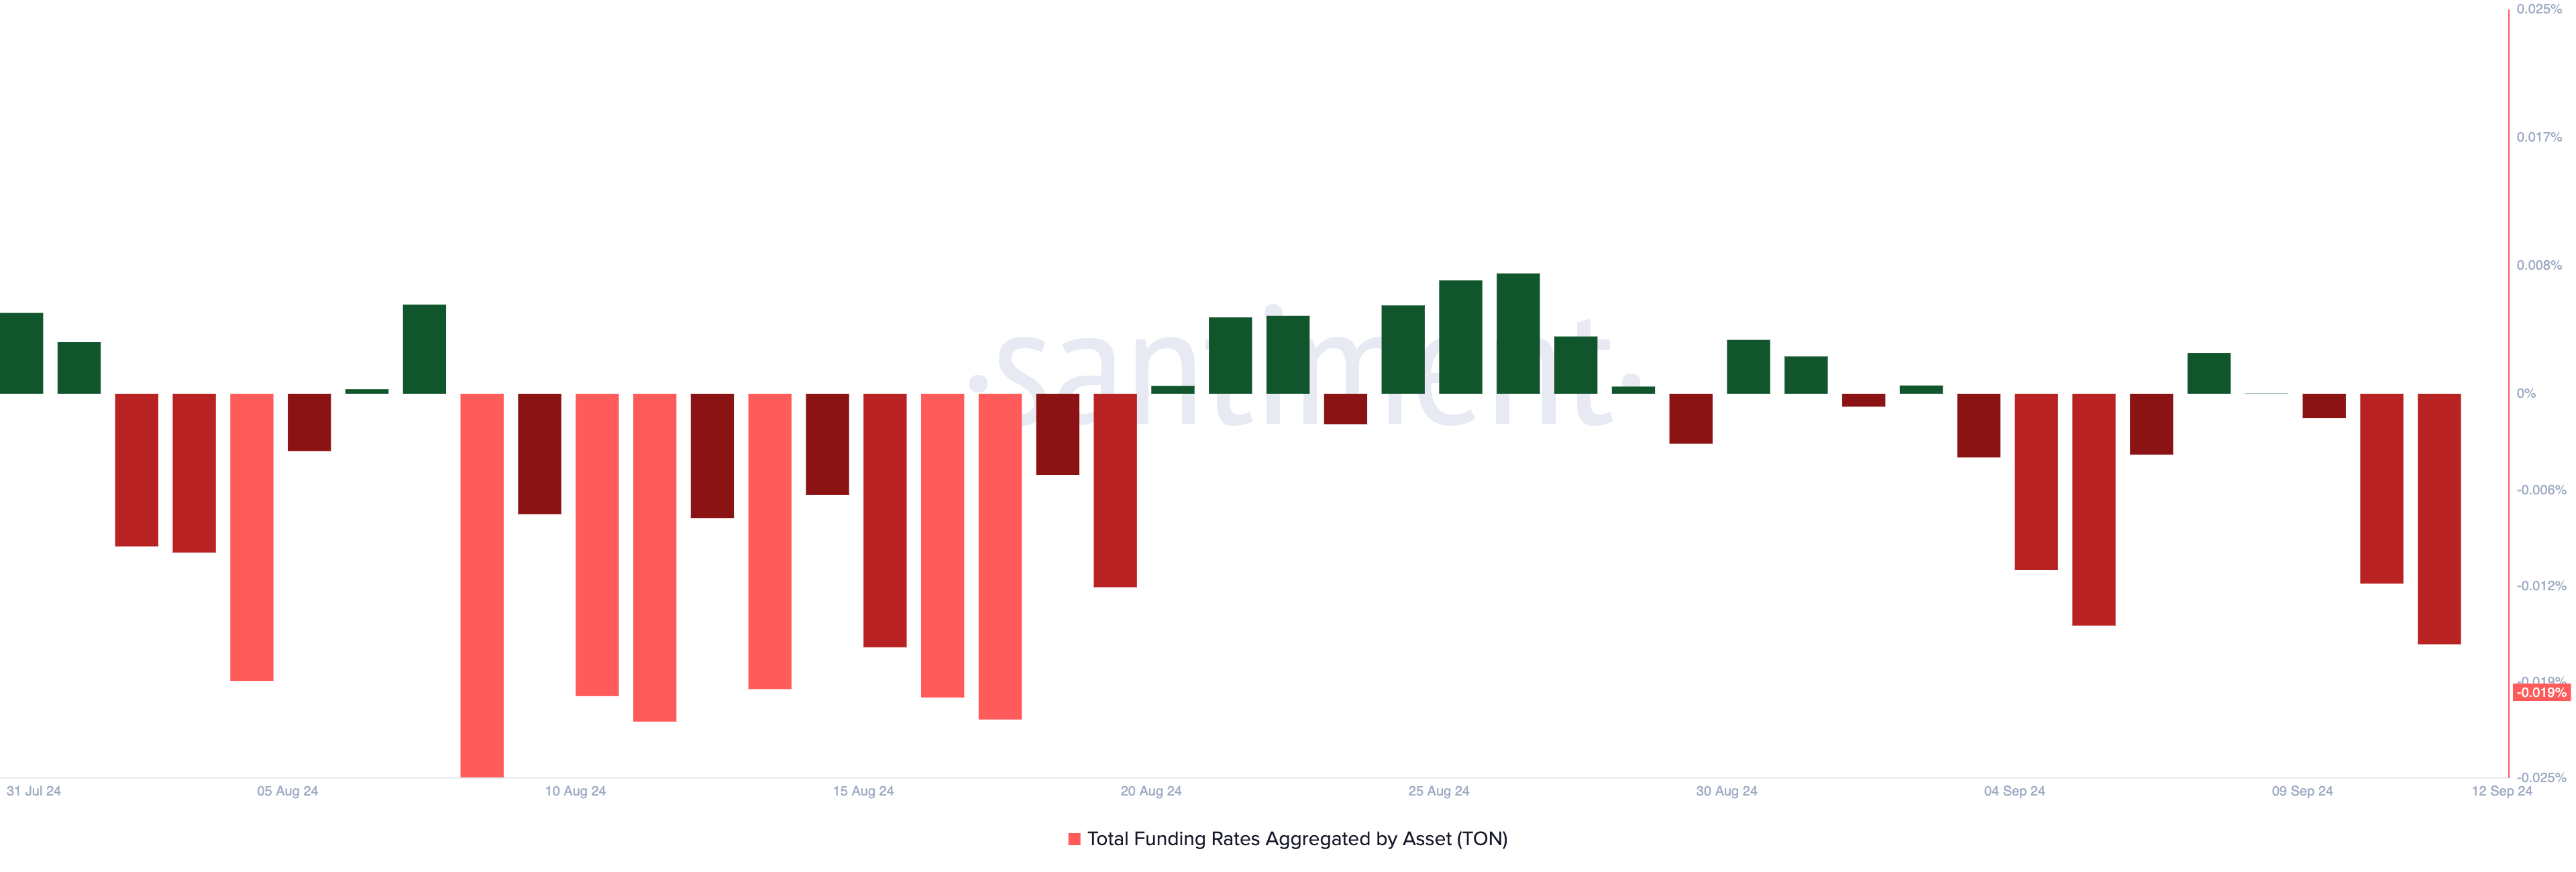
While on-chain metrics suggest a potential buying opportunity for Toncoin, the token remains vulnerable to further declines due to a prevailing bearish bias. This sentiment is reflected by Toncoin’s current funding rate of -0.019%, indicating market sentiment is tilted toward short positions.
The funding rate, a periodic fee between long and short positions in perpetual futures contracts, helps maintain alignment with the underlying asset’s spot price. A negative rate implies that more traders are betting on price drops, signaling bearish momentum in the market.
 Toncoin Funding Rate. Source: Santiment
TON Price Prediction: Token Needs Bullish Support
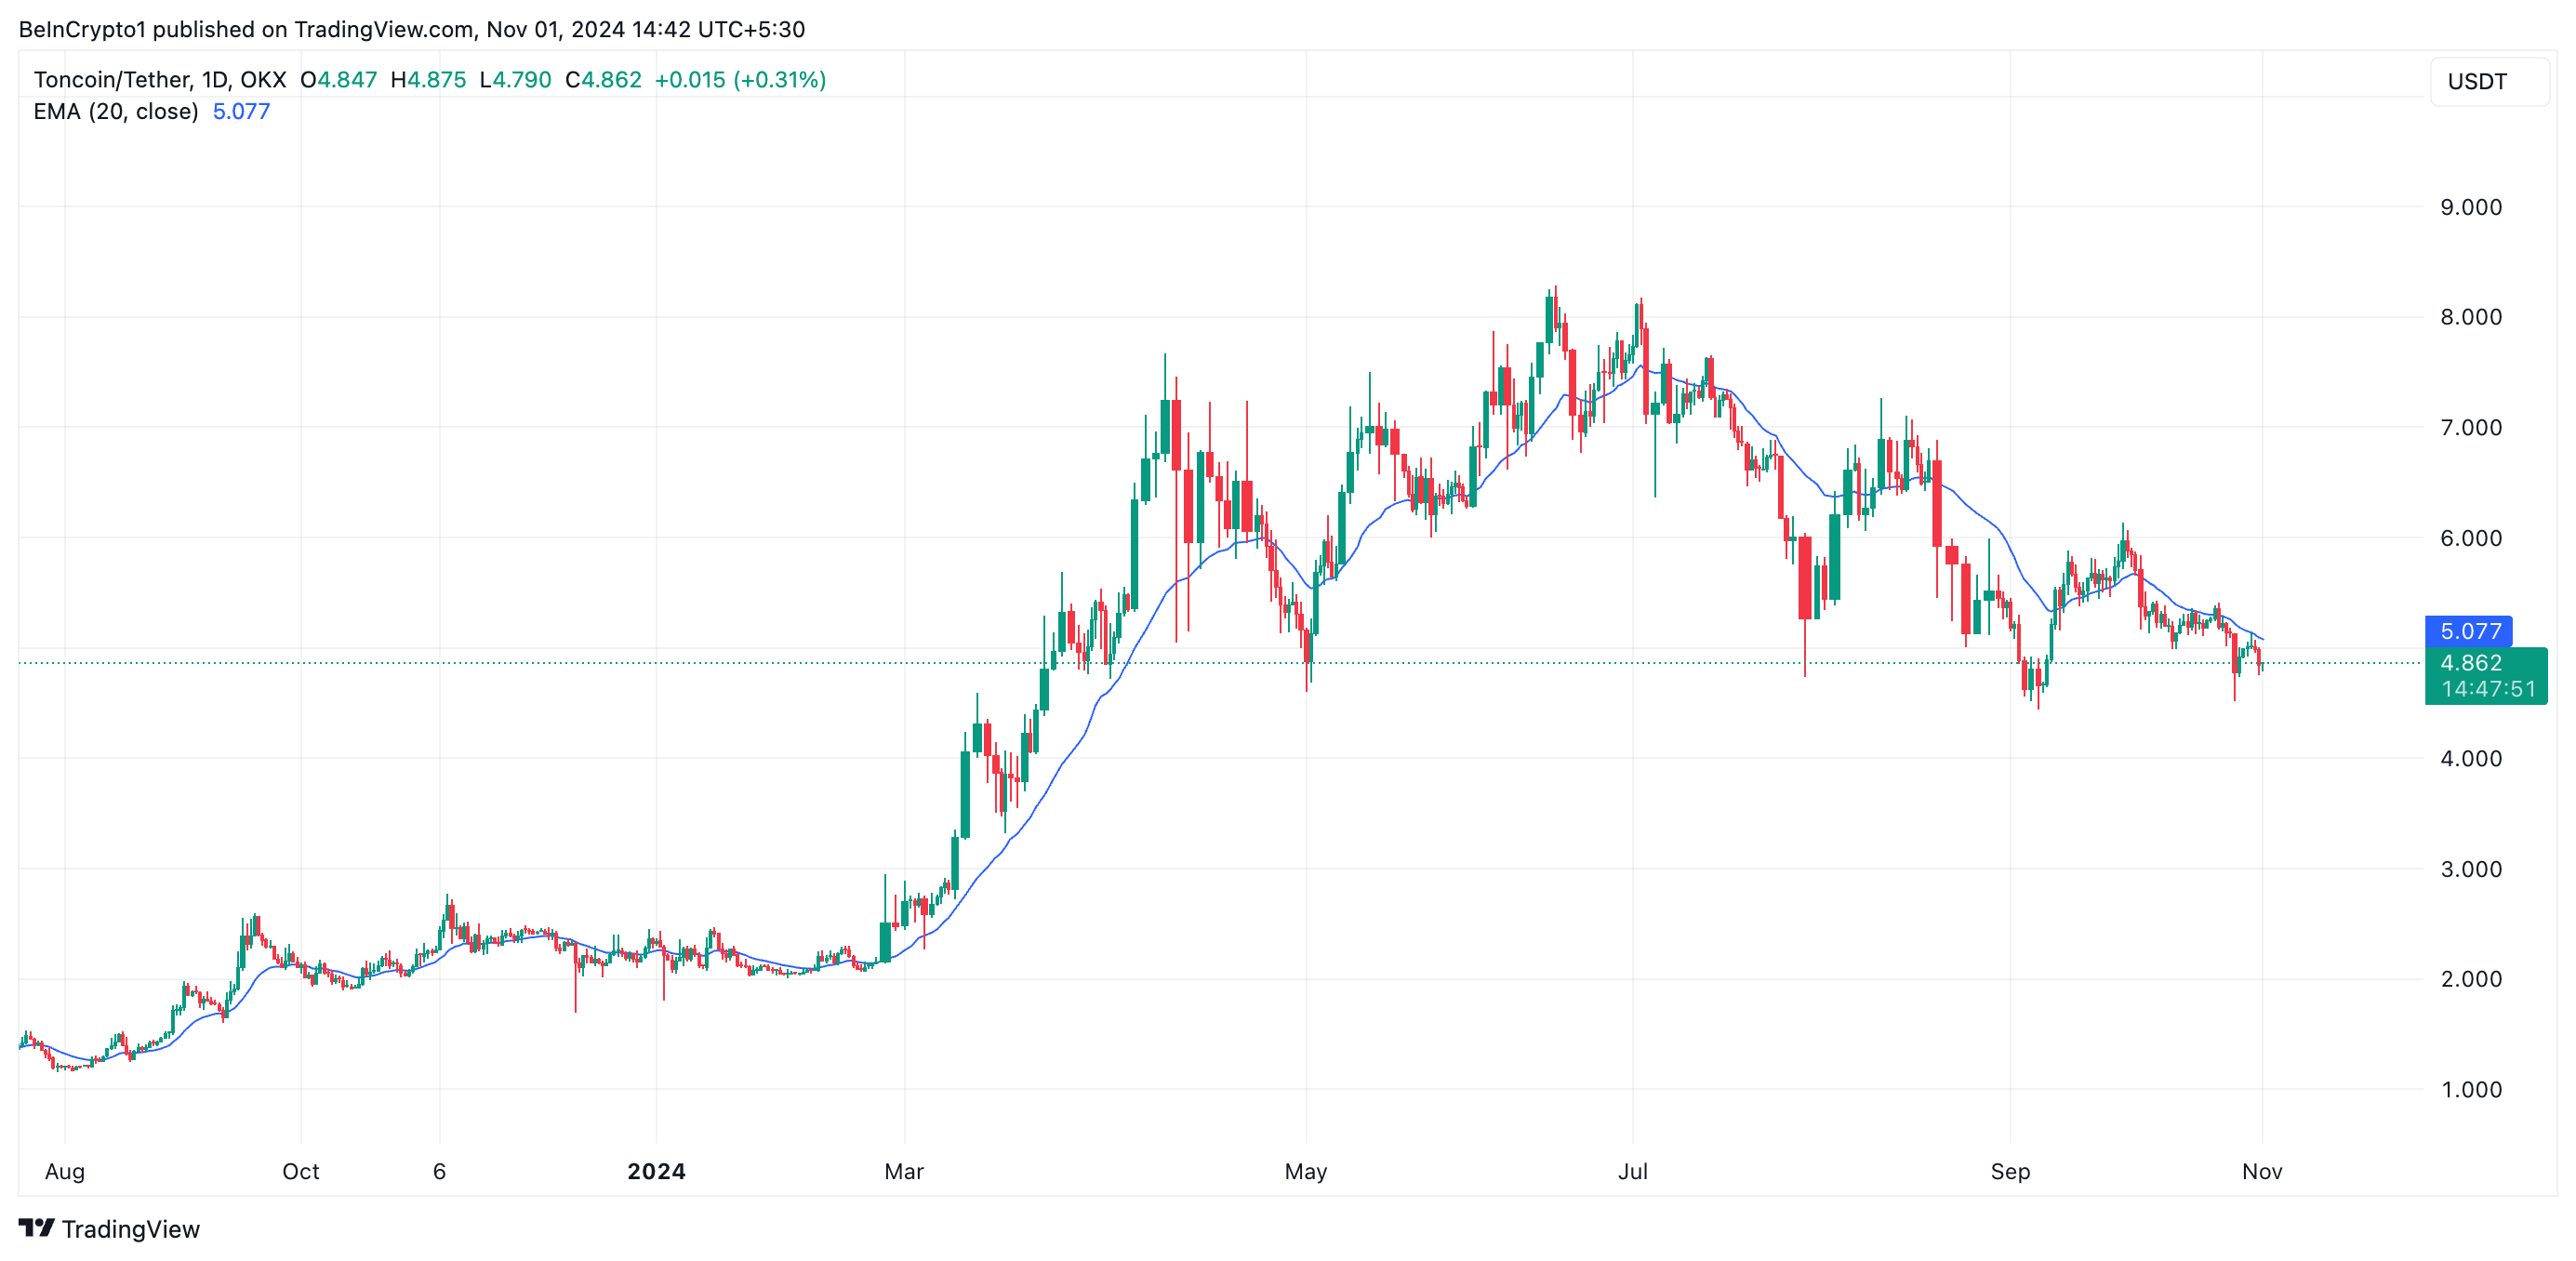
Toncoin’s sustained decline has pushed its price below its 20-day exponential moving average (EMA), which measures its average price over the past 20 trading days.
The 20-day EMA often acts as a support level in an uptrend. This support is considered broken when the price falls below it, suggesting the uptrend may be losing momentum. It also indicates a shift from bullish to bearish sentiment, signaling traders that the asset might experience further declines.
Read more: What Are Telegram Mini Apps? A Guide for Crypto Beginners
 Toncoin 20-Day EMA. Source: TradingView
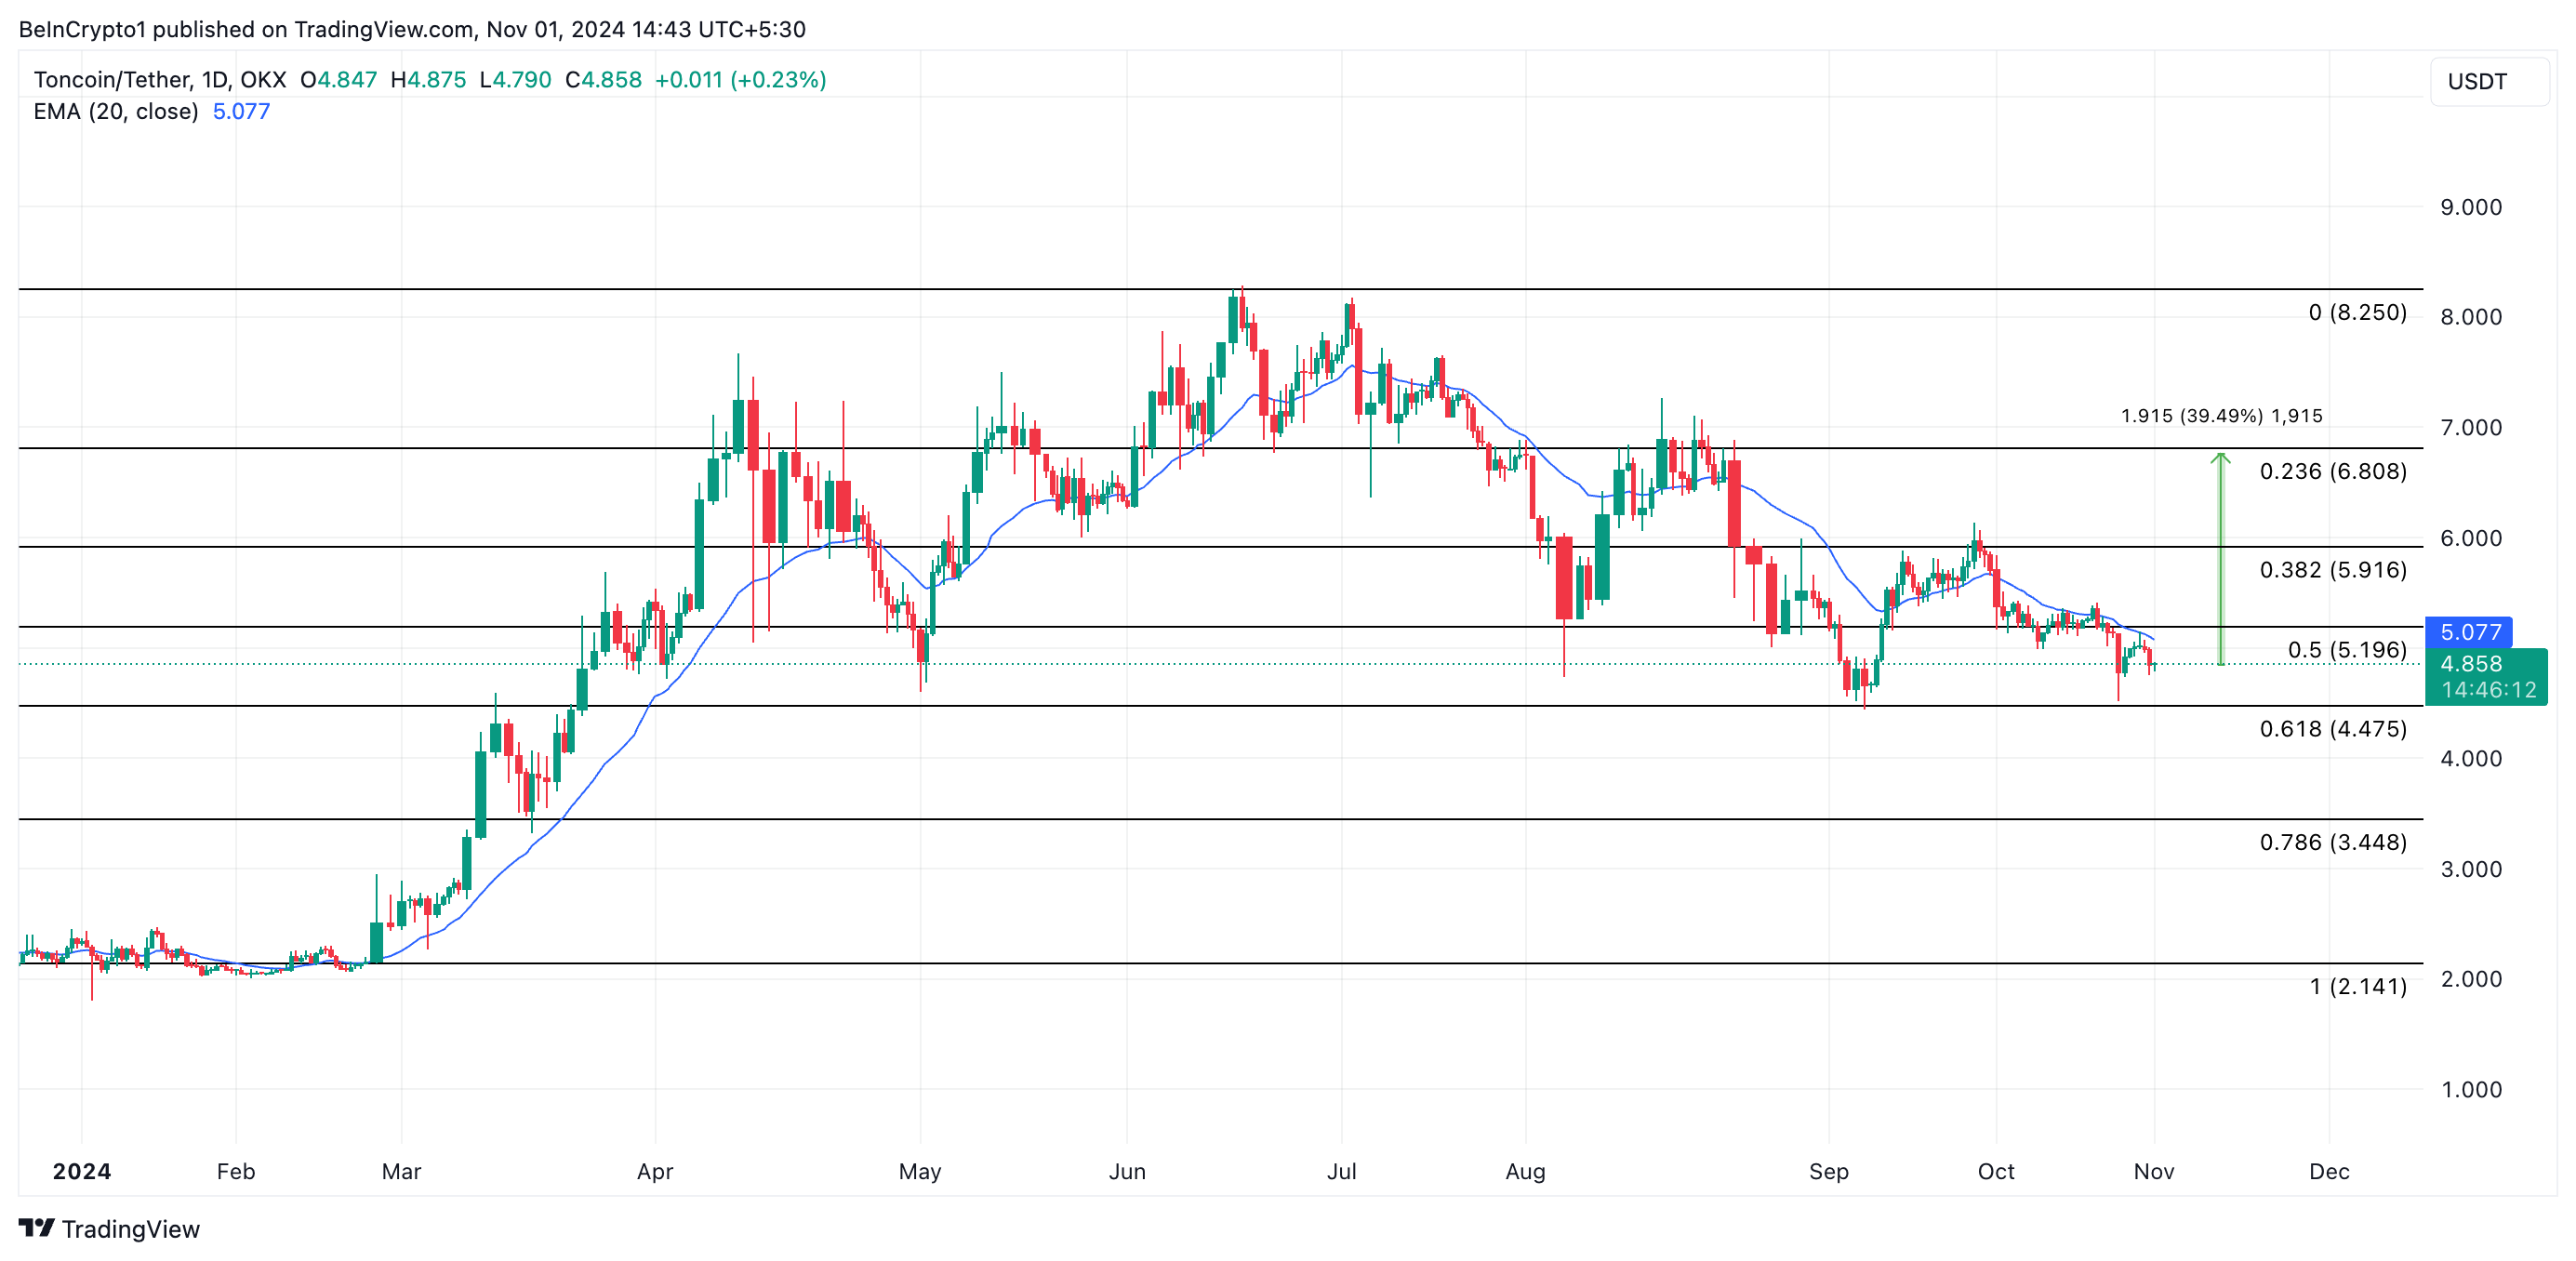
Toncoin trades at $4.85 at press time, just below resistance at $5.19. With selling pressure gaining momentum, the altcoin risks plummeting to $4.47, where major support lies. If this level fails to hold, Toncoin’s price may drop to a multi-month low of $3.44.
 Toncoin Price Analysis. Source: TradingView
However, should market sentiment shift from bearish to bullish and demand for Toncoin increases, the token may attempt to break past the $5.19 resistance. A successful breakout could set it on a path toward $6.80, marking a potential 39% surge from its current price.


