SUI’s Bid to Stabilize Above $2 Hits a Wall as Bulls Retreat
SUI, the native token of the Layer-1 Move-programmed Sui blockchain, is facing heightened selloff pressure. The recent drop has pushed SUI’s price to $1.92, marking a 5% decline in the past 24 hours.
As bullish sentiment fades, SUI’s struggle to maintain support above the $2 level intensifies. This analysis explores the factors contributing to this challenge.
Sui Bulls Begin to Exit Market
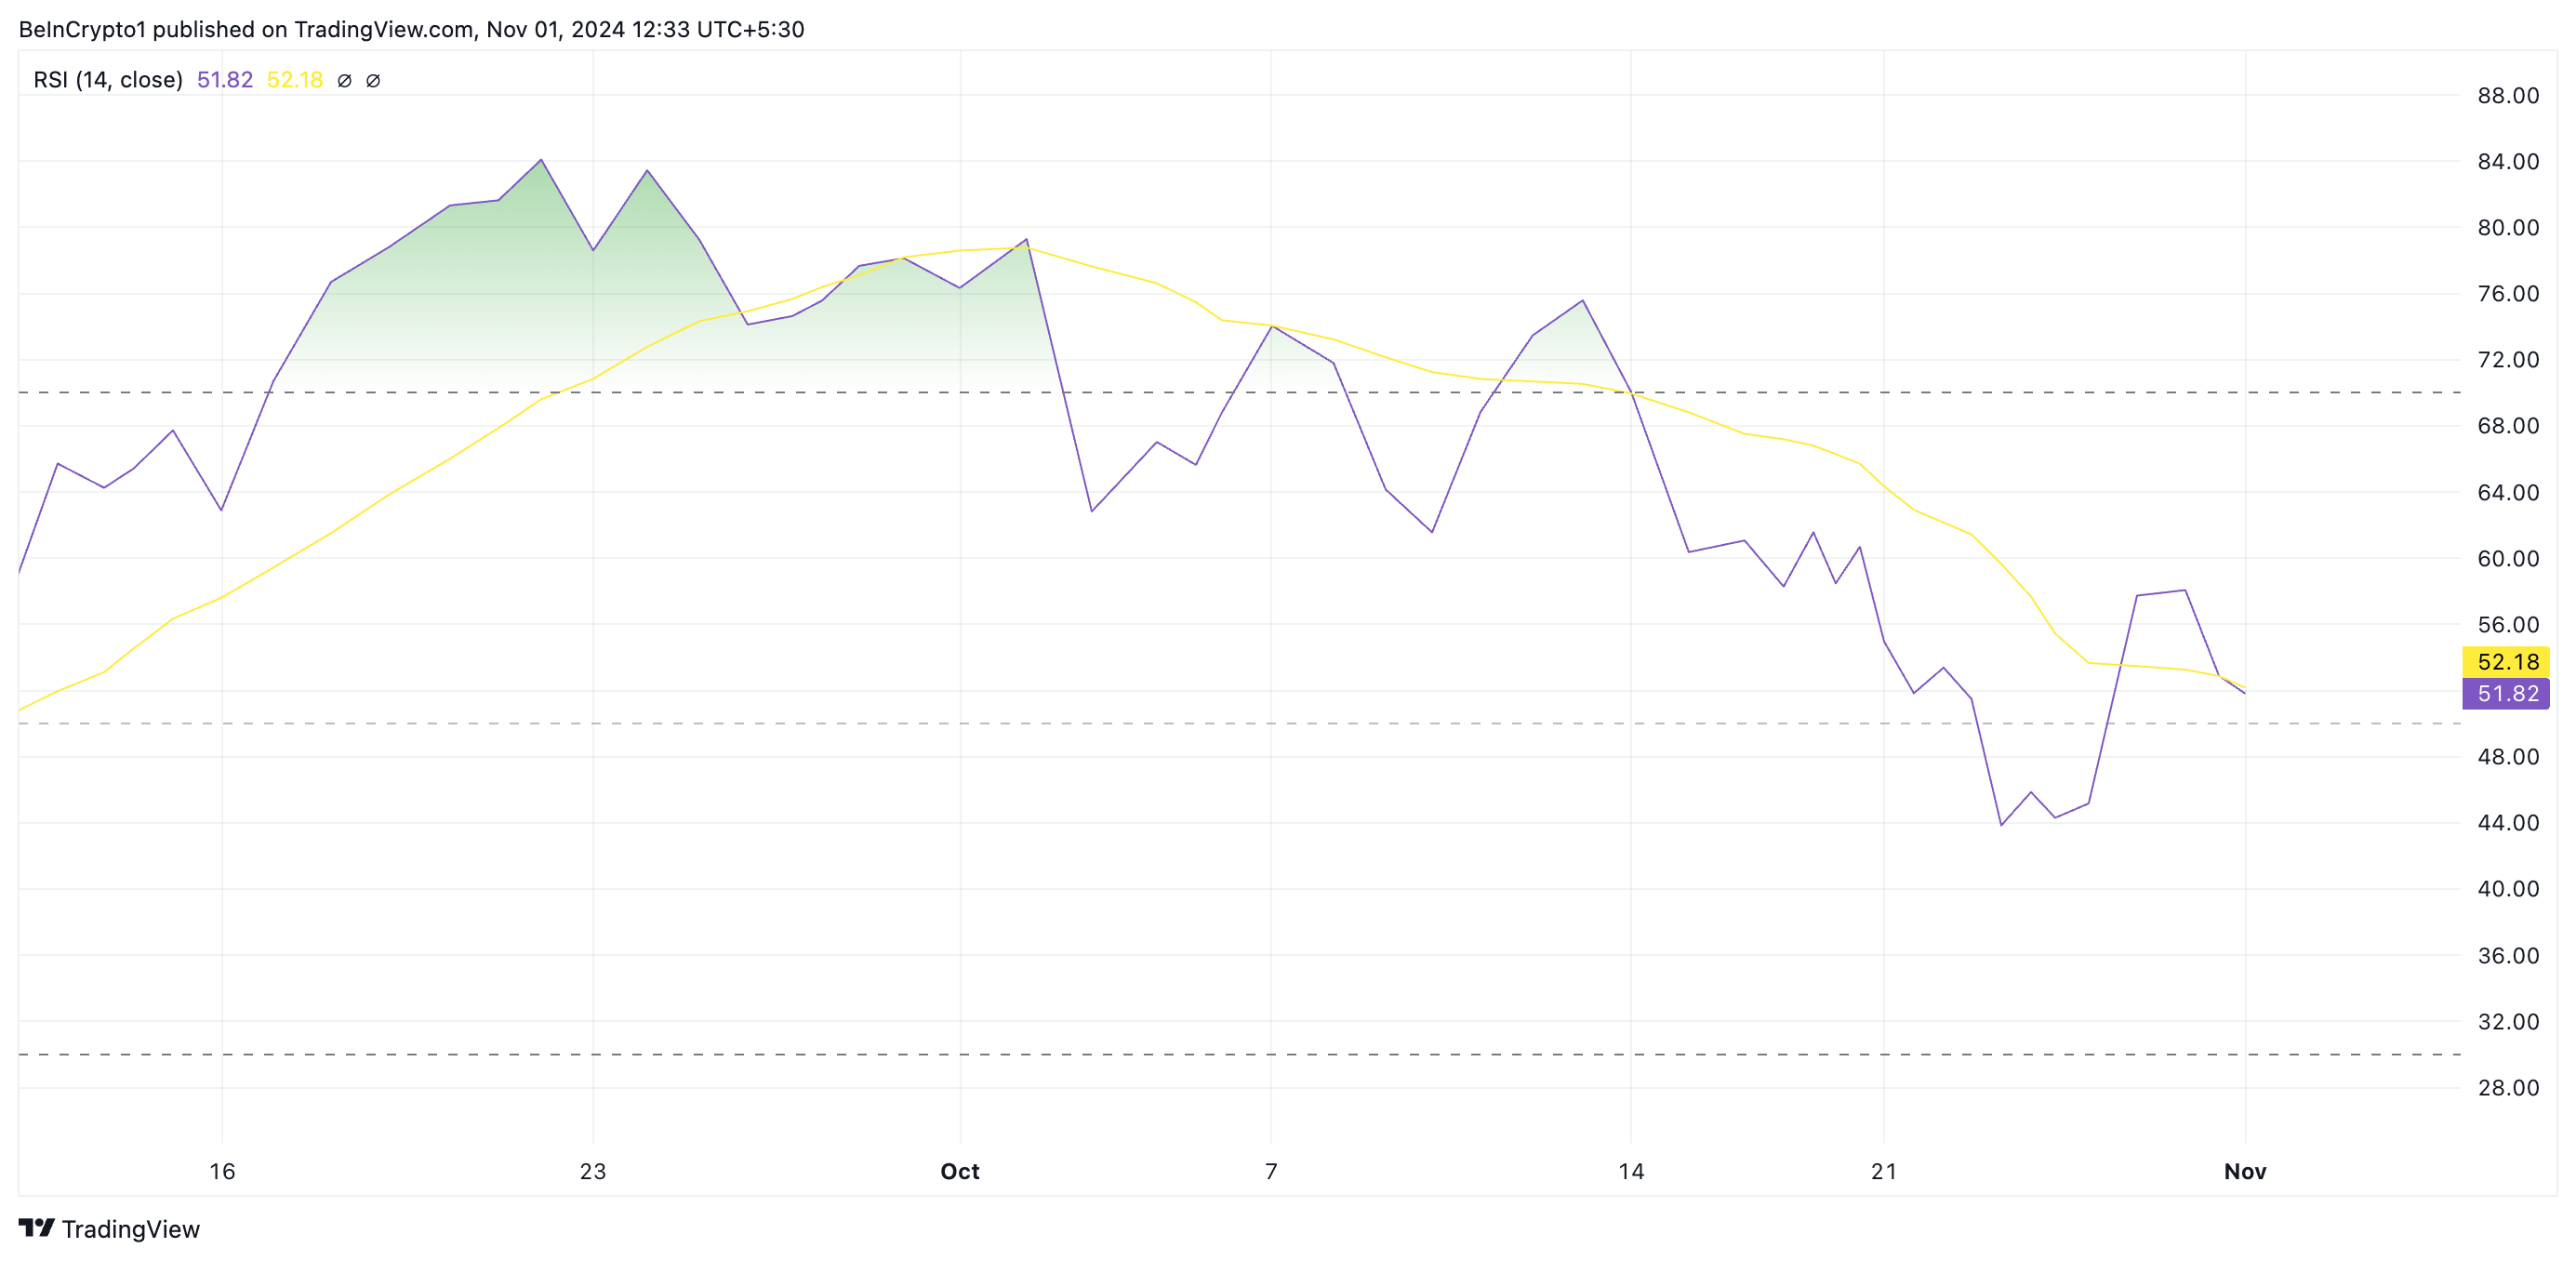
The downward trend of SUI’s Relative Strength Index (RSI) is a notable indicator of the drop in demand for altcoin. As of this writing, this stands at 51.82, poised to breach the 50-neutral line and extend its decline.
The RSI indicator measures an asset’s overbought and oversold market conditions. It ranges from 0 to 100, with values above 70 suggesting that the asset is overbought and due for a pullback. In contrast, values under 39 indicate that the asset is oversold and may witness an upward reversal.
An RSI reading of 51.85, moving toward 50, suggests that market momentum for the asset is shifting toward a more bearish outlook. Traders often interpret this as a signal to prepare for potential declines.
Read more: Everything You Need to Know About the Sui Blockchain
 SUI RSI. Source: TradingView
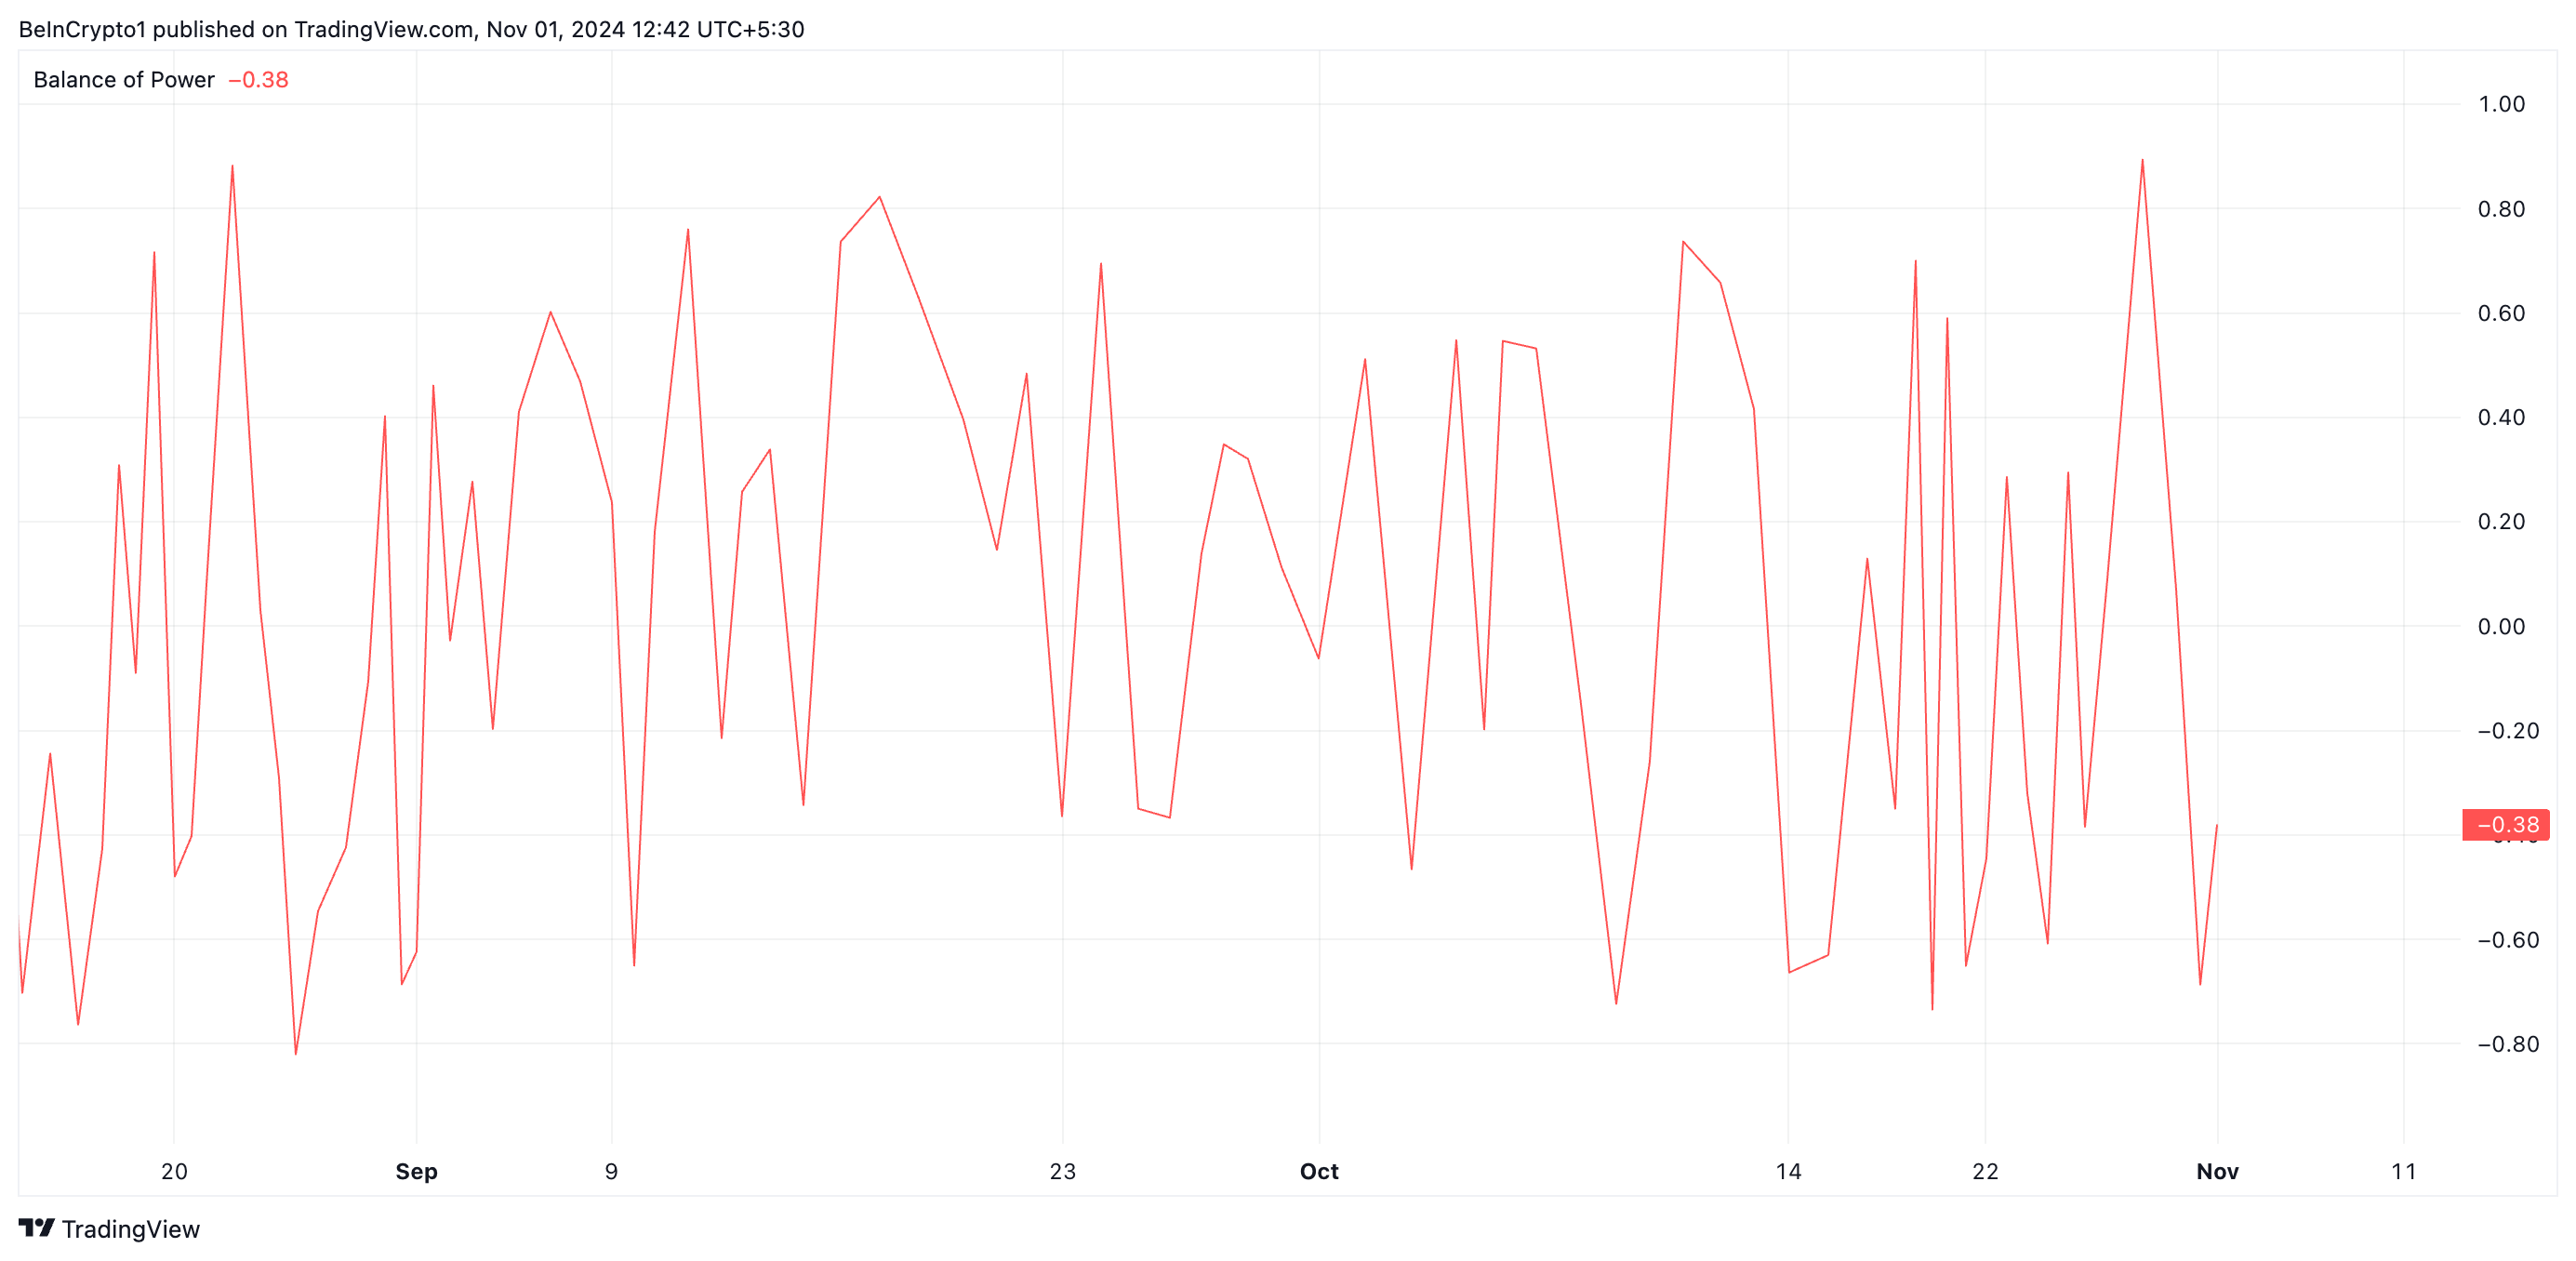
Furthermore, the coin’s plummeting Balance of Power (BoP) supports this bearish outlook. BeInCrypto’s assessment of the SUI/USD one-day chart reveals that this indicator, which measures the strength of buyers versus sellers in the market, has been in decline since October 29.
As of this writing, SUI’s BoP is -0.38. A negative BoP suggests sellers are in control and attempting to extend the SUI price drop.
 SUI BoP. Source: TradingView
SUI Price Prediction: The 20-Day EMA Level Is Critical
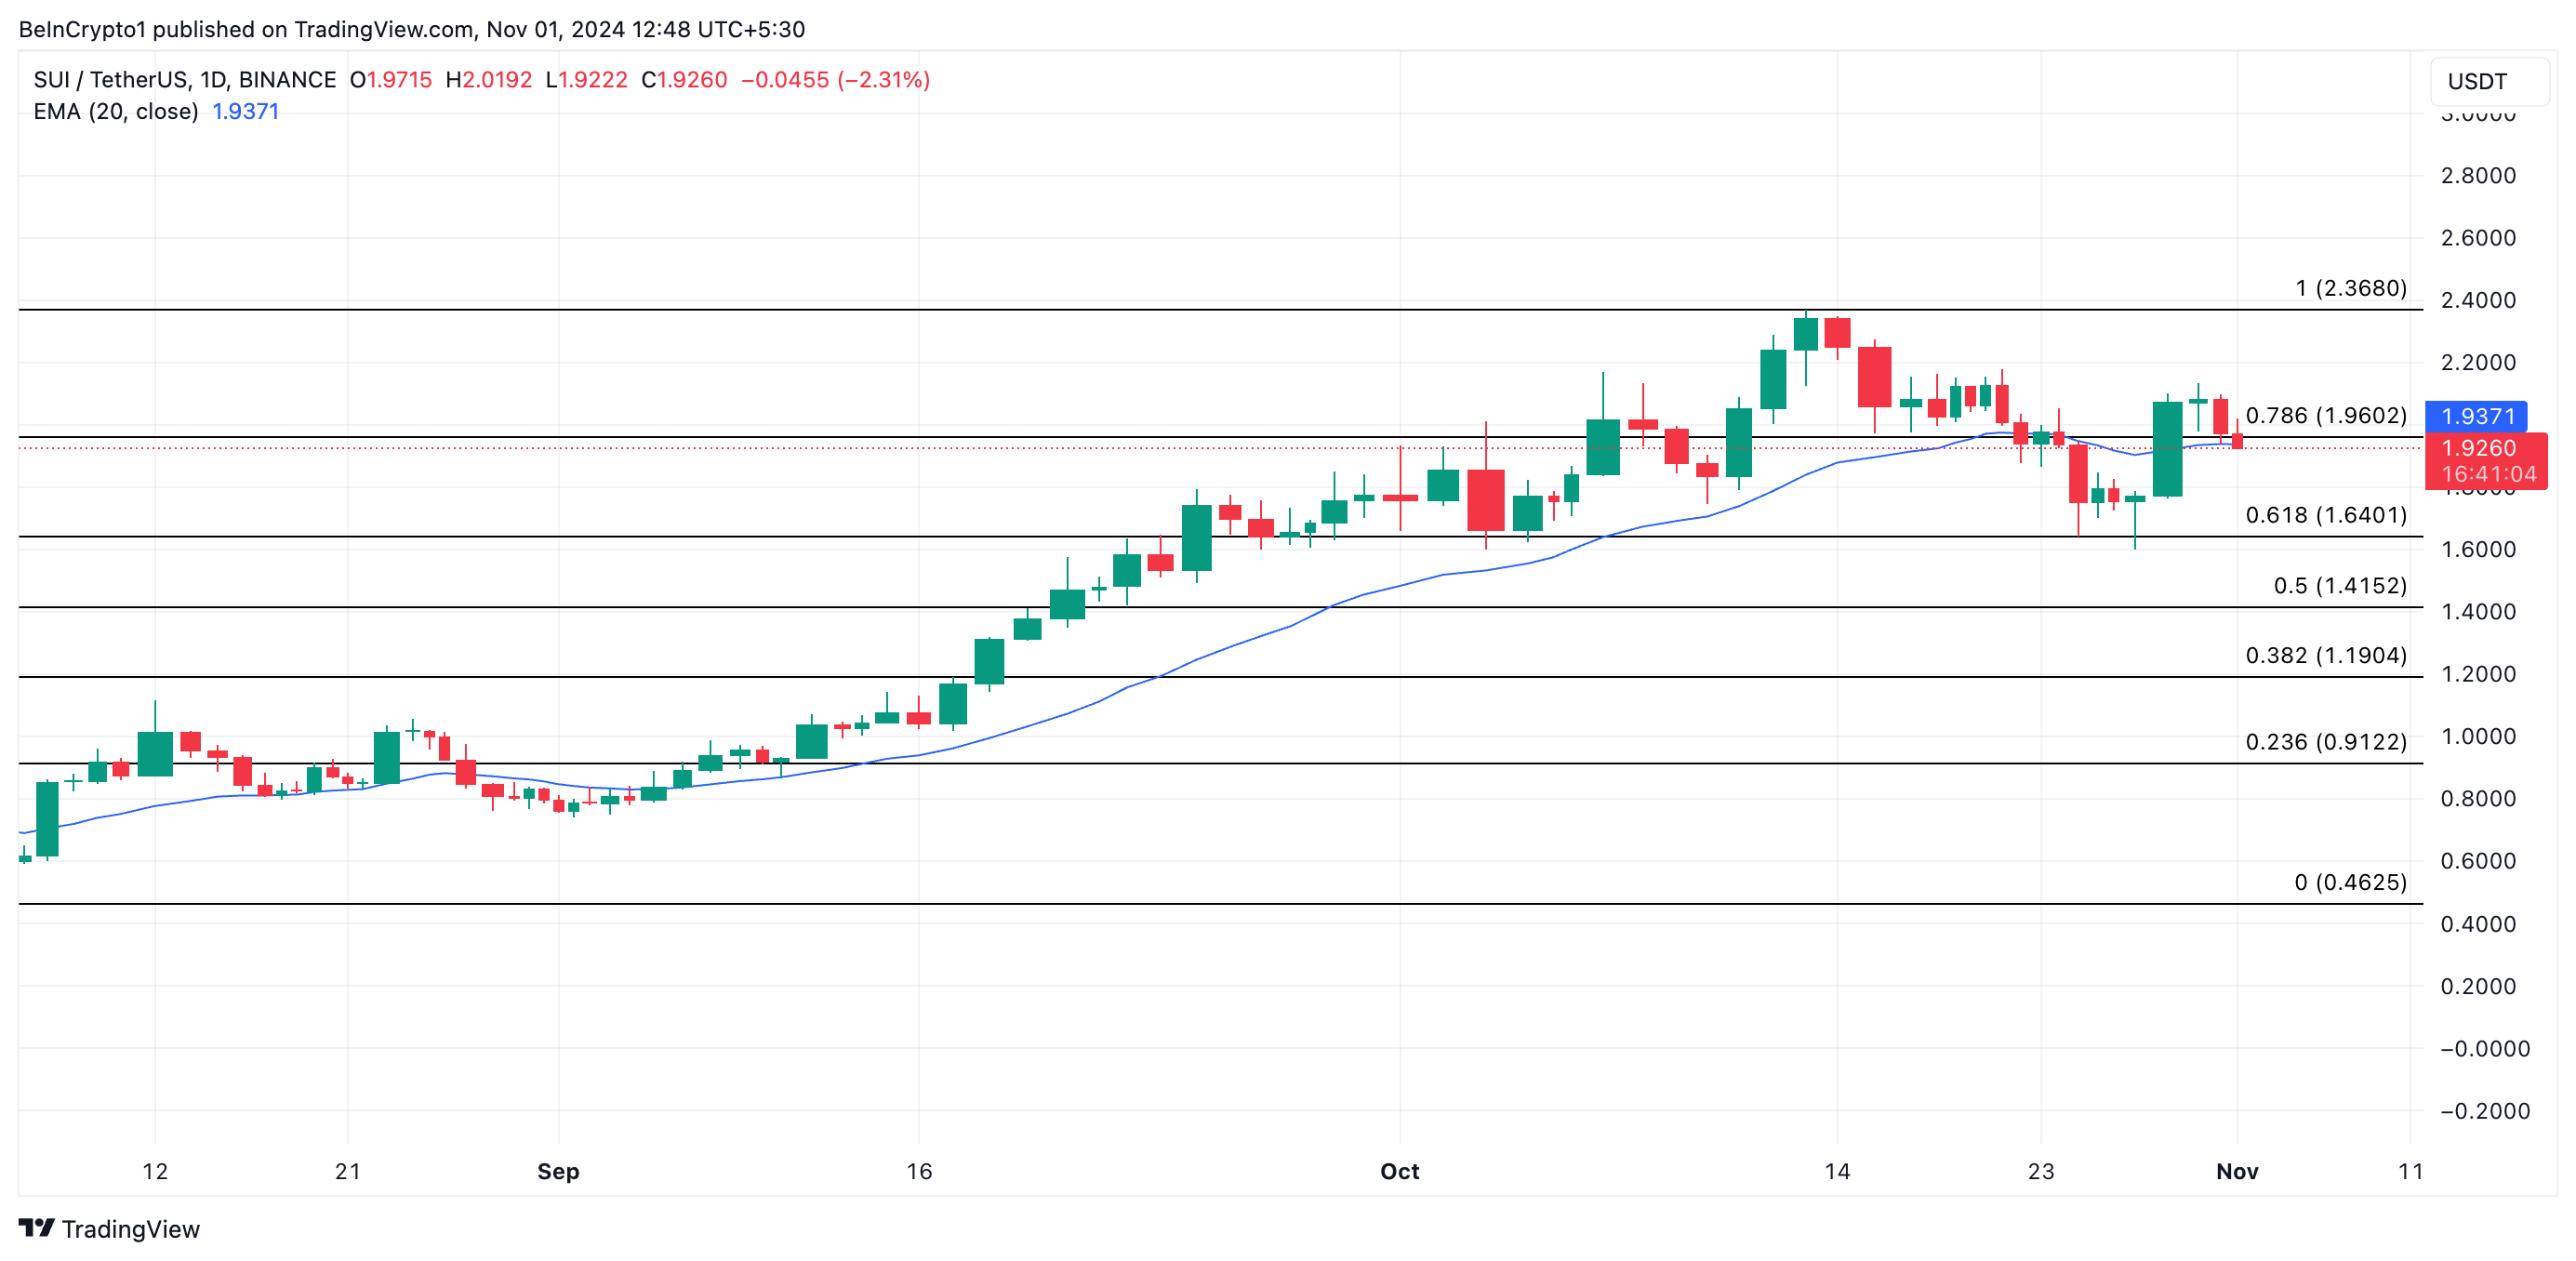
SUI currently trades just above its 20-day exponential moving average (EMA), which provides critical support at $1.94. The 20-day EMA, reflecting the asset’s average price over the past 20 trading days, often signals an uptrend when prices sit above it and serves as a key support level.
However, SUI’s proximity to this level suggests that support could be weakening. A decisive break below the 20-day EMA would signal short-term bearish momentum, indicating that the uptrend has lost strength.
Read more: A Guide to the 10 Best Sui (SUI) Wallets in 2024
 SUI Price Analysis. Source: TradingView
If SUI bulls fail to maintain this support, the price may fall to $1.64, with further declines potentially driving it down to $0.91. Conversely, if $1.94 holds, it could propel SUI toward reclaiming its all-time high of $2.36.


