Cardano (ADA) Hits $2.77 Billion Barrier, Dimming Rebound Prospects
Despite multiple breakout attempts, Cardano’s (ADA) prospects for a significant rebound have been dealt a huge blow. The development comes due to the indications shown by several Cardano on-chain metrics as the altcoin hovers between $0.34 and $0.36.
While ADA holders may be hoping for some relief, this on-chain analysis suggests that investors might need to lower their expectations. Here’s why.
Cardano Faces Significant Resistance
One of the key Cardano on-chain metrics suggesting a potential pullback is the In/Out of Money Around Price (IOMAP). The IOMAP categorizes addresses based on whether their on-chain cost basis is below the current value of ADA.
This metric provides insights into addresses holding tokens purchased at higher values, those at breakeven, and helps identify support and resistance zones—where larger clusters indicate stronger support or resistance.
According to BeInCrypto, over 260,000 Cardano addresses acquired 6.68 billion ADA within the $0.34 to $0.36 range. At an average price of $0.34, these holdings are worth around $2.77 billion, making them more substantial than addresses currently in profit.
Read more: How to Buy Cardano (ADA) and Everything You Need to Know
 Cardano IOMAP. Source: IntoTheBlock
Given this position, Cardano’s price might struggle to break through this range. This is because holders currently “out of the money” might seek to break even, potentially keeping ADA’s price below its current level.
Beyond this, short-term holders are another reason the price might drop, as these Cardano on-chain metrics show.
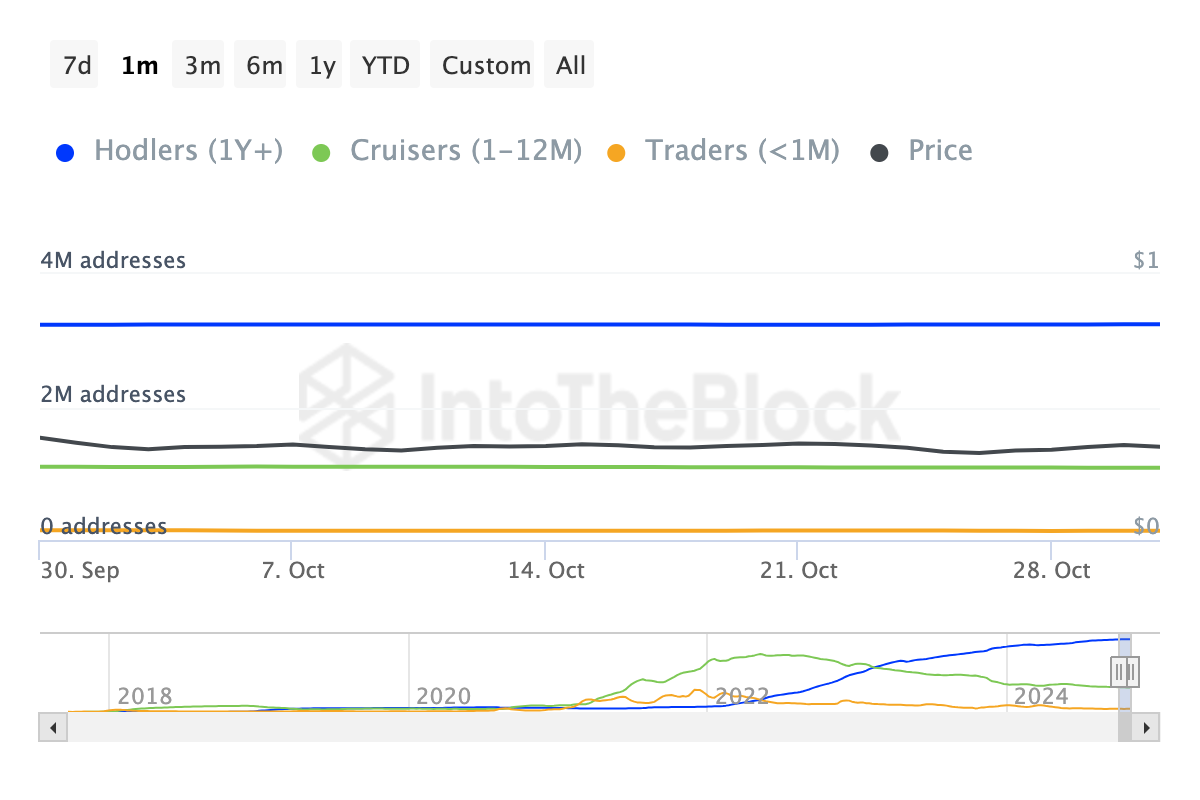
Specifically, the Balance by Time Held metric, which indicates how long investors have held a token, reveals that those who acquired ADA within the last 30 days to 12 months have been selling. If this trend continues, ADA’s price could face significant downward pressure.
 Cardano Balance By Time Held. Source: IntoTheBlock
ADA Price Prediction: No Gains Yet
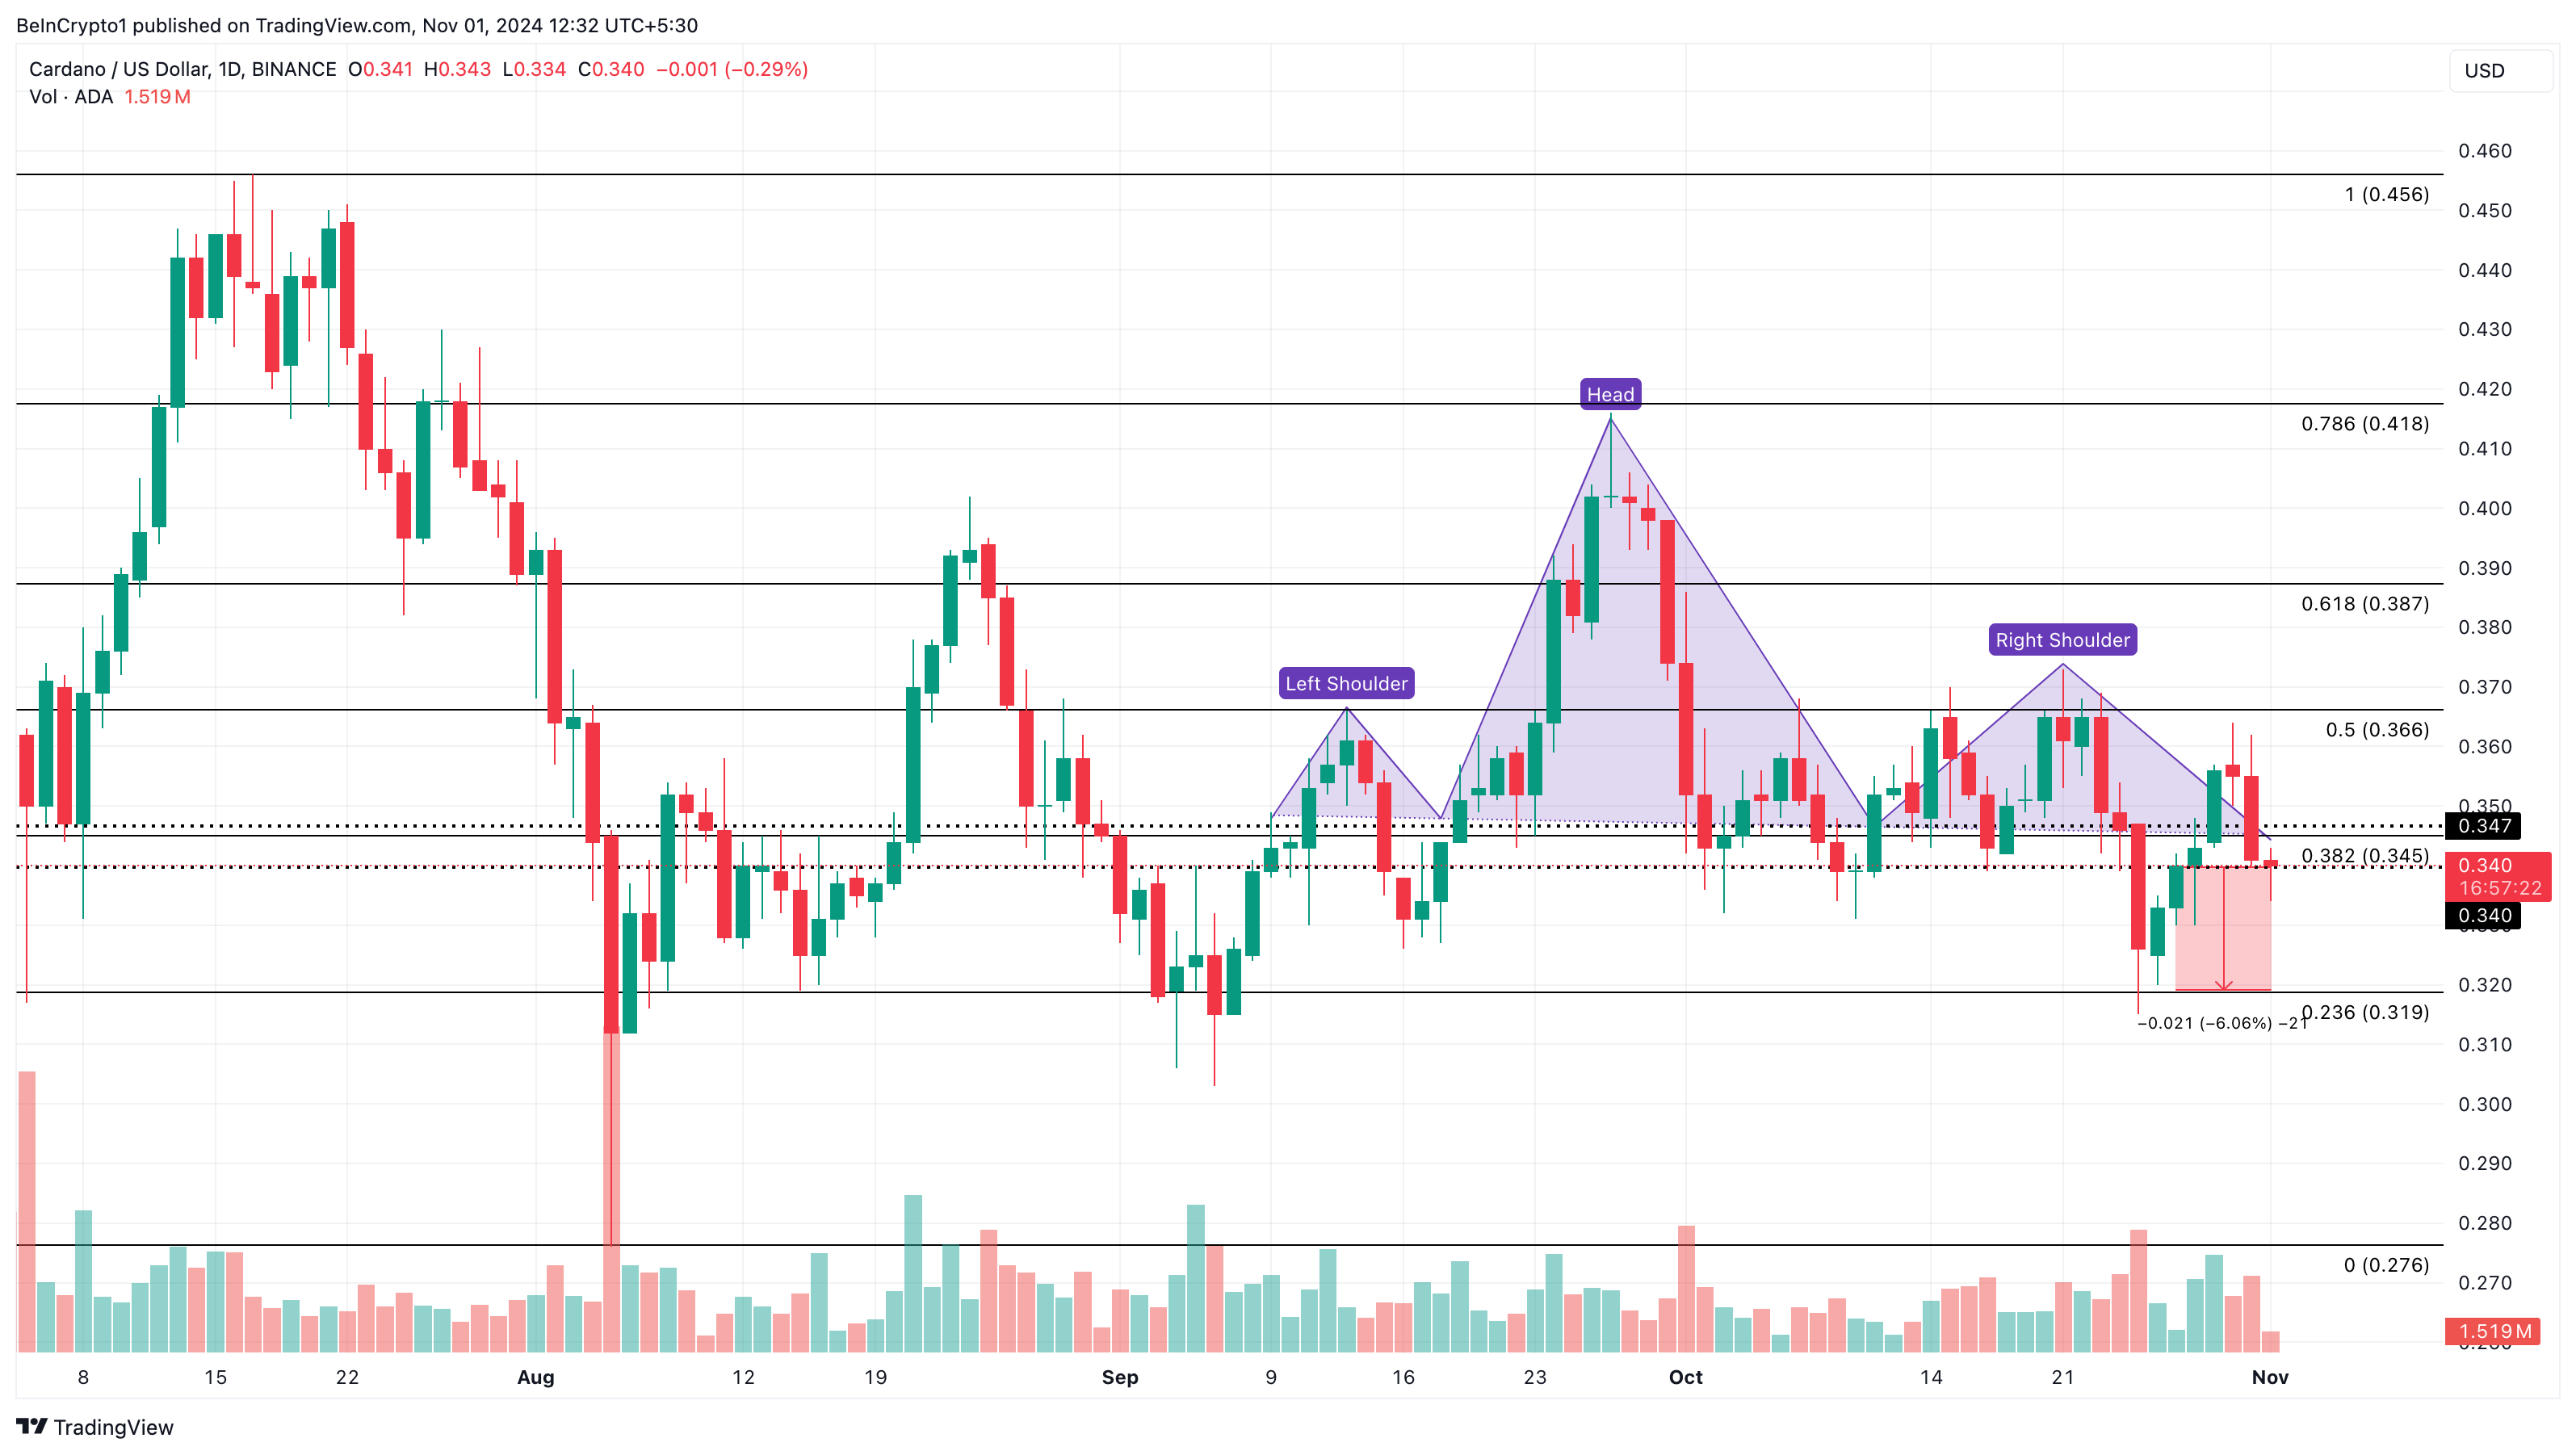
On the daily chart, ADA has formed a head-and-shoulders pattern. This pattern indicates a reversal from bullish to bearish, signaling that an upward trend may be approaching its end.
Confirmation of the bearish pattern occurs when the crypto involved breaks below the neckline. As seen below, the neckline of the pattern is around $0.34, and ADA has dropped below the region. Should this remain the same, then ADA’s price might decline by another 6%, possibly taking it down to $0.32.
Read more: Cardano (ADA) Price Prediction 2024/2025/2030
 Cardano Daily Analysis. Source: TradingView
On the other hand, Cardano’s value might rebound if bulls defend the $0.34 support and demand for future purchases is higher than the $2 billion resistance. If that happens, then ADA might jump to $0.42.


