Top 3 meme coins Dogecoin, Shiba Inu and PEPE hold recent gains after Bitcoin’s flirt with fresh all-time high
- Bitcoin inched closer to testing its all-time high on Tuesday, reaching $73,620.
- Dogecoin, Shiba Inu and PEPE rallied alongside the largest crypto, correcting in the early hours of Wednesday.
- DOGE, SHIB and PEPE active addresses spike alongside the price gains on Tuesday.
- Dogecoin and Shiba Inu's social dominance increases while Pepe lags behind.
Dogecoin (DOGE), Shiba Inu (SHIB) and PEPE correct slightly on Wednesday after extending their gains alongside Bitcoin on Tuesday, when the king crypto marched within a touching distance to its all-time high of $73,777. The top three meme coins corrected alongside Bitcoin, and on-chain metrics show a massive spike in activity in DOGE, SHIB and PEPE prior to the price decline.
Meme coins track Bitcoin’s attempt to reach new all-time high
DOGE, SHIB and PEPE gained alongside the largest cryptocurrency on Tuesday, but The three tokens’ price corrected on Wednesday. Two key on-chain metrics, active addresses (24-hours) and social dominance, show a rise in activity alongside the price gain on Tuesday.
 [13.08.02, 30 Oct, 2024]-638658819589379750.png)
Active addresses (24-hour) Dogecoin, Shiba Inu and PEPE. Source: Santiment
The social dominance metric, which measures the percentage of discussions that includes the token on platforms like X, Telegram and other social media, shows a steep increase in DOGE and a relatively moderate increase in SHIB’s dominance. PEPE’s dominance is higher today, unlike the two other tokens that noted a decrease in dominance on Wednesday.
 [13.28.00, 30 Oct, 2024]-638658819832748414.png)
Social dominance for DOGE, SHIB and PEPE
Technical analysis: DOGE, SHIB and PEPE
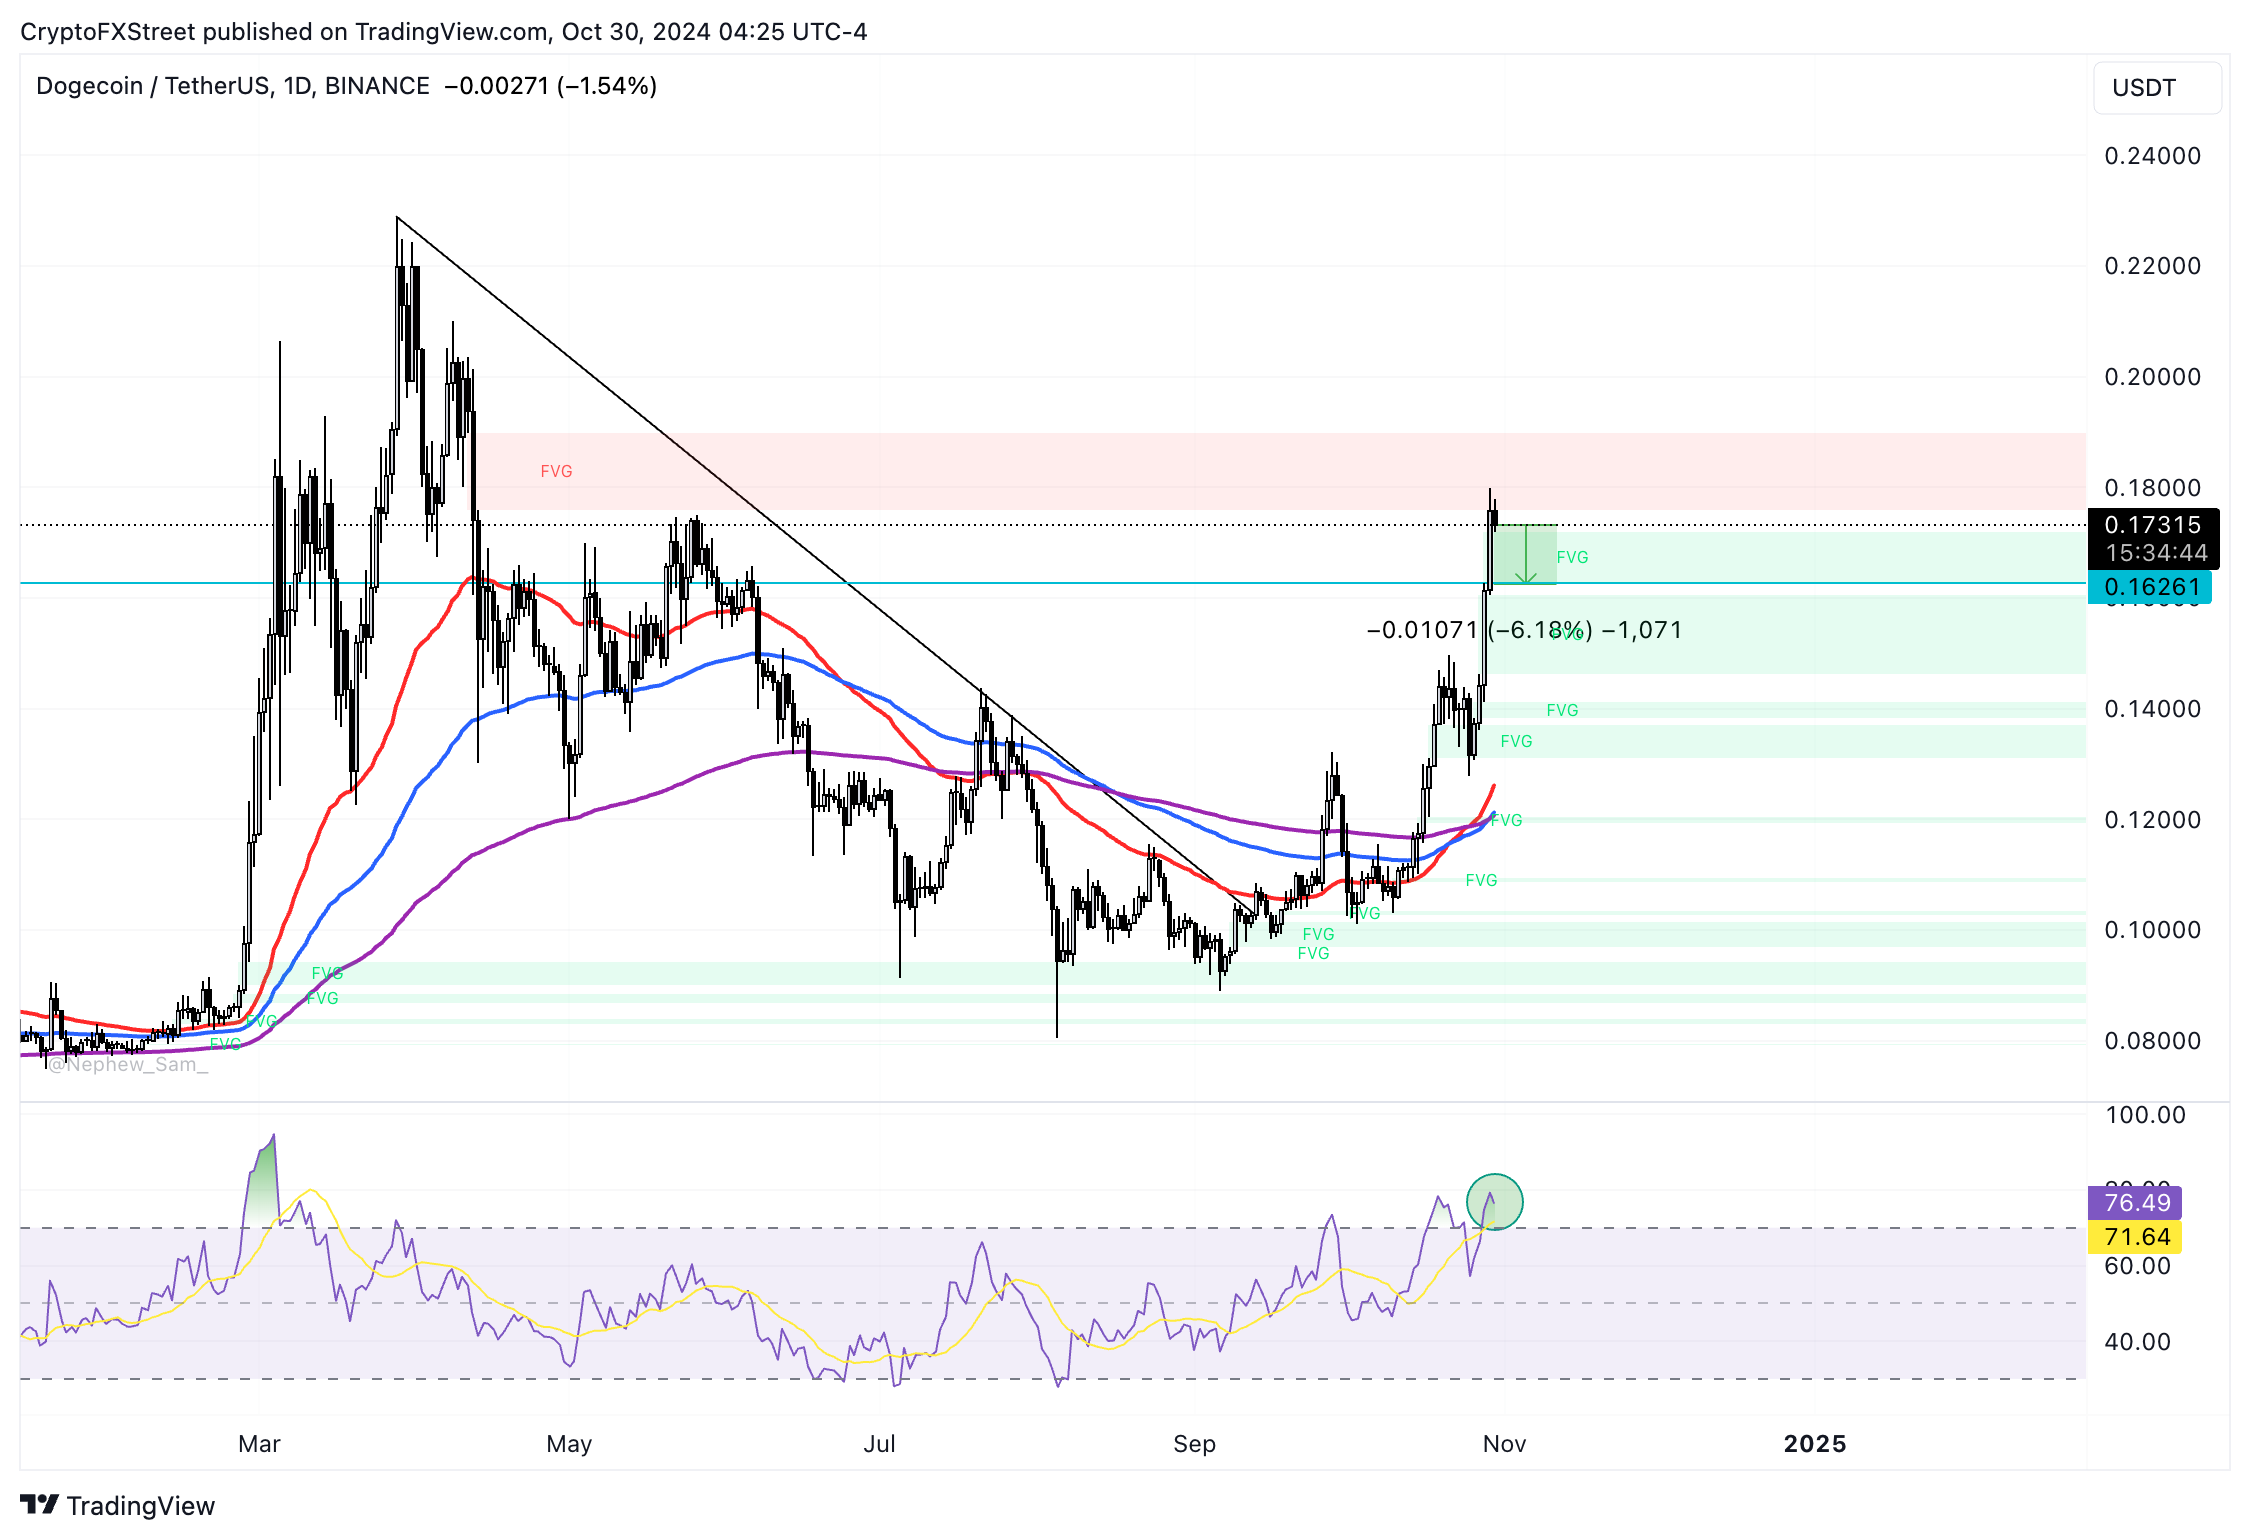
Dogecoin price falls by around 2.7% on Wednesday, breaking a streak of four consecutive days of gains.
The Relative Strength Index (RSI) momentum indicator reads 71, in the overbought zone and pointing downwards. The current overbought status suggests that traders shouldn’t add to their long positions, while an exit from the area would provide a sell signal as the chances of a deeper pullback would increase.
In case of a decline, DOGE could sweep liquidity at the lower boundary of a Fair Value Gap (FVG) at $0.16261, a key support level.

DOGE/USDT daily chart
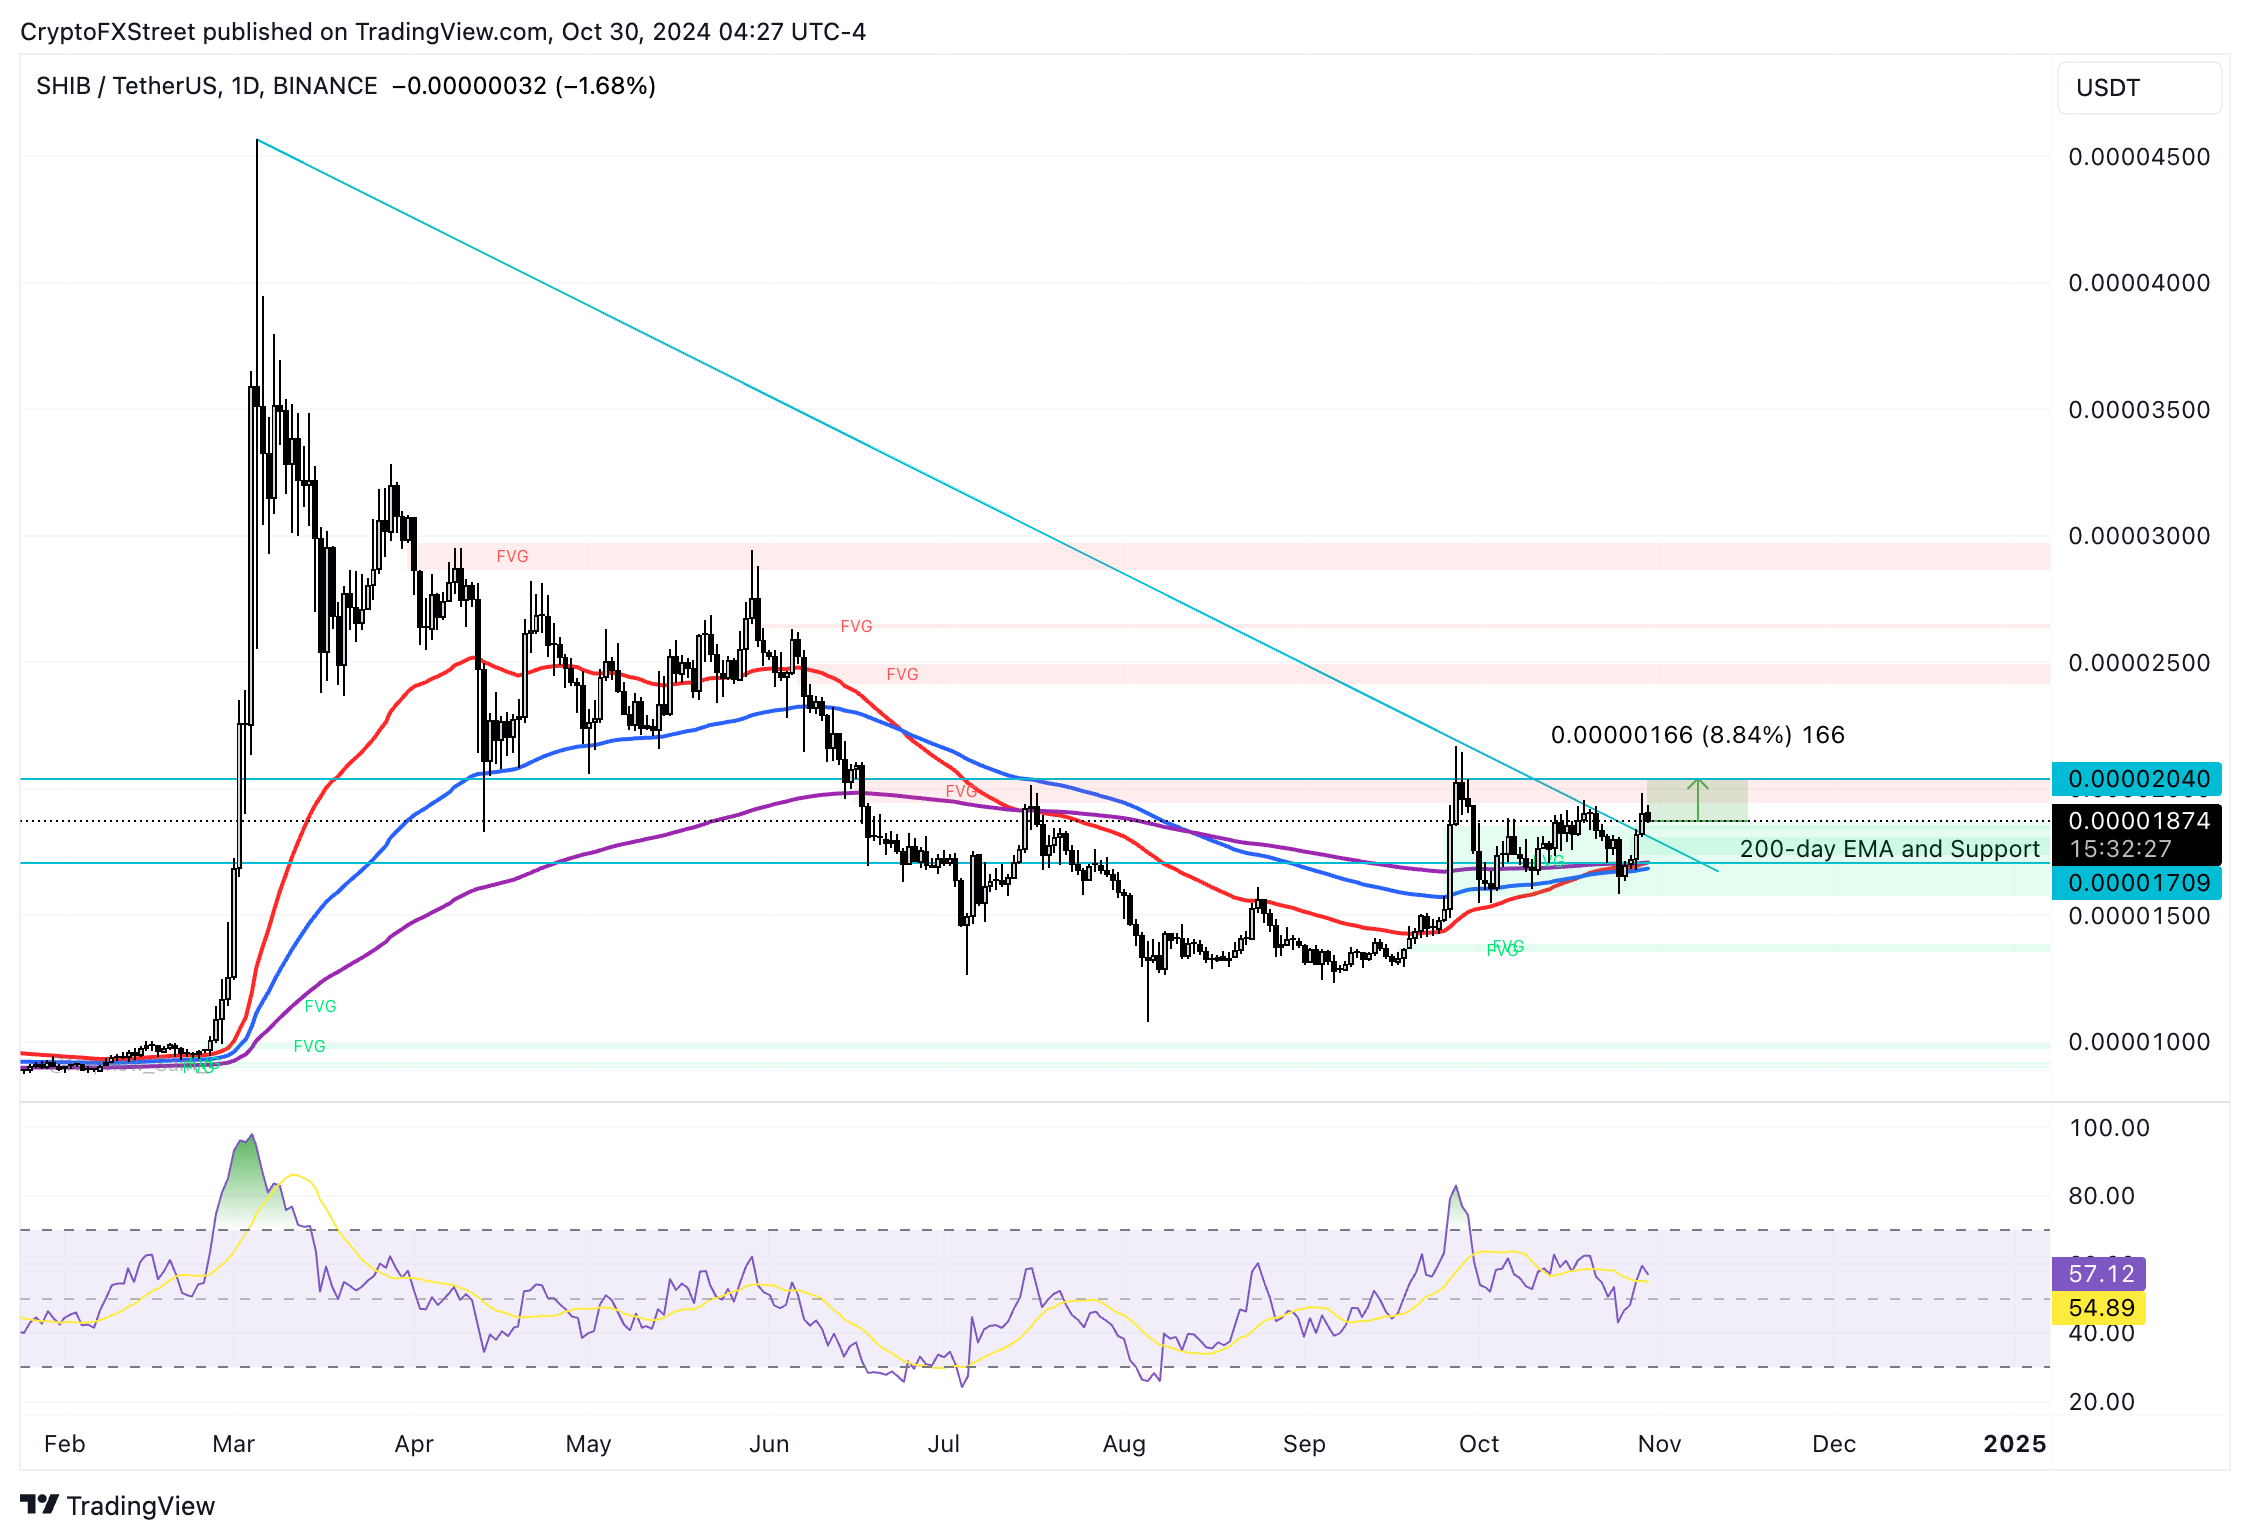
Shiba Inu is attempting to break out of its multi-month downward trend, as seen in the daily price chart below. Prices have recently broken above a descending trendline, drwn by connecting several highs since March. If the breakout is confirmed, SHIB could extend gains by another 8.8% and test resistance at the upper boundary of the FVG at $0.00002040.
The RSI reads 57, above the neutral level of 50, suggesting slightly bullish momentum.
If there is a correction in Shiba Inu price, the meme coin’s first support aligns with the 200-day EMA at $0.00001709.

SHIB/USDT daily chart
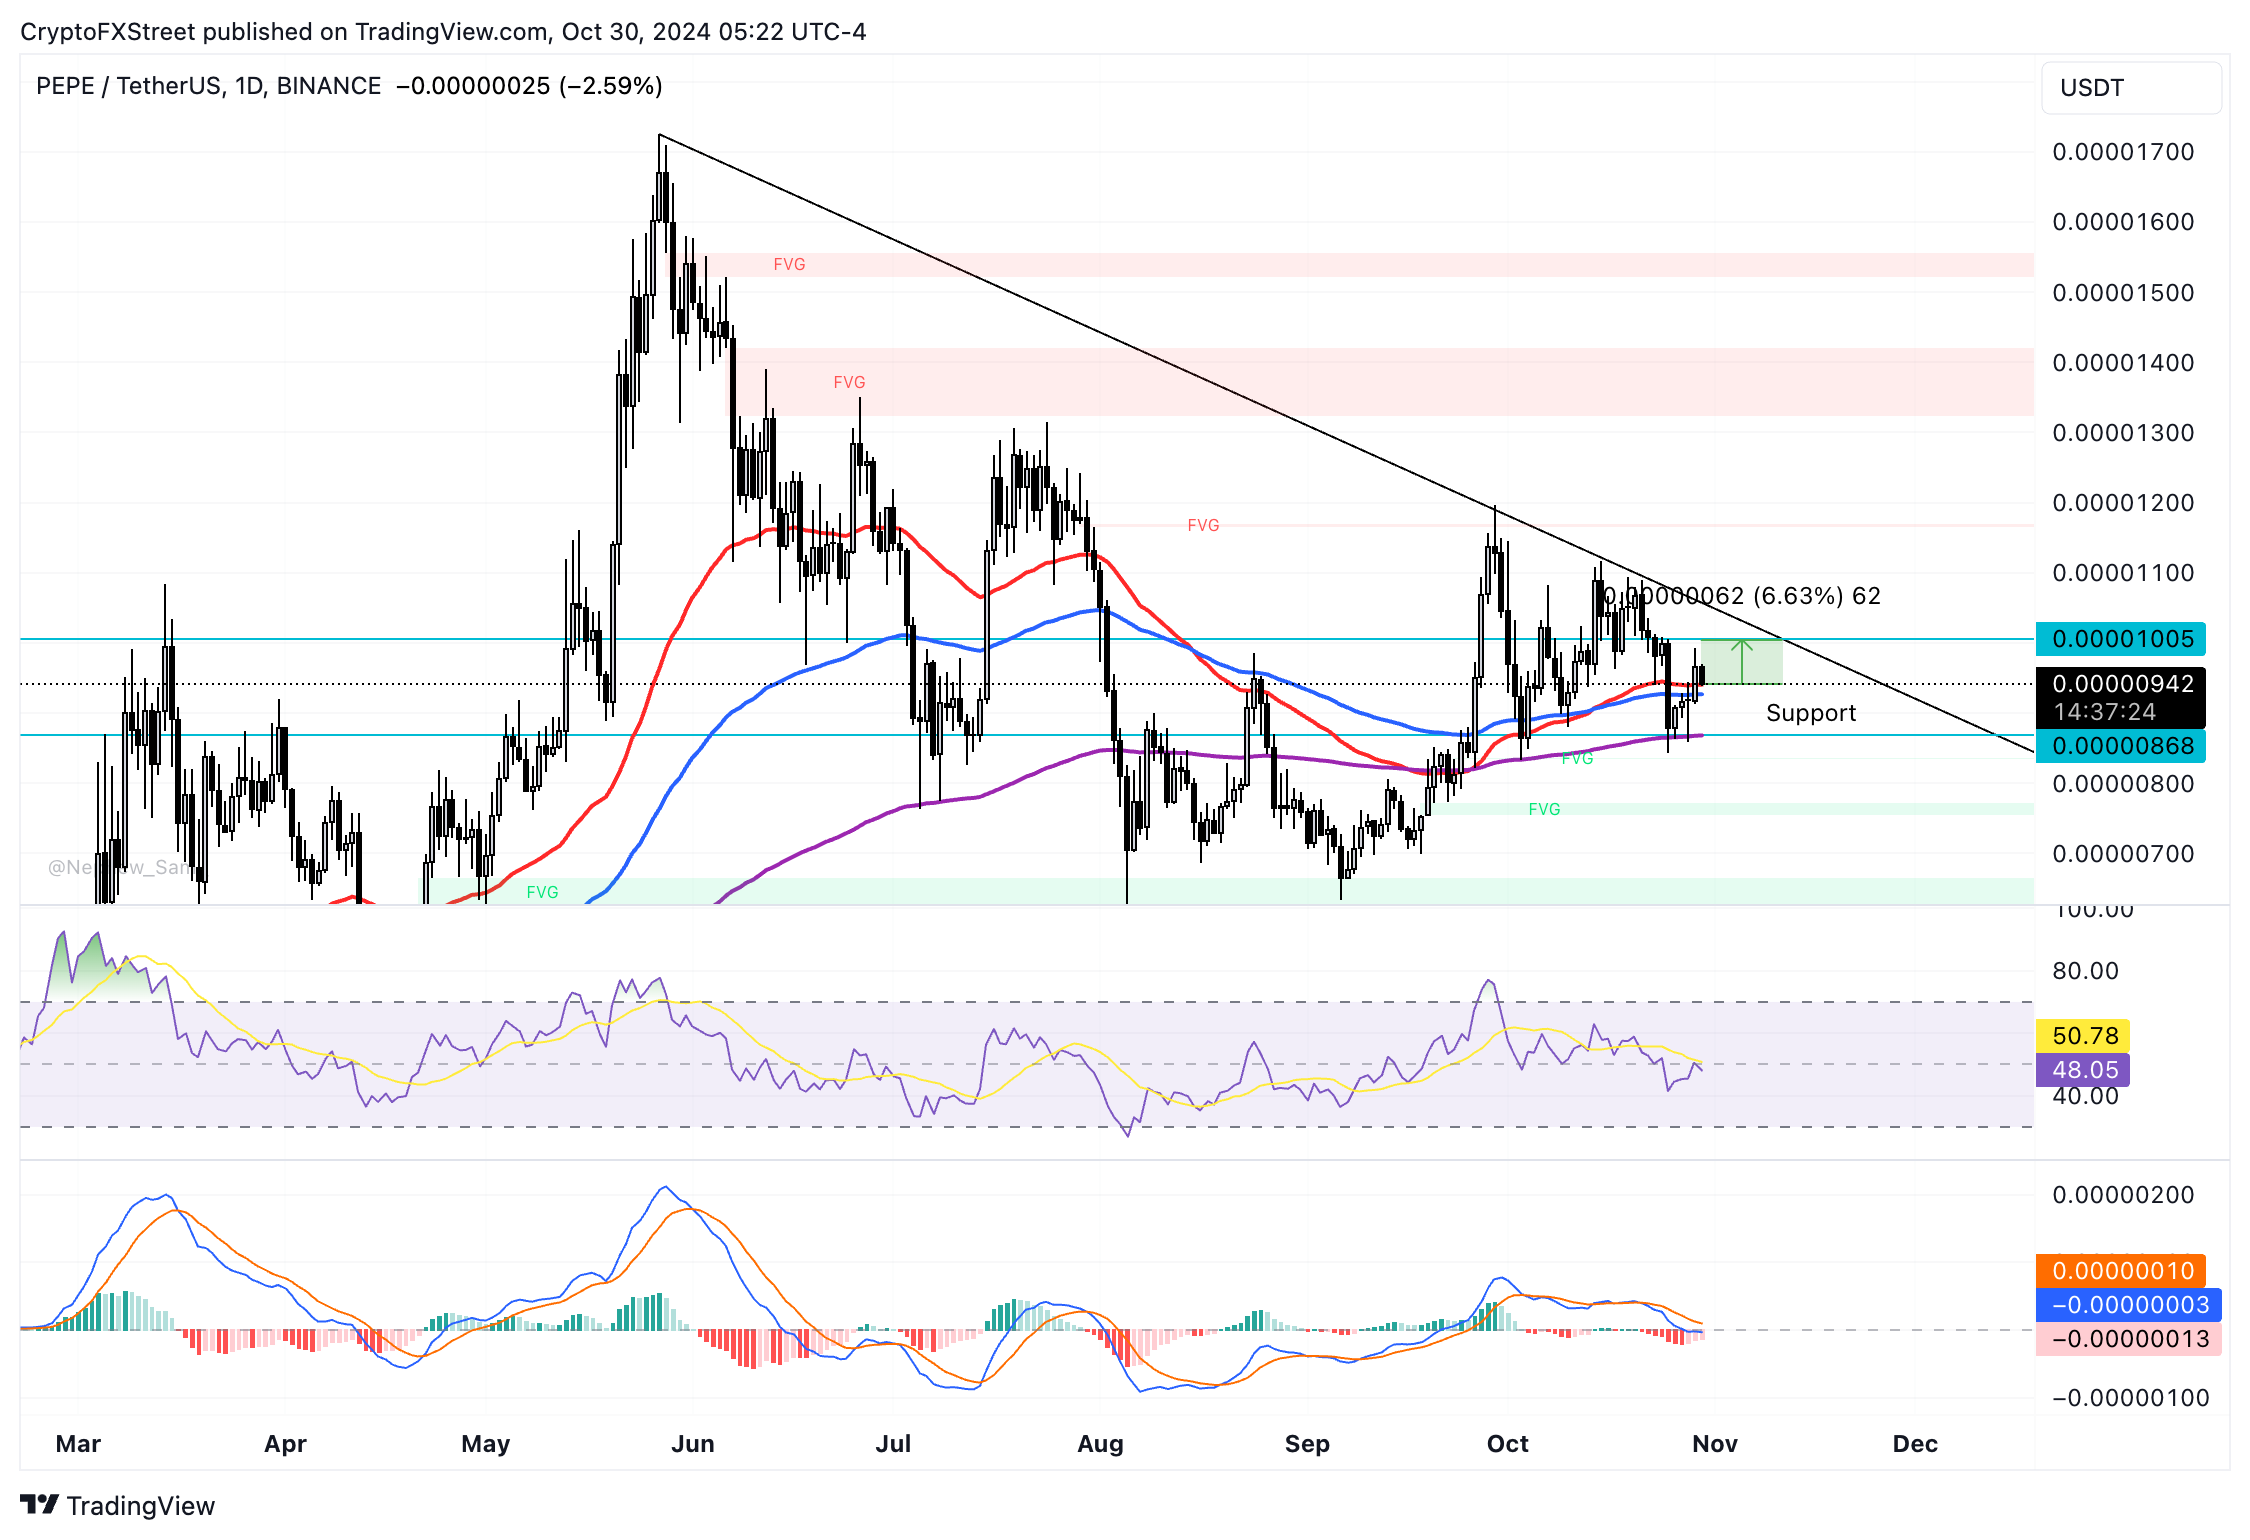
PEPE is also in a downward trend, as seen in its daily chart, producing lower highs since mid-May. The meme coin could gain nearly 7% and test resistance at $0.00001005, the October 25 high and the nearest resistance for the meme coin.
The Moving Average Convergence Divergence (MACD) indicator shows consecutively smaller red histogram bars, meaning the negative momentum in PEPE’s price trend is possibly waning.
RSI reads 48 very close to the neutral level of 50 and indicates indecisiveness among traders.

PEPE/USDT daily chart
PEPE could find support at the 200-day EMA at $0.00000868 if there is a correction in the meme coin.


