Shiba Inu Price Forecast: Nearing descending trendline, bullish breakout possible
- Shiba Inu’s price is nearing the descending trendline; a breakout could signal a bullish trend ahead.
- SHIB’s daily active addresses reach the highest level in October, indicating greater blockchain usage.
- A daily candlestick close below $0.0000155 would invalidate the bullish thesis.
Shiba Inu (SHIB) price is approaching the descending trendline on Wednesday, and a breakout could signal a bullish trend ahead. Additionally, SHIB’s daily active addresses reached their highest level in October, indicating increased blockchain usage and a potential rally ahead.
Shiba Inu price shows potential
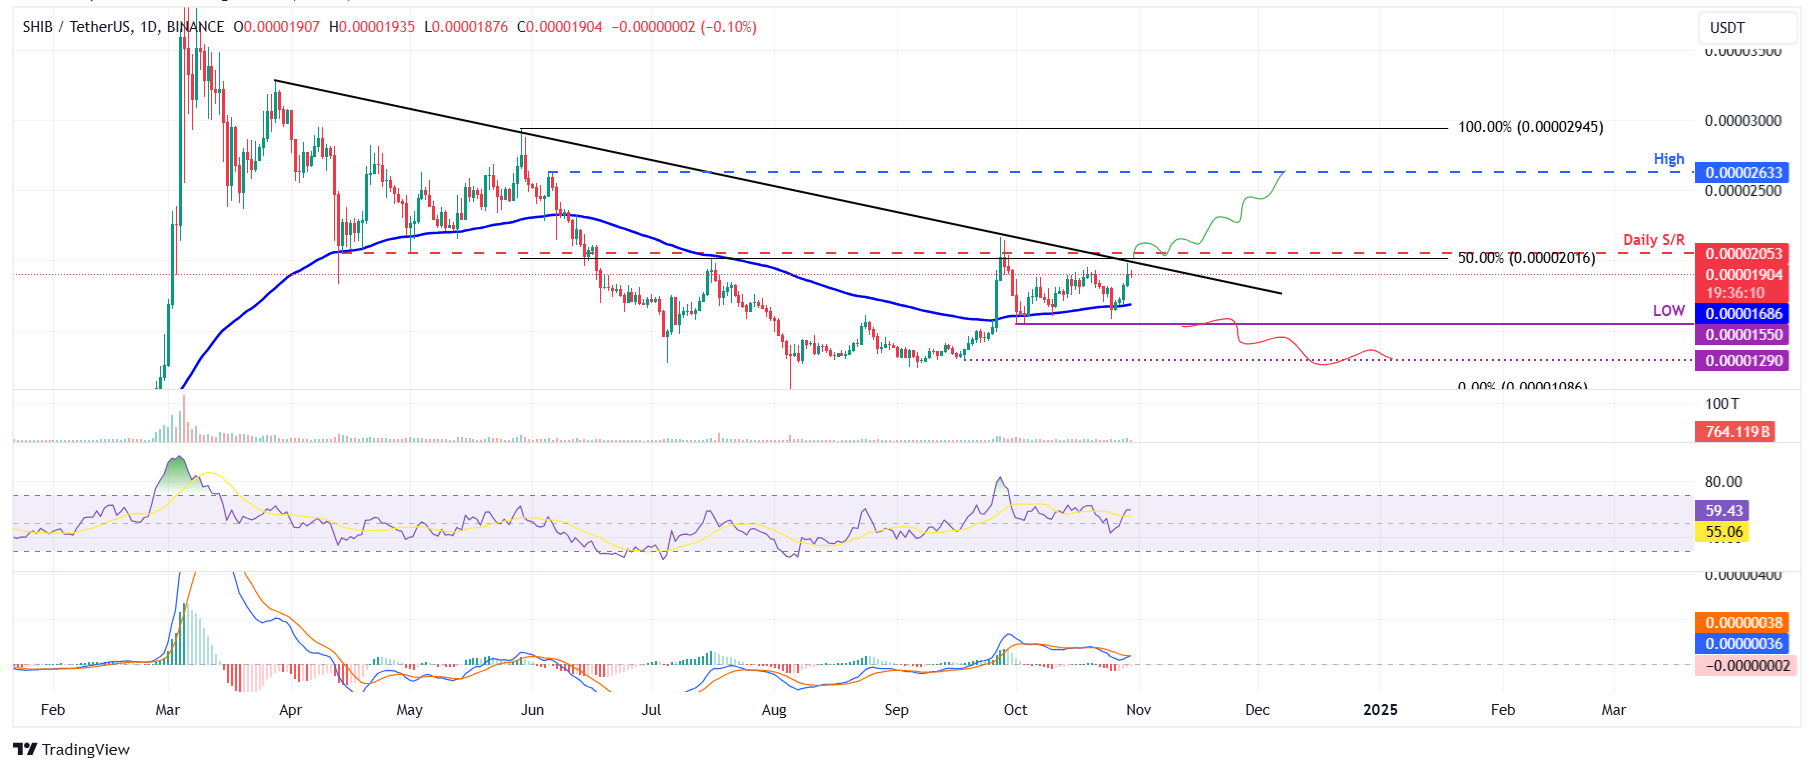
Shiba Inu price retested and found support multiple times around the 100-day Exponential Moving Average (EMA) at $0.0000168 on Friday, rising 14.5% until Tuesday. It is now approaching its descending trendline formed by connecting multiple highs since the end of March, and a break above this trendline could favor the bulls. As of Wednesday, it is trading slightly down around $0.0000190.
If SHIB breaks above the descending trendline and closes above the daily resistance level of $0.000020, it could rally 28% to retest its June 5 high of $0.000026.
The Moving Average Convergence Divergence (MACD) indicator on the daily chart is about to flip over a bullish crossover. If the MACD line (blue line) moves above the signal line (yellow line), it will give a buy signal, suggesting upward momentum.
The daily chart’s Relative Strength Index (RSI) reads 59, pointing upwards, reflecting that bullish momentum is gaining traction.

SHIB/USDT daily chart
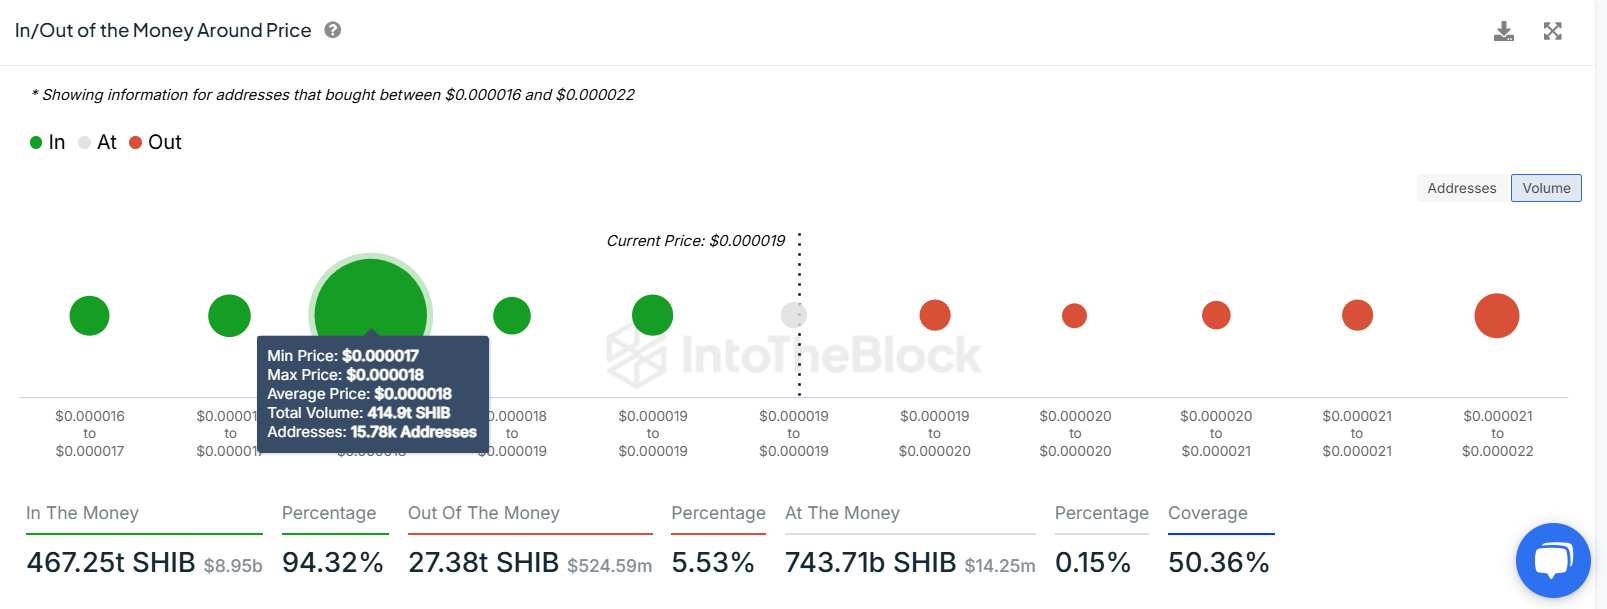
Based on IntoTheBlock’s In/Out of the Money Around Price (IOMAP), nearly 15,780 addresses accumulated 414.9 trillion dog theme-based tokens at an average price of $0.000018. These addresses bought the tokens between $0.000017 and $0.000018, which makes it a key support zone.
Interestingly, the $0.0000168 level mentioned from a technical analysis perspective – the 100-day EMA – roughly coincides with the IOMAP findings, making this zone a key reversal area to watch.

SHIB IOMAP chart. Source: IntoTheBlock
Santiment’s Daily Active Addresses index, which tracks network activity over time, also paints a bullish picture for SHIB. A rise in the metric signals greater blockchain usage, while declining addresses point to lower demand for the network.
In SHIB’s case, daily active addresses rose from 3,398 on Monday to 5,175 on Wednesday, marking the highest level in October. This indicates an increasing demand for Shiba Inu’s blockchain usage and bodes well for its price.
 [09.51.01, 30 Oct, 2024]-638658644131829404.png)
SHIB daily active addresses chart. Source: Santiment
If SHIB breaks below the 100-day EMA and closes below the October 1 low of $0.0000155, the bullish thesis will be invalidated. This scenario would lead to a 16% decline in Shiba price to retest its September 18 low of $0.0000129.


