
Bitcoin Weekly Forecast: New all-time high at $78,900 looks feasible
- Bitcoin price declines over 2% this week, but the bounce from a key technical level on the weekly chart signals chances of hitting a new all-time high in the short term.
- US spot Bitcoin ETFs posted $596 million in inflows until Thursday despite the increased profit-taking activity.
- Expectations over the upcoming US presidential election outcome could influence crypto markets next week.
Bitcoin (BTC) trades slightly down at around $67,500 on Friday after finding support around the $66,000 level on Wednesday, following three consecutive days of decline earlier in the week. While prices are down around 2% this week until Friday, the technical outlook suggests a bullish bias for BTC, projecting a new all-time high of $78,900 in the short-term.
This bullish outlook is further supported by the rising institutional demand via ETFs, which recorded inflows of more than $500 million this week. Some analysts suggest that the upcoming US presidential election on November 5 will be one of the main drivers for crypto markets in the short term, while others highlight that institutional investors’ rise in digital assets could fuel the rise in Bitcoin prices.
Bitcoin rally eases amid increased profit-taking
After ending the previous week on a bullish note, Bitcoin bulls were exhausted and prices declined on Monday. BTC fell over 2.4% as some holders booked some profits, as Santiment’s Network Realized Profit/Loss (NPL) shows.
In BTC’s case, the NPL indicator spiked from 348.87 million to 1.64 billion from Saturday to Sunday. This uptick indicates that the holders were, on average, taking profits.
 [13.11.03, 25 Oct, 2024]-638654467787019159.png)
Bitcoin Network Realized Profit/Loss chart. Source: Santiment
Despite Monday’s decline, institutional investors capitalized on Bitcoin price dips. Coinglass ETF data shows that the US spot ETFs experienced a net inflow of $297.60 million, largely fueled by BlackRock (IBIT) funds, contributing $332.30 million.
On Tuesday, Bitcoin stabilized at around $67,000 as Institutional demand for Bitcoin declined slightly. According to Coinglass ETF data, ETFs experienced a minor outflow of $87.90 million, ending a streak of seven consecutive days of inflows.
Bitcoin’s price declined again on Wednesday, falling below $66,000 and reaching a daily low of $65,260. Some holders booked profits again, as Santiment’s Network Realized Profit/Loss shows. The NPL indicator spiked from 307.17 million to 456.81 million on that day. The fall in Bitcoin price on Wednesday led institutional investors to buy the dips and accumulate $198.50 million, per Coinglass ETF inflow data.
On Thursday, Bitcoin recovered 2.29% after finding support around the $66,000 level, supported by the inflows in Spot ETF as it recorded a $187.58 million on that day.
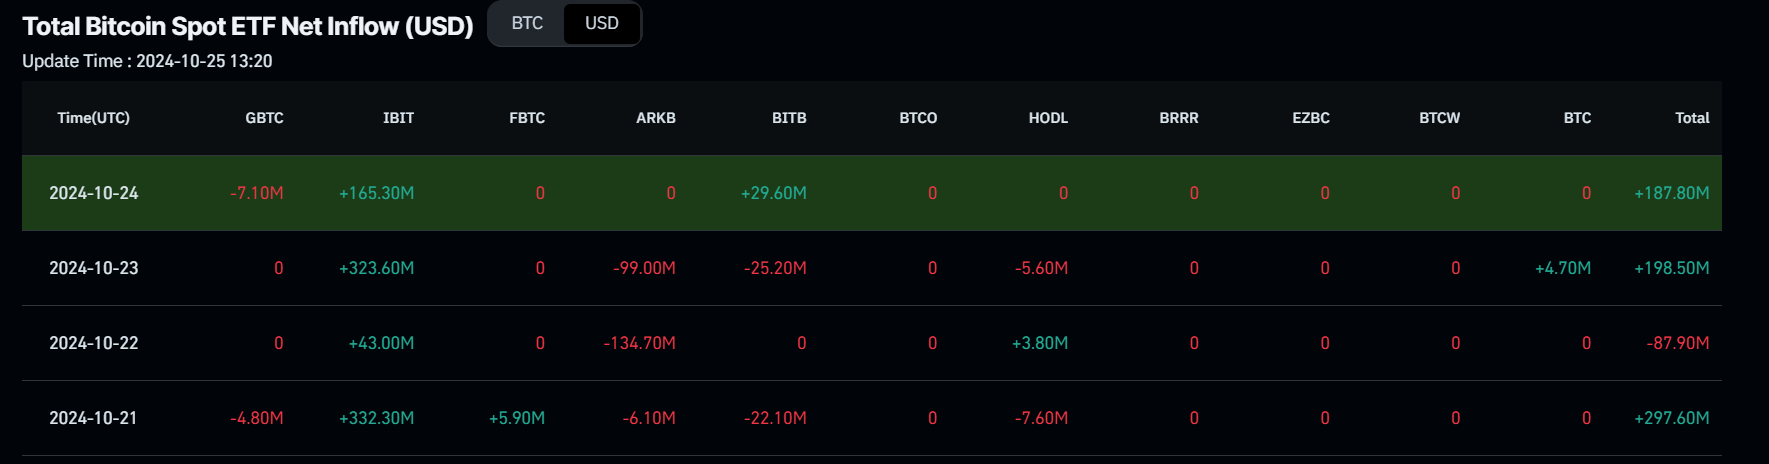
Total Bitcoin Spot ETF Net Inflow chart. Source: Coinglass
Glassnode weekly report gives a clearer picture as it explains that Open Interest (OI) across both perpetual and fixed-term futures contracts has recorded a new all-time high (ATH) of $32.9 billion this week, suggesting a marked increase in aggregate leverage entering the system.
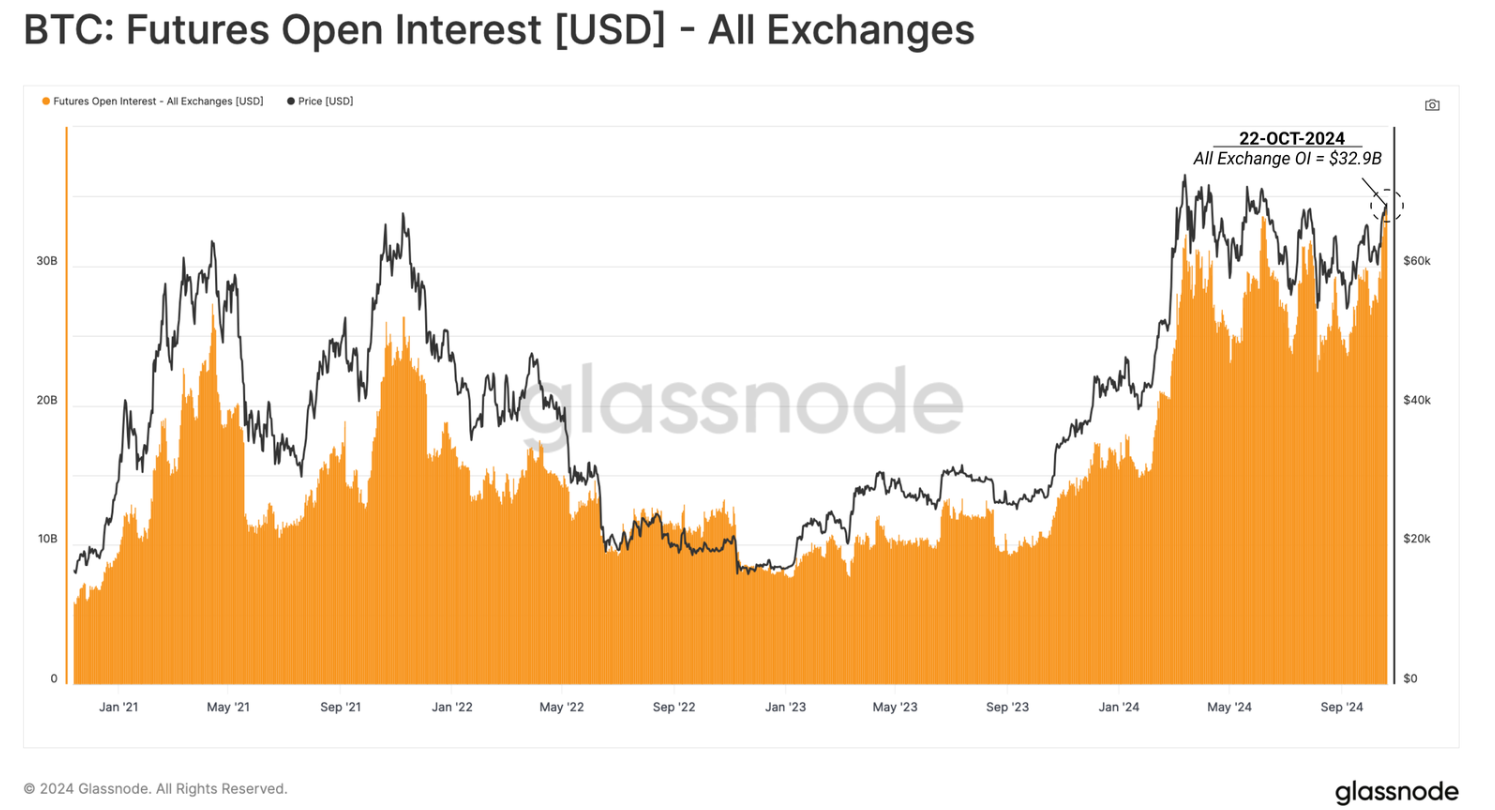
BTC Futures Open Interest chart. Source: Glassnode
Moreover, “the dominance of the CME Group exchange highlights an increasing presence of institutional investors in the digital asset space, which strongly indicates that a cash-and-carry strategy is in play,” the report says.
As of Friday, Bitcoin trades slightly down around $67,500.
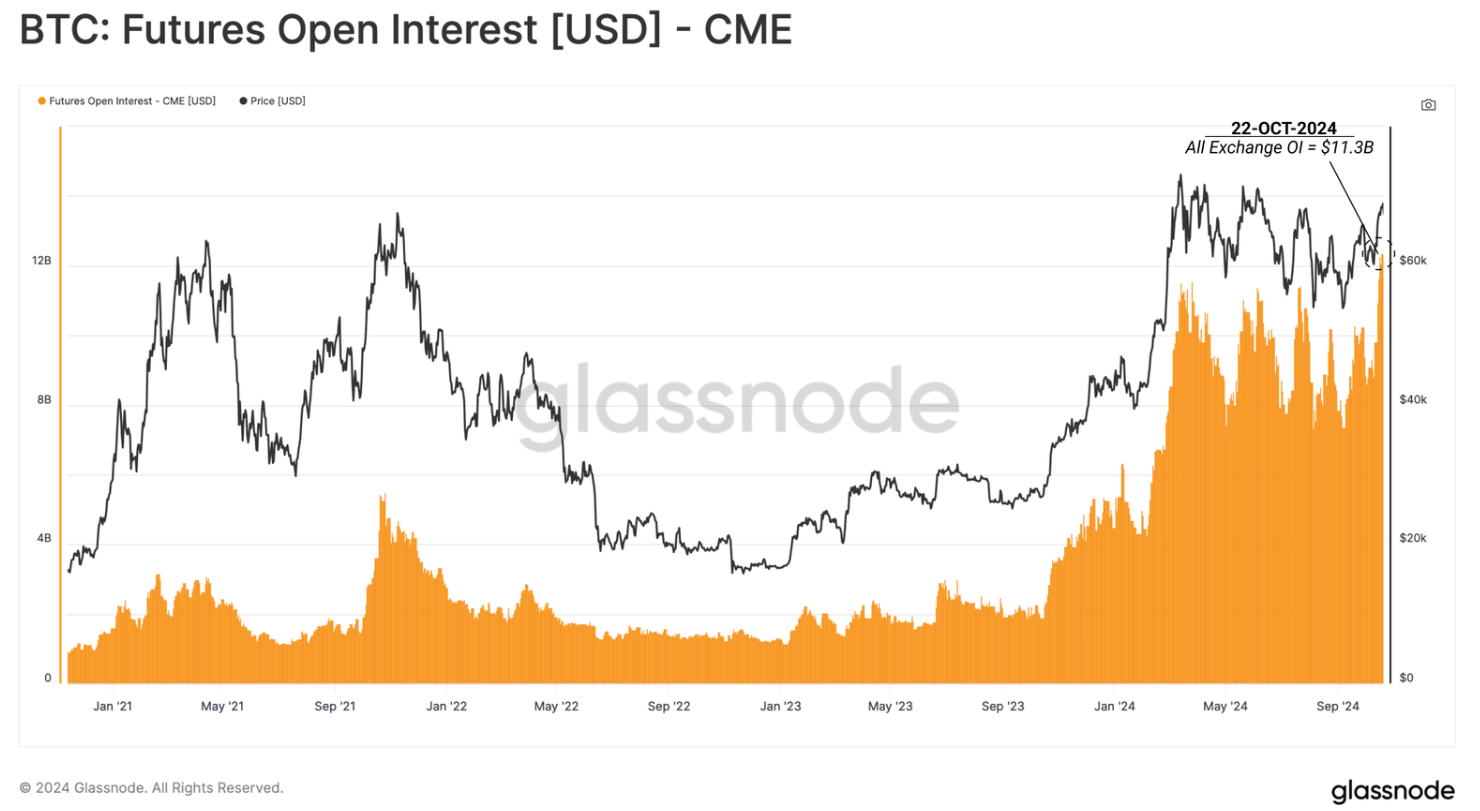
BTC CME chart. Source: Glassnode
US presidential election takes center stage
A report from QCP Capital’son Tuesday highlights how the upcoming US elections on November 5 can affect the crypto market.
“The election creates a zero-sum scenario for equities, with sector winners dependent on the outcome. In contrast, both candidates are more crypto-friendly than the previous administration, so any weakness in equities may prompt capital to reallocate to crypto, says the report.
Uncertainty about the election outcome could be the main driver for crypto prices until the results are clear. Polls show the race between former President Donald Trump and Vice President Kamala Harris are tight in almost all the so-called swing states, which are likely to decide who will sit in the Oval Office for the next four years.
Meanwhile, bets at Polymarket continue to favor the Republican candidate by 64% against the 36% of Harris.
Bitcoin technical outlook: Weekly analysis projects new ATH at $78,955
Bitcoin’s weekly chart shows that the biggest crypto asset by market capitalization broke above the downward-slopping parallel channel pattern last week and has successfully retested the breakout level around $67,500.
This pattern is formed by connecting multiple weekly closes with two trendlines (from early March to October).A breakout and retest of this pattern, confirmed by a weekly close above the breakout level, favors the bulls.
The pattern’s technical target (obtained by measuring the distance between the two trendlines and extrapolating it higher) projects a new ATH of $78,955.
The Relative Strength Index (RSI) momentum indicator on the weekly chart trades at 57, above its neutral level of 50 and still far below overbought conditions, suggesting bullish momentum is gaining traction.
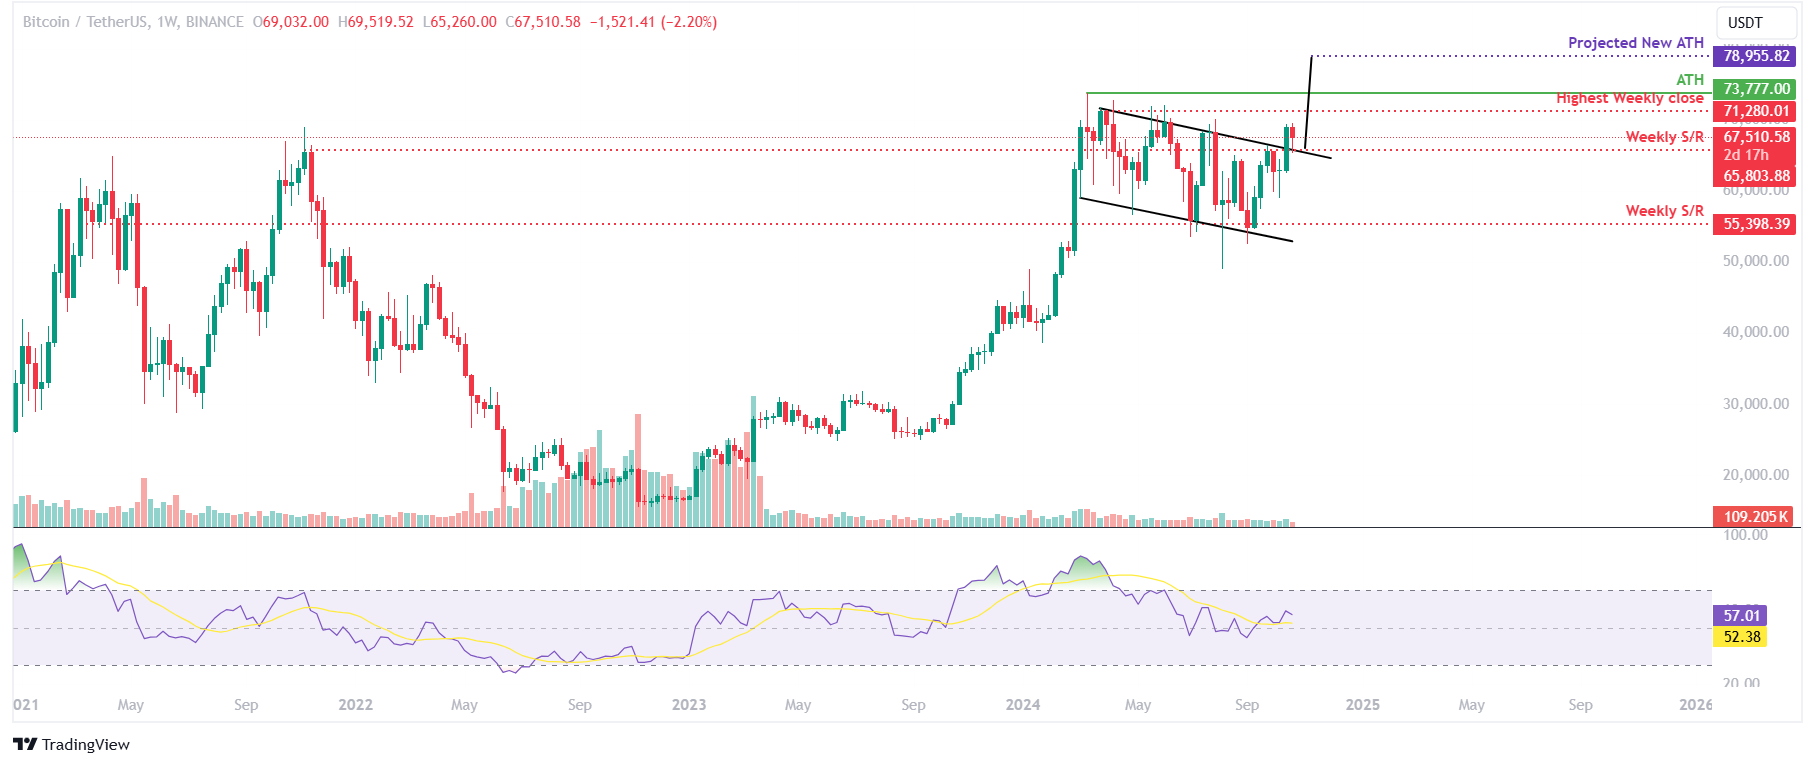
BTC/USDT weekly chart
The daily chart also indicates signs of recovery after finding support around the $66,000 level on Wednesday, following three consecutive days of decline earlier in the week. At the time of writing on Friday, it trades slightly down around $67,500.
If the $66,000 level continues to hold as support, it could rally to reclaim its Monday high of $69,519. A successful break and close above $70,000 could extend the rally to retest its next key barrier, which is already the all-time high of $73,777 seen in mid-March.
The RSI indicator on the daily chart reads 59 after bouncing off around the neutral level of 50 on Wednesday, indicating the bullish momentum is gaining traction.
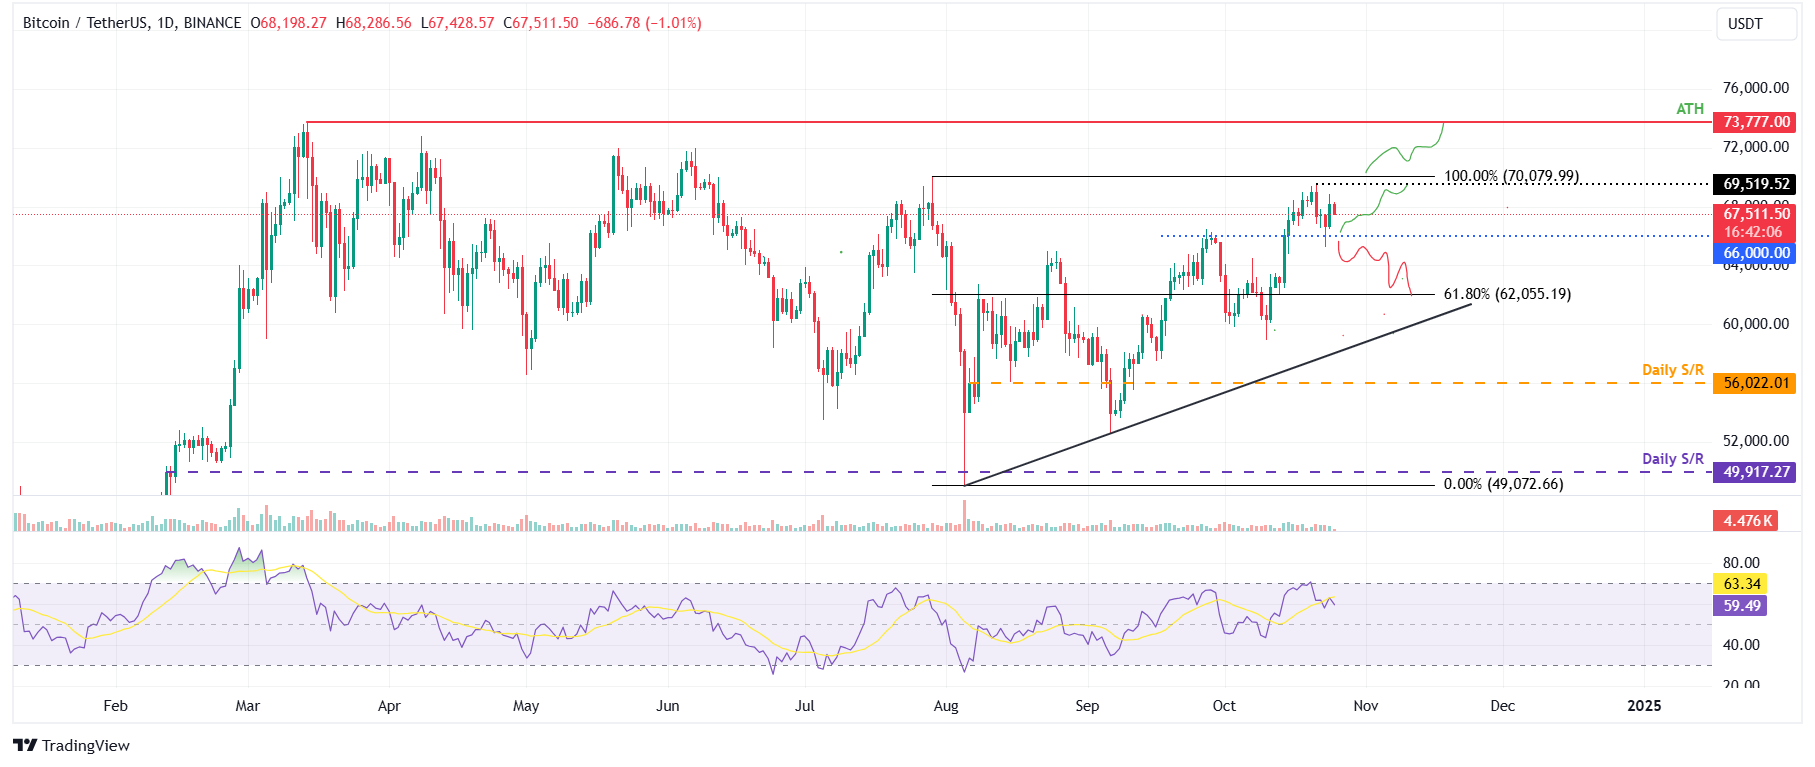
BTC/USDT daily chart
Bitcoin, altcoins, stablecoins FAQs
Bitcoin is the largest cryptocurrency by market capitalization, a virtual currency designed to serve as money. This form of payment cannot be controlled by any one person, group, or entity, which eliminates the need for third-party participation during financial transactions.
Altcoins are any cryptocurrency apart from Bitcoin, but some also regard Ethereum as a non-altcoin because it is from these two cryptocurrencies that forking happens. If this is true, then Litecoin is the first altcoin, forked from the Bitcoin protocol and, therefore, an “improved” version of it.
Stablecoins are cryptocurrencies designed to have a stable price, with their value backed by a reserve of the asset it represents. To achieve this, the value of any one stablecoin is pegged to a commodity or financial instrument, such as the US Dollar (USD), with its supply regulated by an algorithm or demand. The main goal of stablecoins is to provide an on/off-ramp for investors willing to trade and invest in cryptocurrencies. Stablecoins also allow investors to store value since cryptocurrencies, in general, are subject to volatility.
Bitcoin dominance is the ratio of Bitcoin's market capitalization to the total market capitalization of all cryptocurrencies combined. It provides a clear picture of Bitcoin’s interest among investors. A high BTC dominance typically happens before and during a bull run, in which investors resort to investing in relatively stable and high market capitalization cryptocurrency like Bitcoin. A drop in BTC dominance usually means that investors are moving their capital and/or profits to altcoins in a quest for higher returns, which usually triggers an explosion of altcoin rallies.
Recommended Articles


