Solana Price Forecast: SOL hits new all-time high against Ethereum
Solana price today: $175.77
- Solana price hit a new all-time high against Ethereum at $0.06922 on Wednesday.
- On-chain analysts at Santiment said SOL price could rally even as crowd sentiment is bearish.
- Solana eyes the psychologically important $180 target in its uptrend.
Solana (SOL) extends its weekly positive move and trades near $175.00 as the altcoin hit a record high against Ethereum (SOL/ETH) on Wednesday at 0.06922.
Solana extends gains after hitting all-time high against Ethereum
Solana rallied to a fresh high against Ethereum (ETH) on Wednesday. SOL is considered one of the leading competitors of Ether’s smart contract blockchain. It is therefore a key development for SOL traders that SOL/ETH hit a new all-time high.
A technical analyst (behind the X handle @KarenZh30739159)at Foresight News identified what differentiates Solana from Ethereum and explained the reason for SOL’s price rally as Ethereum hovers around $2,600. Ethereum expanded its ecosystem through Layer 2 and 3 chains as well as alternative scaling solutions. However, in the same time frame, Solana gained popularity through meme coins and new token launches on the chain.
Retail traders and their interest in Solana is likely one of the key factors driving gains in the altcoin.
「价格为王」 or 「长期主义」?
— siri.eth | KarenZ (, ) @karenzh30739159.lens (@KarenZh30739159) October 24, 2024
关于以太坊与Solana之间的角逐,以太坊整个生态主要在探索二层、三层、质押、再质押、互操作性等,其中二层和质押取得的成就有目共睹,将以太坊简单地视为一家公司,可能会忽略其在技术创新、生态构建等方面的优势。但是价格低迷确实给以太坊带来不小的压力。…
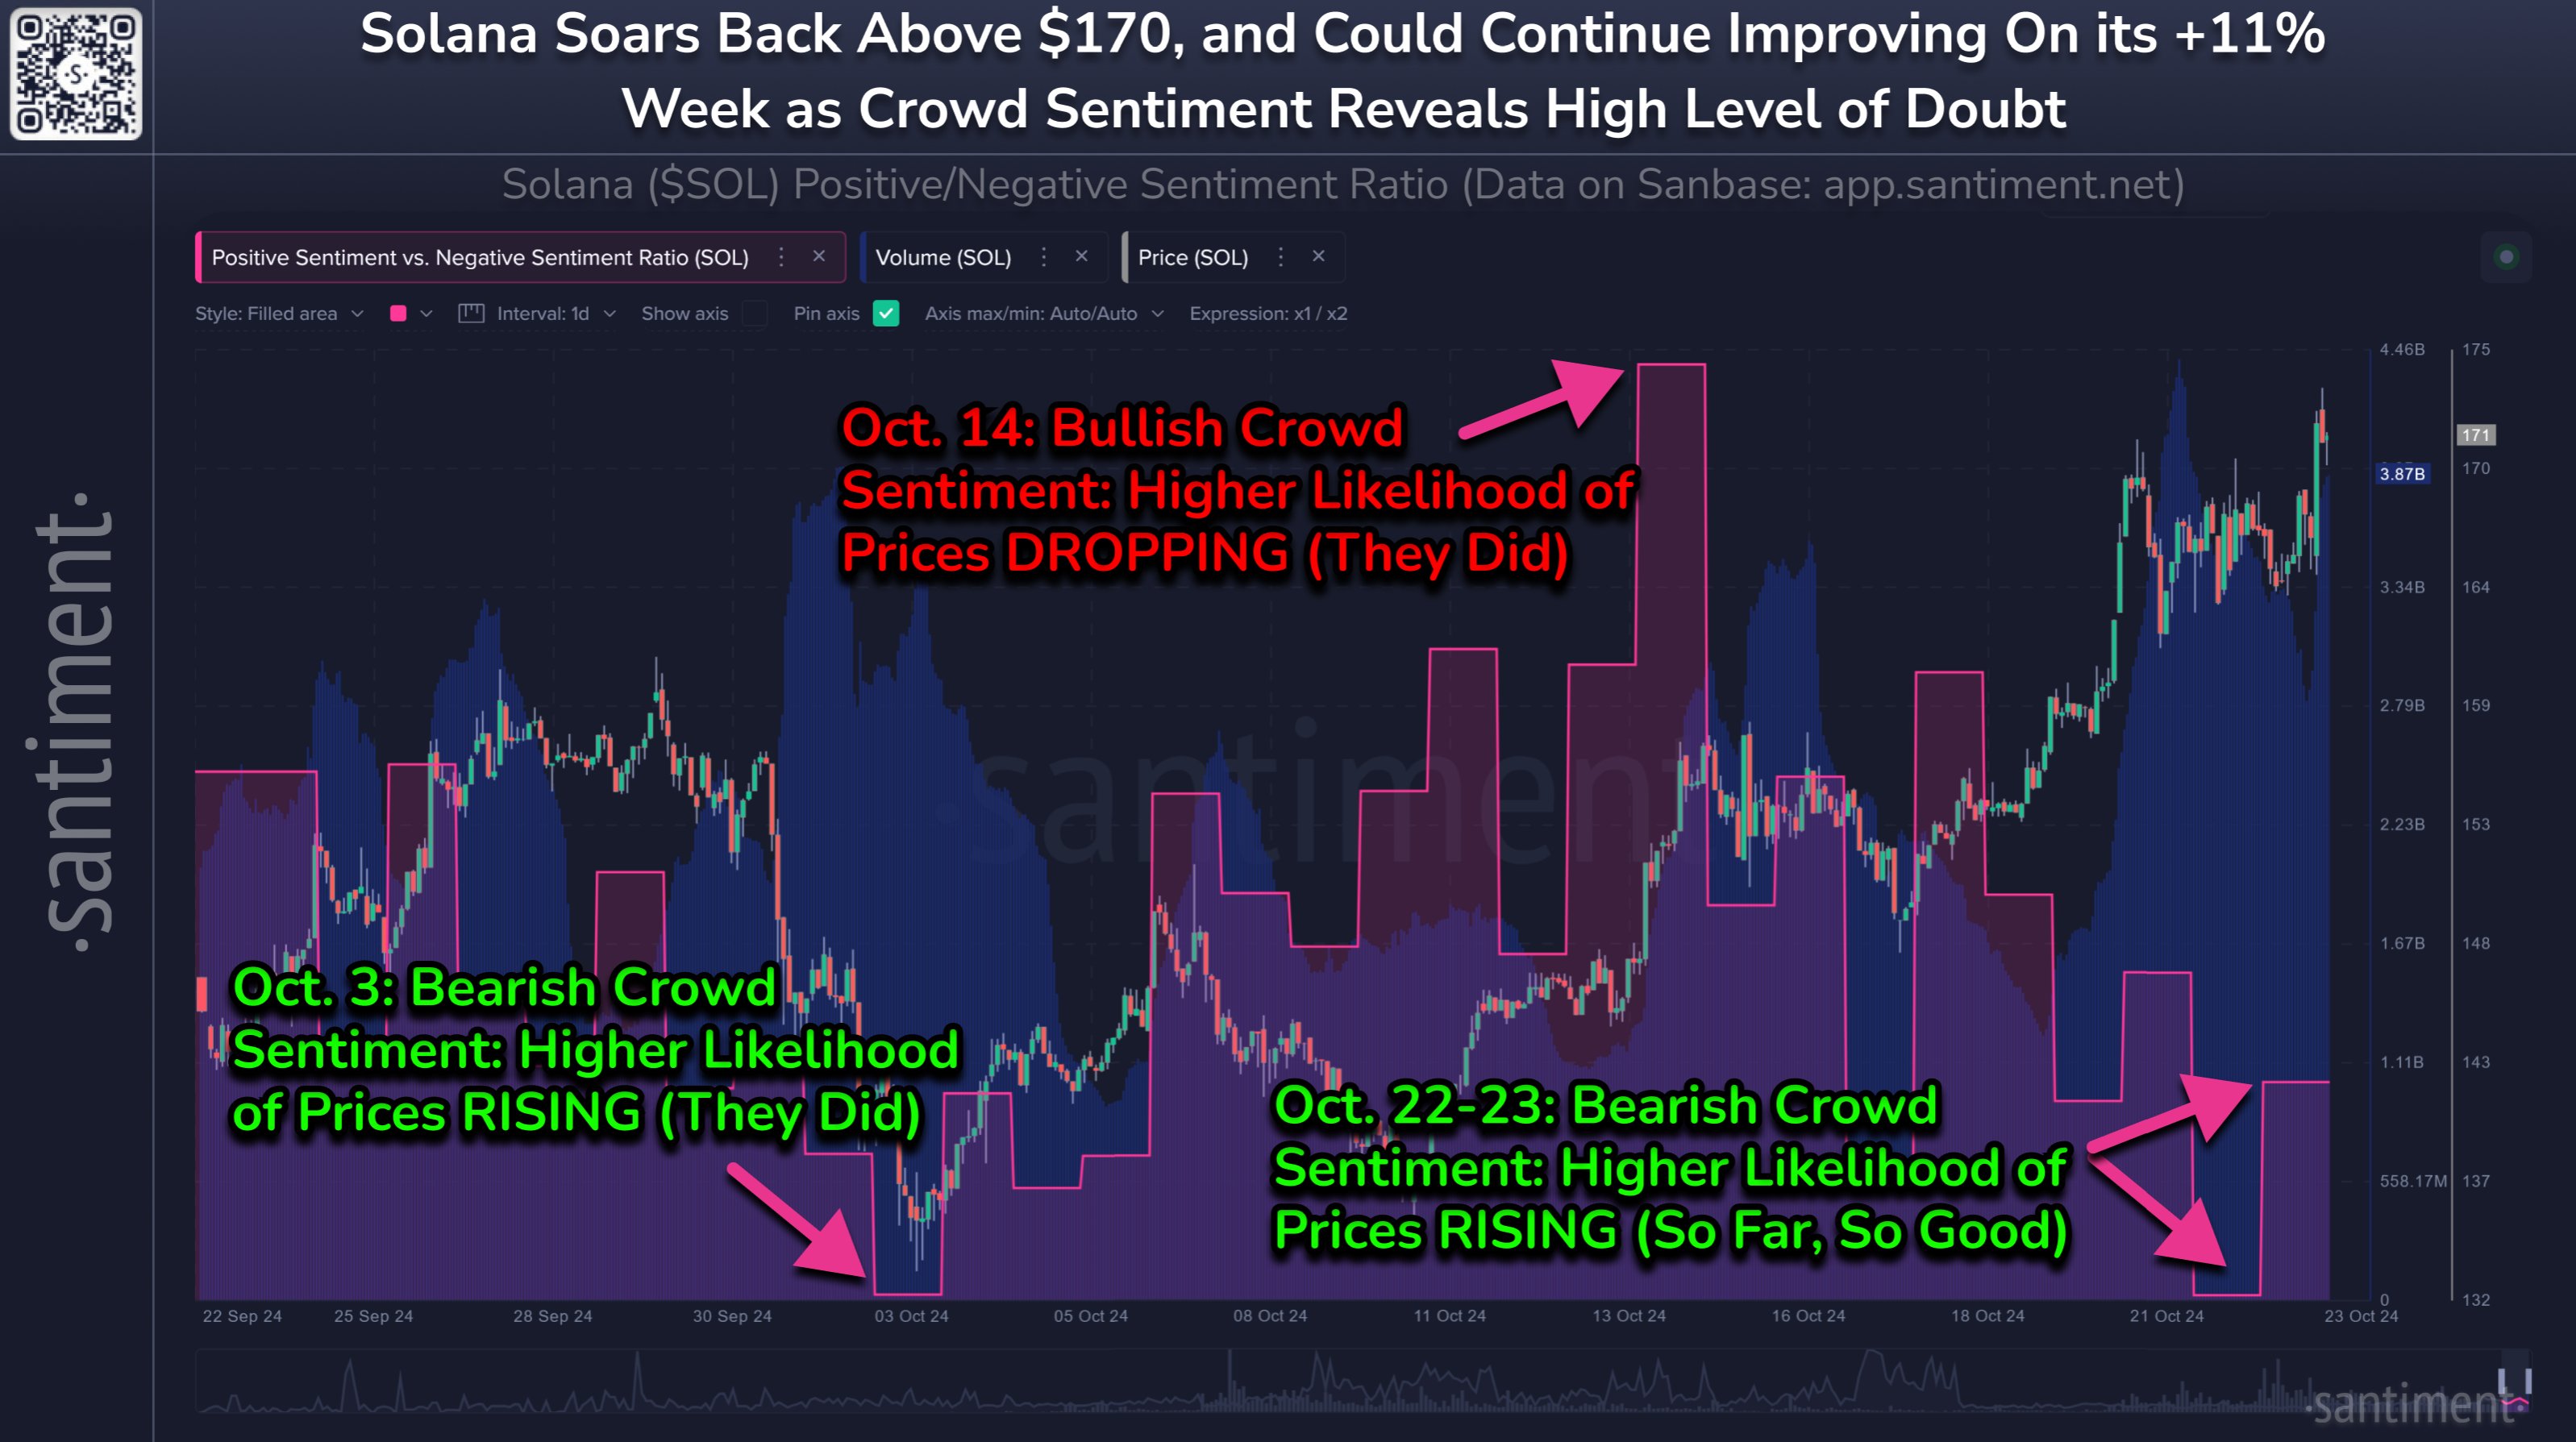
On-chain analysts at crypto intelligence tracker Santiment shared their insights about Solana in a recent tweet on X. Analysts highlighted how a bearish sentiment among traders failed to dampen the altcoin’s price trend.
Analysts ask traders to watch out for further gains in SOL even though some investors remain bearish on the token.

Santiment’s analysis of Solana sentiment and price trend
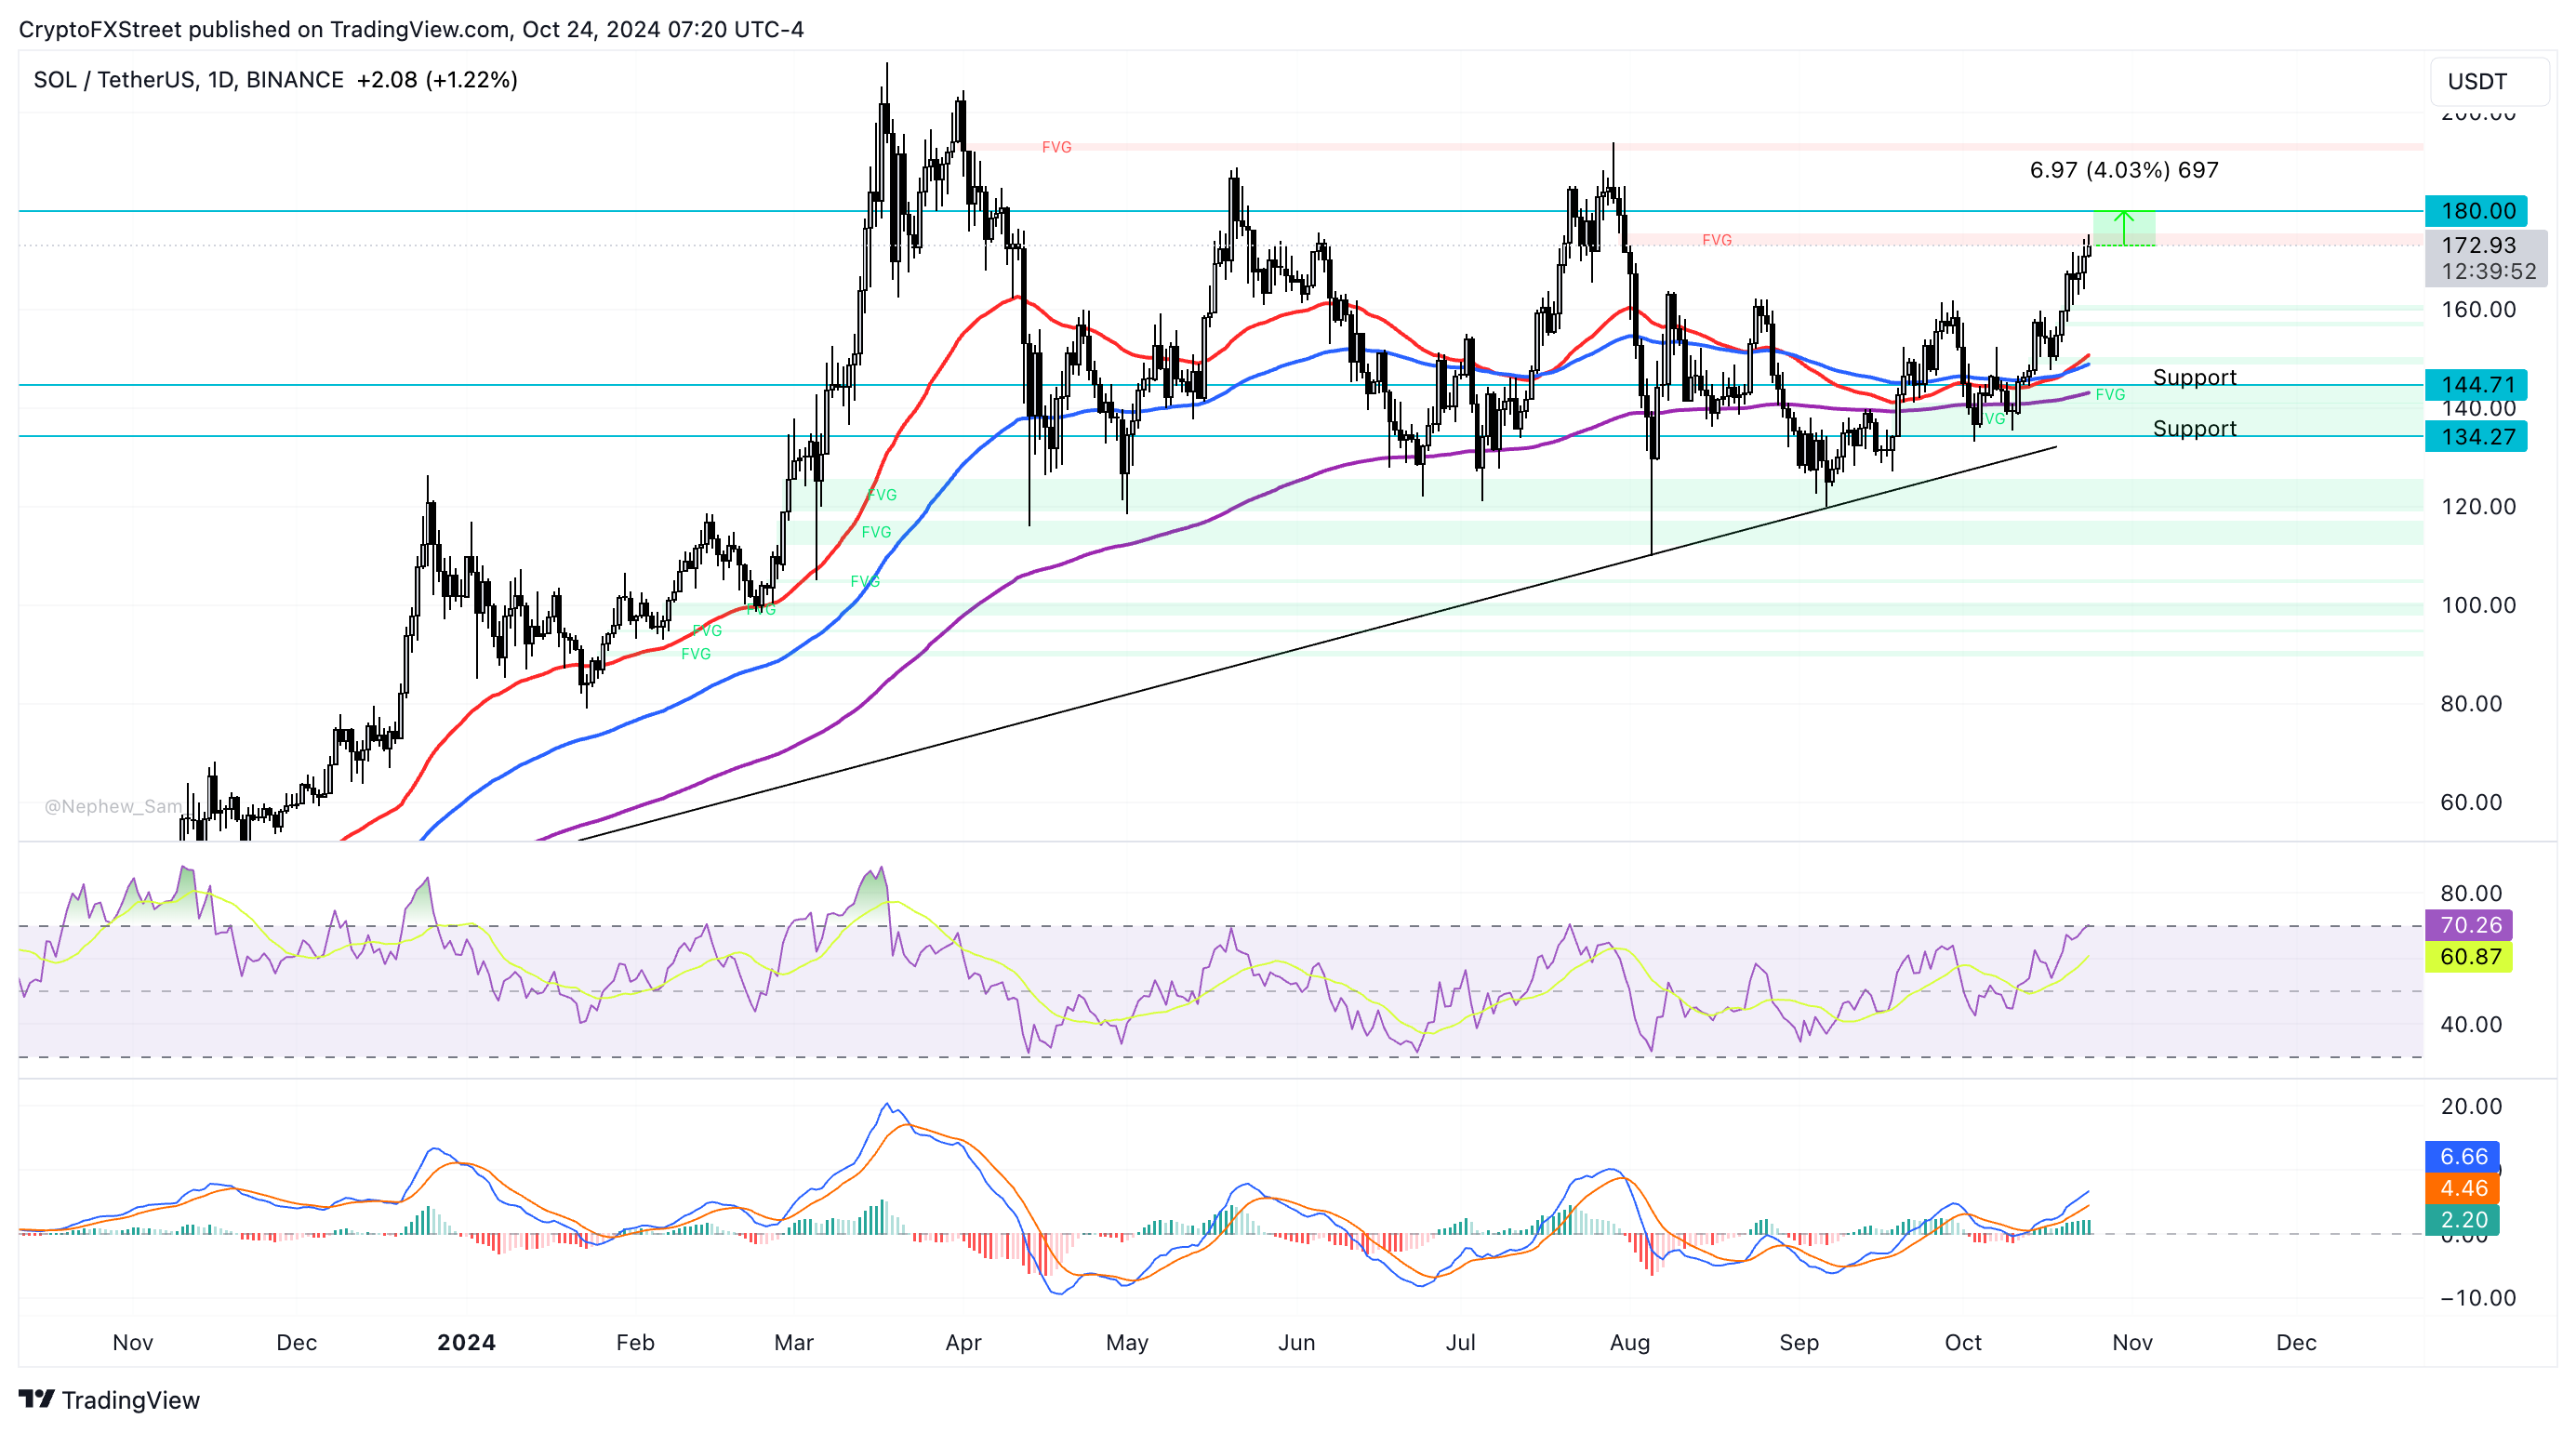
Solana Price Forecast: SOL eyes 4% gains
Solana trades near $175.77 at the time of writing and targets $180, a psychologically important level for the altcoin. SOL could face immediate resistance in the Fair Value Gap (FVG) between $172.91 and $175.39.
The Moving Average Convergence Divergence (MACD) indicator shows green histogram bars above the neutral level in the daily chart, signalling underlying positive momentum in SOL price trend. However, the Relative Strength Index (RSI) momentum indicator enters overbought conditions just above the 70 level, suggesting traders not to add to their long positions.

SOL/USDT daily chart
In case of a correction, Solana could find support at the 10-day Exponential Moving Average at $150.74 and the September 19 low, which coincides with a lower boundary of an FVG, at $134.27.

