
Litecoin Records Highest Volume Since May 2023, Bullish Sign?
On-chain data shows Litecoin has recently recorded its highest weekly volume since May 2023. Here’s what this could mean for the asset’s price.
Litecoin Transaction Volume Has Been Rising Recently
In a new post on X, Jay Milla, the director of marketing at Litecoin Foundation, has pointed out that the LTC network has witnessed a large amount of transaction volume during the past week. The “transaction volume” here refers to an on-chain metric that keeps track of the total amount of Litecoin that’s becoming involved in transactions on the network every day.
When the value of this metric is high, it means the users are moving around large amounts on the blockchain. Such a trend implies the trading interest in the asset is high among the investors.
On the other hand, the indicator being low implies the holders may not be paying much attention to the cryptocurrency as they aren’t making too many transfers.
Now, here is a chart that shows the trend in the Litecoin transaction volume over the last few months:

As displayed in the above graph, the Litecoin transaction volume has witnessed growth recently, suggesting that the users have been participating in an increasing amount of activity. During the past week alone, the network has seen moves amounting to 512.8 million LTC, worth almost $35.4 billion at the current exchange rate of the cryptocurrency. This means that, on average, the chain has been witnessing a volume of over $5 billion every day.
Generally, a high amount of network activity is something that can lead to volatility for the asset’s price, as all these simultaneous moves can provide the fuel that sharp moves require. Any such volatility that emerges out of this, though, can go in either direction. Litecoin has in fact gone down during the last few days, so this recent high volume may have corresponded to selling activity.
What can be constructive, however, is the fact that the metric has been on an upwards trajectory for a while now. This may suggest that the activity isn’t a reflection of some fad, but rather of organic growth.
Litecoin is known for its cheap and fast transactions, so the cryptocurrency has historically tended to perform well in terms of metrics related to network activity. It would appear that this quality of it is still able to attract user interest.
As for how LTC fits into the bigger picture, the market intelligence platform IntoTheBlock has shared a chart comparing the transaction volumes of the major coins in the sector.
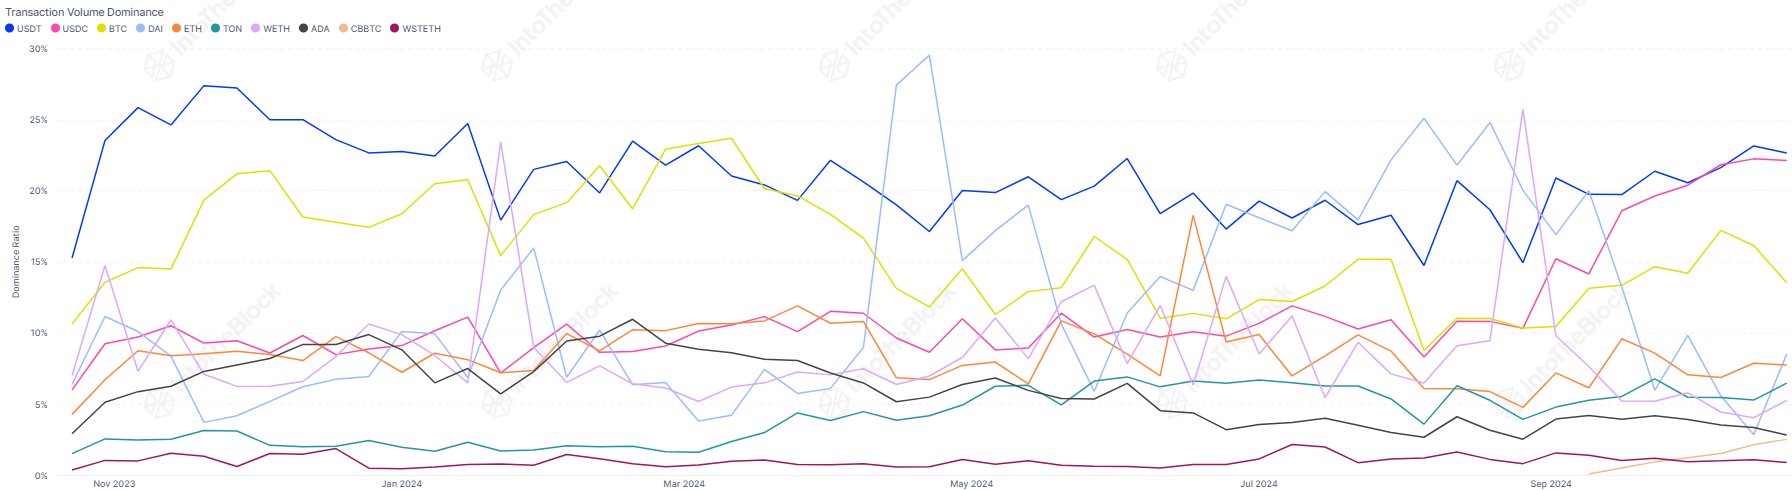
The stablecoins USDT and USDC have dominated the market recently with volumes amounting to $29 billion and $28 billion, respectively. Bitcoin follows these assets in third with the metric standing at $17 billion for it.
Thus, while Litecoin has been growing recently, its volume is still less than a third of the original cryptocurrency’s.
LTC Price
At the time of writing, Litecoin is trading around $69, down more than 2% over the past week.
Recommended Articles


