
Bitcoin Signal That Led To At Least 70% Surge Has Formed Again
On-chain data shows a Bitcoin signal that has led to at least a 70% rally the last four times has recently formed for the asset once again.
Bitcoin MVRV Momentum Has Seen A Bullish Crossover Recently
In a new post on X, analyst Ali Martinez has discussed the recent trend in the Bitcoin Market Value to Realized Value (MVRV) Ratio. The “MVRV Ratio” is an indicator that keeps track of the ratio between the Bitcoin market cap and the realized cap.
The realized cap here refers to an on-chain capitalization model that calculates the total value of the asset by assuming that the true value of any token in circulation is the price at which it was last transacted on the blockchain and not the current spot price.
This last transaction price of any coin is likely to be its latest cost basis, so the realized cap is essentially a sum of the cost basis of all tokens in circulation. Put another way, this model represents the capital the investors have put into the asset.
In contrast, the market cap, which calculates the total valuation of the total BTC supply at the current spot price, signifies the value the investors hold right now.
When the value of the MVRV Ratio is greater than 1, the investors hold more value than they put in, so they are in a state of net profit. On the other hand, the metric under this threshold suggests the market as a whole is carrying a loss.
Now, here is a chart that shows the trend in the Bitcoin MVRV Ratio and its 180-day moving average (MA) over the last few years:
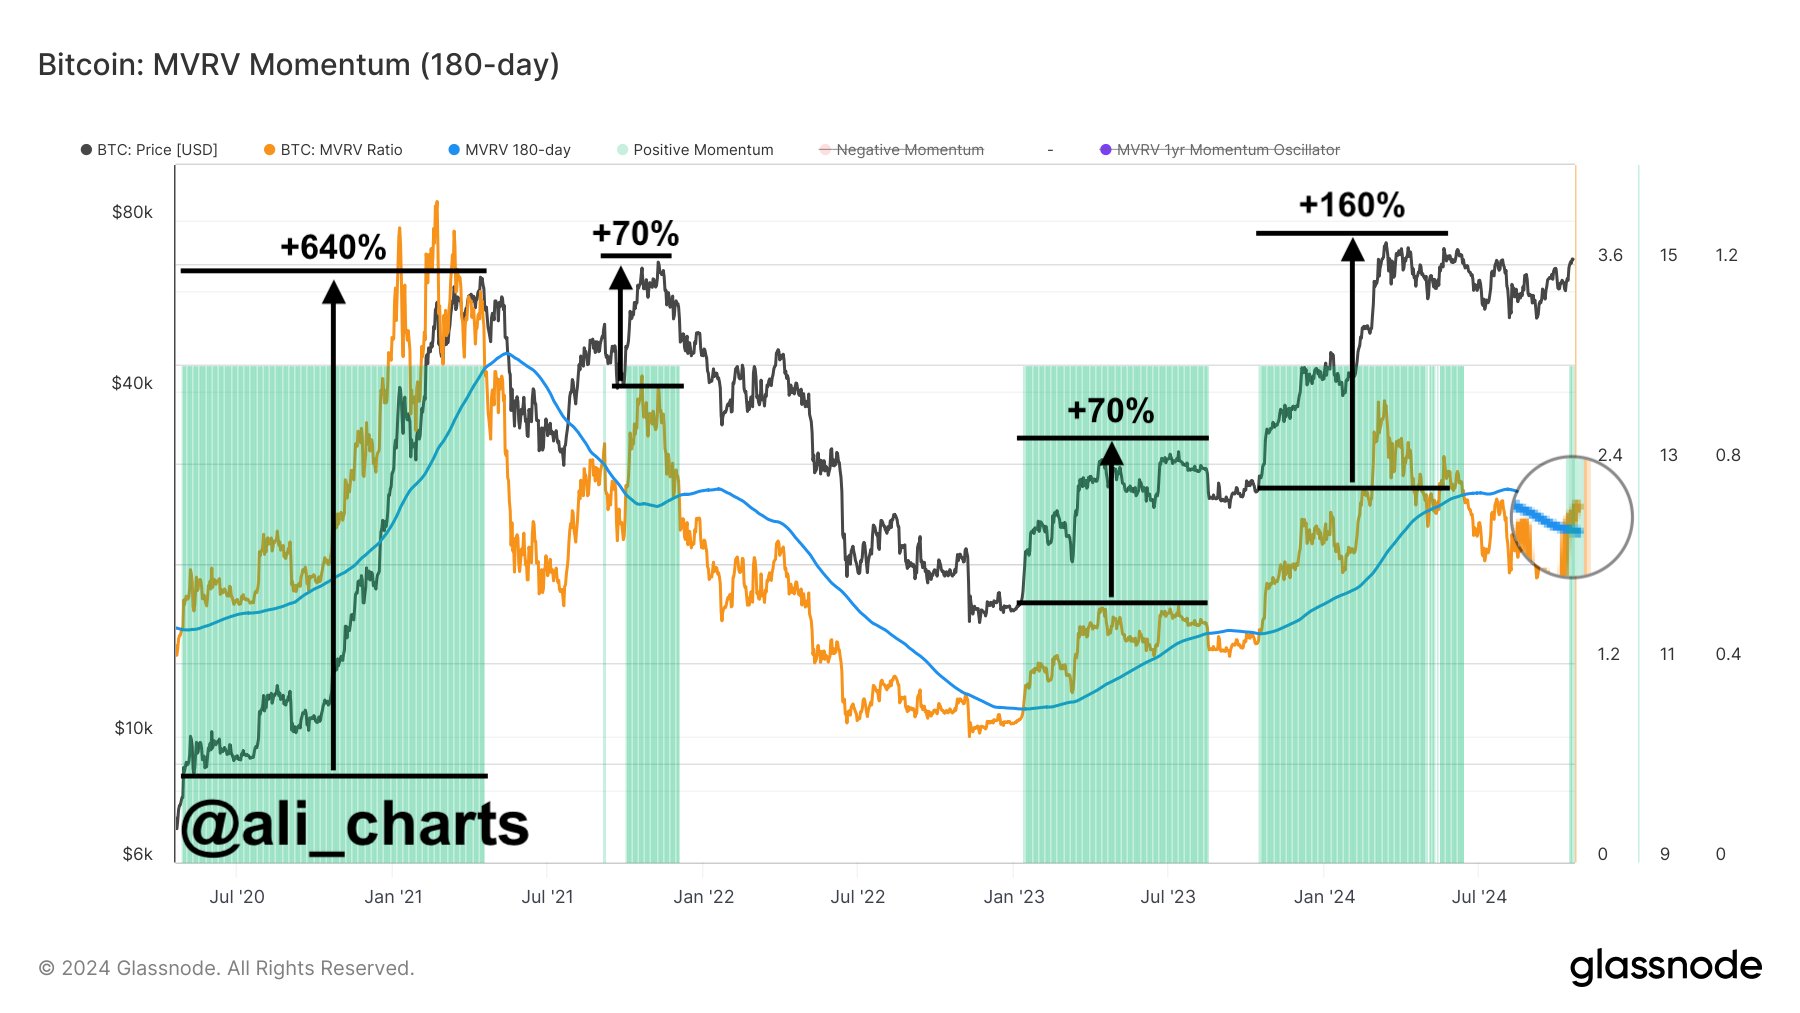
As displayed in the above graph, the Bitcoin MVRV Ratio has seen a surge recently as the asset’s price has gone through its recovery run, implying investor profitability has improved.
With this increase, the indicator has now broken above its 180-day MA. Historically, a surge beyond this line has meant that the momentum of the metric has flipped to positive, which has proven to be a bullish predictor for the price.
In the chart, the analyst highlighted the previous rallies that followed a momentum flip in the MVRV Ratio. BTC appeared to have seen surges of at least 70% on each of the last four occasions.
Going by this precedent, the latest change in the MVRV Ratio momentum to green may again lead to a surge for Bitcoin. It only remains to be seen, though, whether any such rally would be of a comparable scale to the previous ones or not.
BTC Price
At the time of writing, Bitcoin is trading at around $67,500, up almost 3% over the last week.
Recommended Articles


