SUI Price Forecast: On-chain metrics and technical indicators show bearish bias

Source Fxstreet
  • SUI’s technical analysis shows a formation of bearish divergence on a momentum indicator.
  • On-chain data suggests a bearish outlook for SUI as the long-to-short ratio is below one, and daily trading volume is decreasing.
  • A daily candlestick close above $2.17 would invalidate the bearish thesis.

Sui (SUI) price continues to decline on Tuesday after reaching a new all-time high of $2.36 on October 13. Technical analysis and onchain data further support a short-term decline, as the formation of bearish divergence on a momentum indicator and decreasing trading volume suggest a weakening upward momentum.

Sui price shows signs of weakness

Sui’s price reached a new all-time high of $2.36 on October 13, which began declining over 14% in the next eight days. At the time of writing on Tuesday, it trades slightly down around $2.00.

Moreover, the Relative Strength Index (RSI) and the Awesome Oscillator (AO) indicator support suggest a bearish outlook in the daily chart. The higher high in SUI’s price formed on October 13 does not reflect the RSI lower high for the same period. This development is termed a bearish divergence, often leading to a trend reversal or short-term crash.

If SUI continues its decline, it could crash 18% from its current trading level of $2.00 to retest its 61.8% Fibonacci retracement level (drawn from August’s low of $0.46 to October’s high of $2.36) at $1.64.
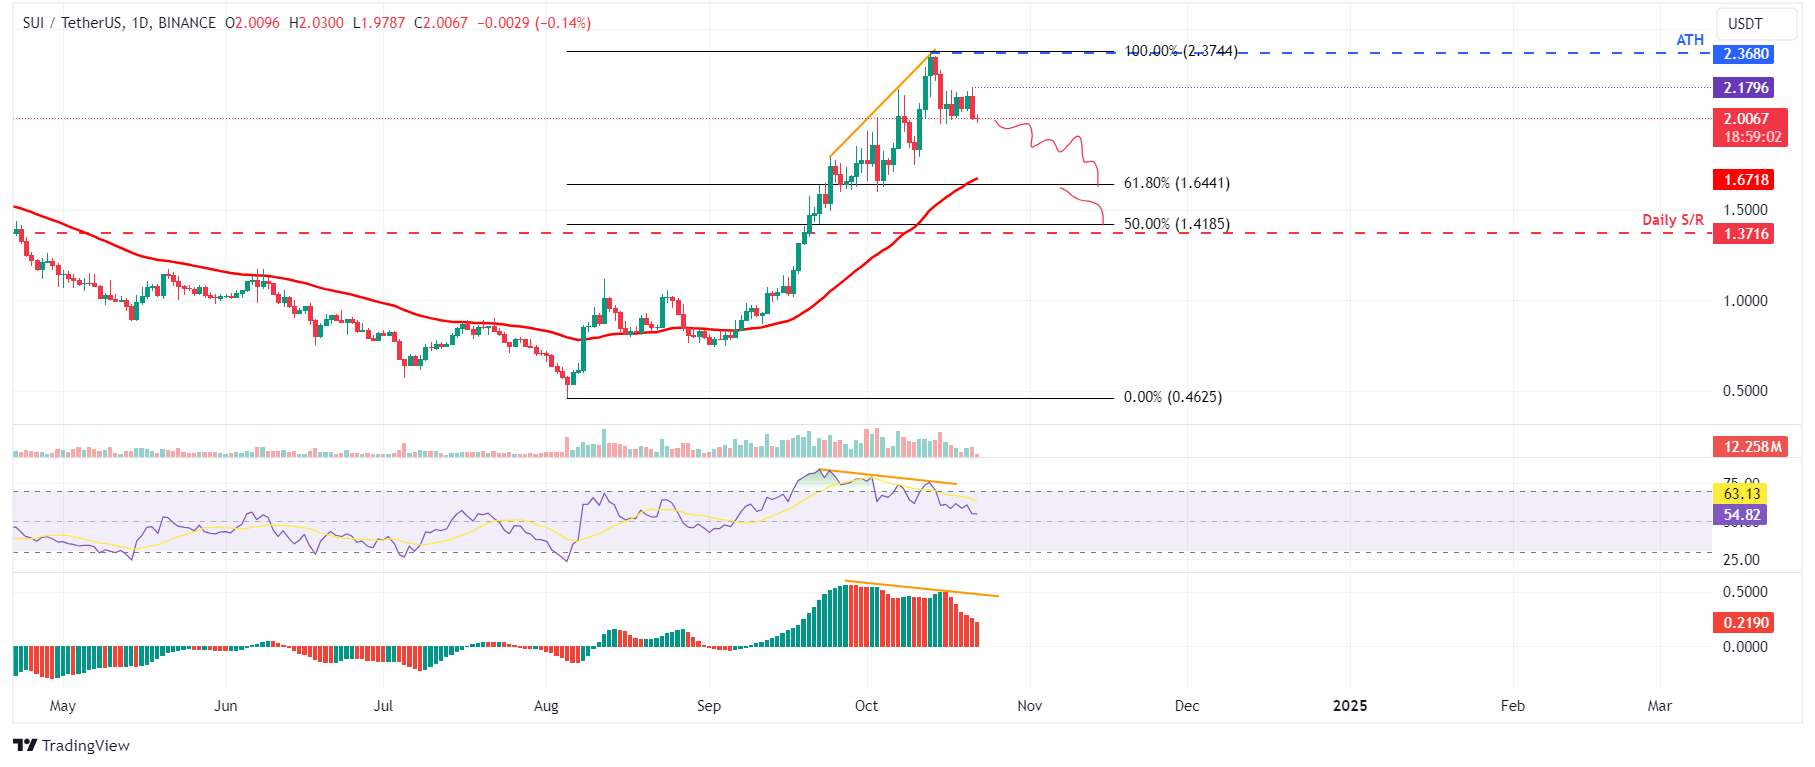
SUI/USDT daily chart

SUI/USDT daily chart

Coinglass’s data also aligns with the bearish outlook. Sui’s long-to-short ratio is 0.866, the lowest level in one month. This ratio reflects bearish sentiment in the market, as the number below one suggests that more traders anticipate the asset’s price to fall.

SUI long-to-short ratio chart. Source: Coinglass

SUI long-to-short ratio chart. Source: Coinglas

Another aspect bolstering the platform’s bearish outlook is a recent decline in traders’ interest and liquidity in the SUI chain. Coinglass data shows that SUI’s daily trading volume declined from  $4.02 billion on October 16 to $1.05 billion on Sunday, consistently declining since early October.

SUI daily trading volume chart. Source: Coinglass

SUI daily trading volume chart. Source: Coinglass

However, the bearish thesis would be invalidated if the Sui price closes above $2.17. This scenario could lead to a rally in Sui’s price to retest its all-time high of $2.36.

Disclaimer: For information purposes only. Past performance is not indicative of future results.
placeholder
EURUSD Long-term Forecast: Can ECB Hawks Overcome the Dollar Bullishness? As one of the most traded currency pair in the forex markets, the price of EURUSD affects many traders. Check out our EURUSD long-term forecast for more information.
Author  Mitrade
Mar 13, 2023
As one of the most traded currency pair in the forex markets, the price of EURUSD affects many traders. Check out our EURUSD long-term forecast for more information.
placeholder
Copper Long-term forecast: Will Copper Price Expected To Soar In 2023?The price of copper is affected by various of factors. You may wonder how the price of cooper will be in 2023, check out our forecast analysis.
Author  Mitrade
Mar 13, 2023
The price of copper is affected by various of factors. You may wonder how the price of cooper will be in 2023, check out our forecast analysis.
placeholder
Bitcoin CME gaps at $35,000, $27,000 and $21,000, which one gets filled first?Prioritize filling the $27,000 gap and even try higher.
Author  FXStreet
Aug 21, 2023
Prioritize filling the $27,000 gap and even try higher.
placeholder
Natural Gas sinks to pivotal level as China’s demand slumpsNatural Gas price (XNG/USD) edges lower and sinks to $2.56 on Monday, extending its losing streak for the fifth day in a row. The move comes on the back of China cutting its Liquified Natural Gas (LNG) imports after prices rose above $3.0 in June. It
Author  FXStreet
Jul 01, Mon
Natural Gas price (XNG/USD) edges lower and sinks to $2.56 on Monday, extending its losing streak for the fifth day in a row. The move comes on the back of China cutting its Liquified Natural Gas (LNG) imports after prices rose above $3.0 in June. It
placeholder
Weekly Market Outlook: Tesla Kicks Off Big Tech Earnings; U.S. Election Enters Final StretchTradingKey – This week, key economic data includes U.S. September durable goods orders, the University of Michigan’s October Consumer Sentiment Index, and preliminary PMI data from several countries,
Author  Mitrade
22 hours ago
TradingKey – This week, key economic data includes U.S. September durable goods orders, the University of Michigan’s October Consumer Sentiment Index, and preliminary PMI data from several countries,
goTop
quote