Solana (SOL) Ready to Break Key Resistance With $200 In Sight
Solana’s (SOL) price could be on the brink of a breakout, with indicators suggesting that the altcoin’s value might return to an important milestone that investors have been yearning for.
Currently, SOL’s price is $142.57, down 45% from its all-time high. In this analysis, BeInCrypto highlights how a certain technical pattern could help validate a successful breakout and the cryptocurrency’s targets in the coming weeks.
Solana Looks Ready to Smash Through Resistance
On October 1, Solana’s price was $158.50 and hinted at a possible rally toward $180. However, as soon as the token attempted to rise above $160, bears forced it back, eventually driving the price below $145.
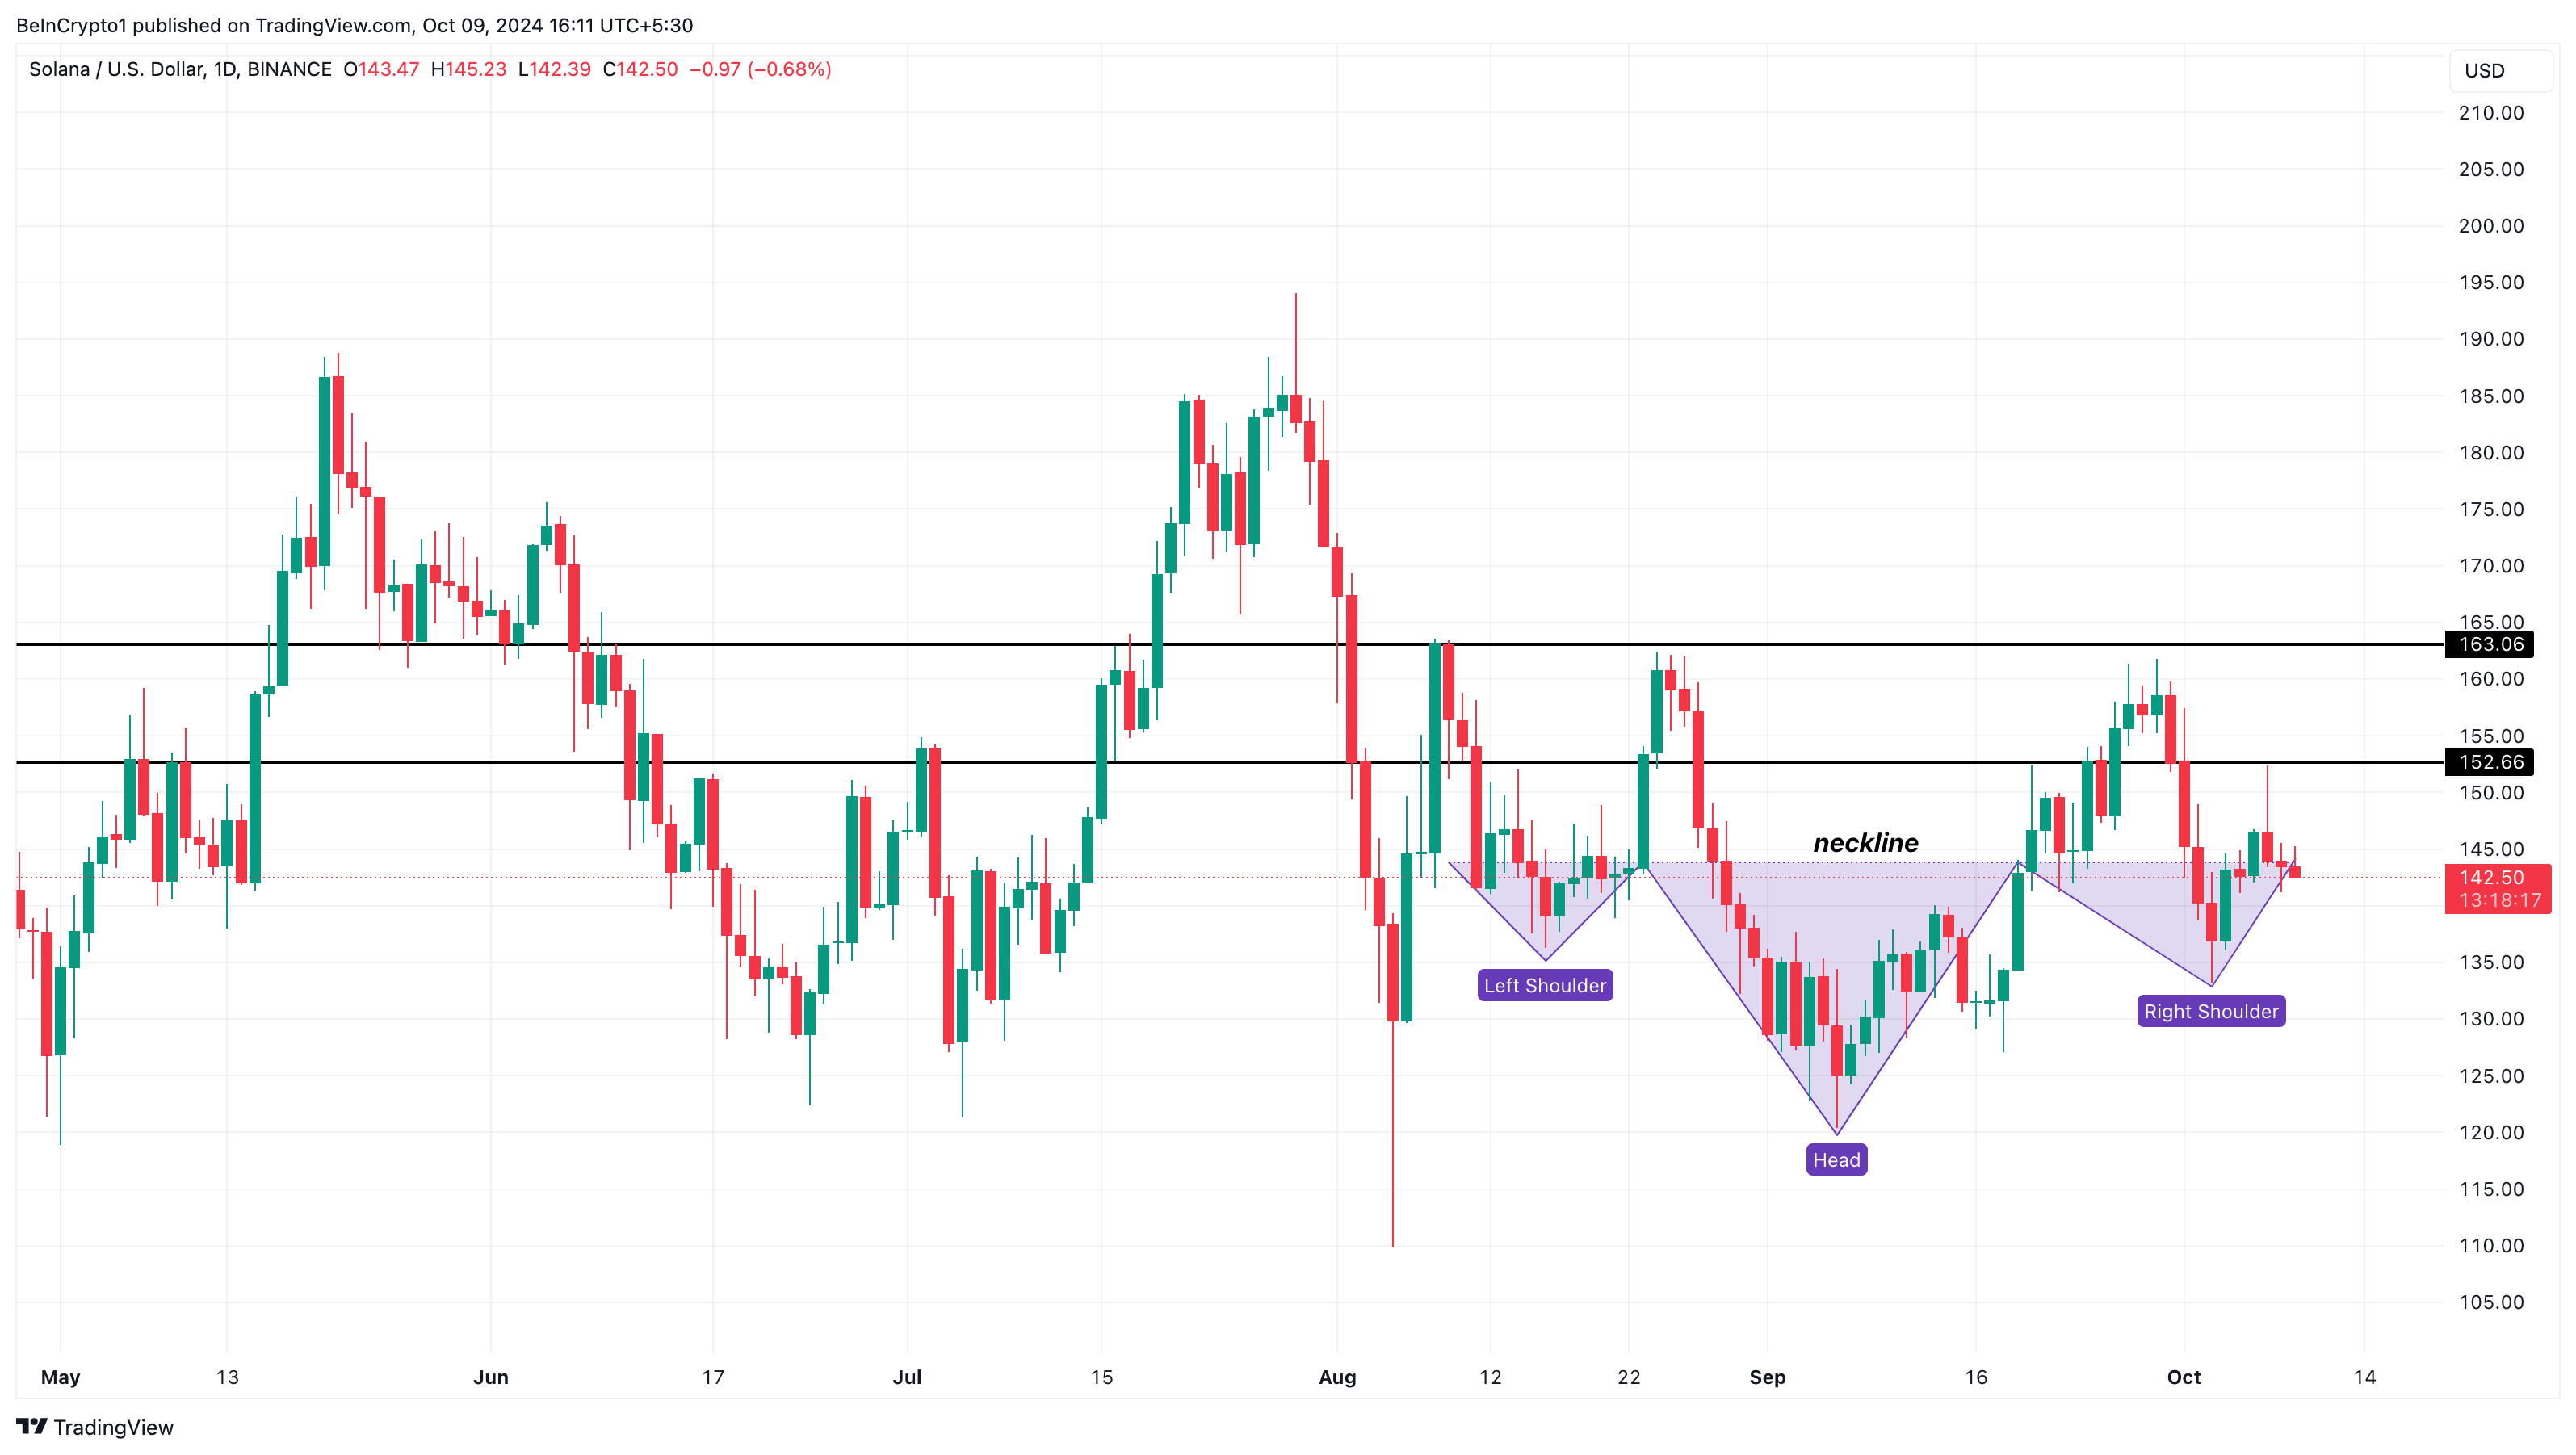
Despite the decline, the daily SOL/USD chart shows that the cryptocurrency could soon be due for a rebound. This rationale is largely due to the formation of an inverse head-and-shoulders pattern.
This technical pattern features three successive lows, with the left and right shoulders being shallower than the head. Typically, this formation indicates a bearish-to-bullish reversal, suggesting the conclusion of a downtrend.
Read more: Solana vs. Ethereum: An Ultimate Comparison
 Solana Daily Price Analysis. Source: TradingView
However, to validate the thesis, Solana’s price needs to move above the neckline at around $145. Once that happens and buying pressure increases, the altcoin’s price could break the $152.66 and $163.06 overhead resistance.
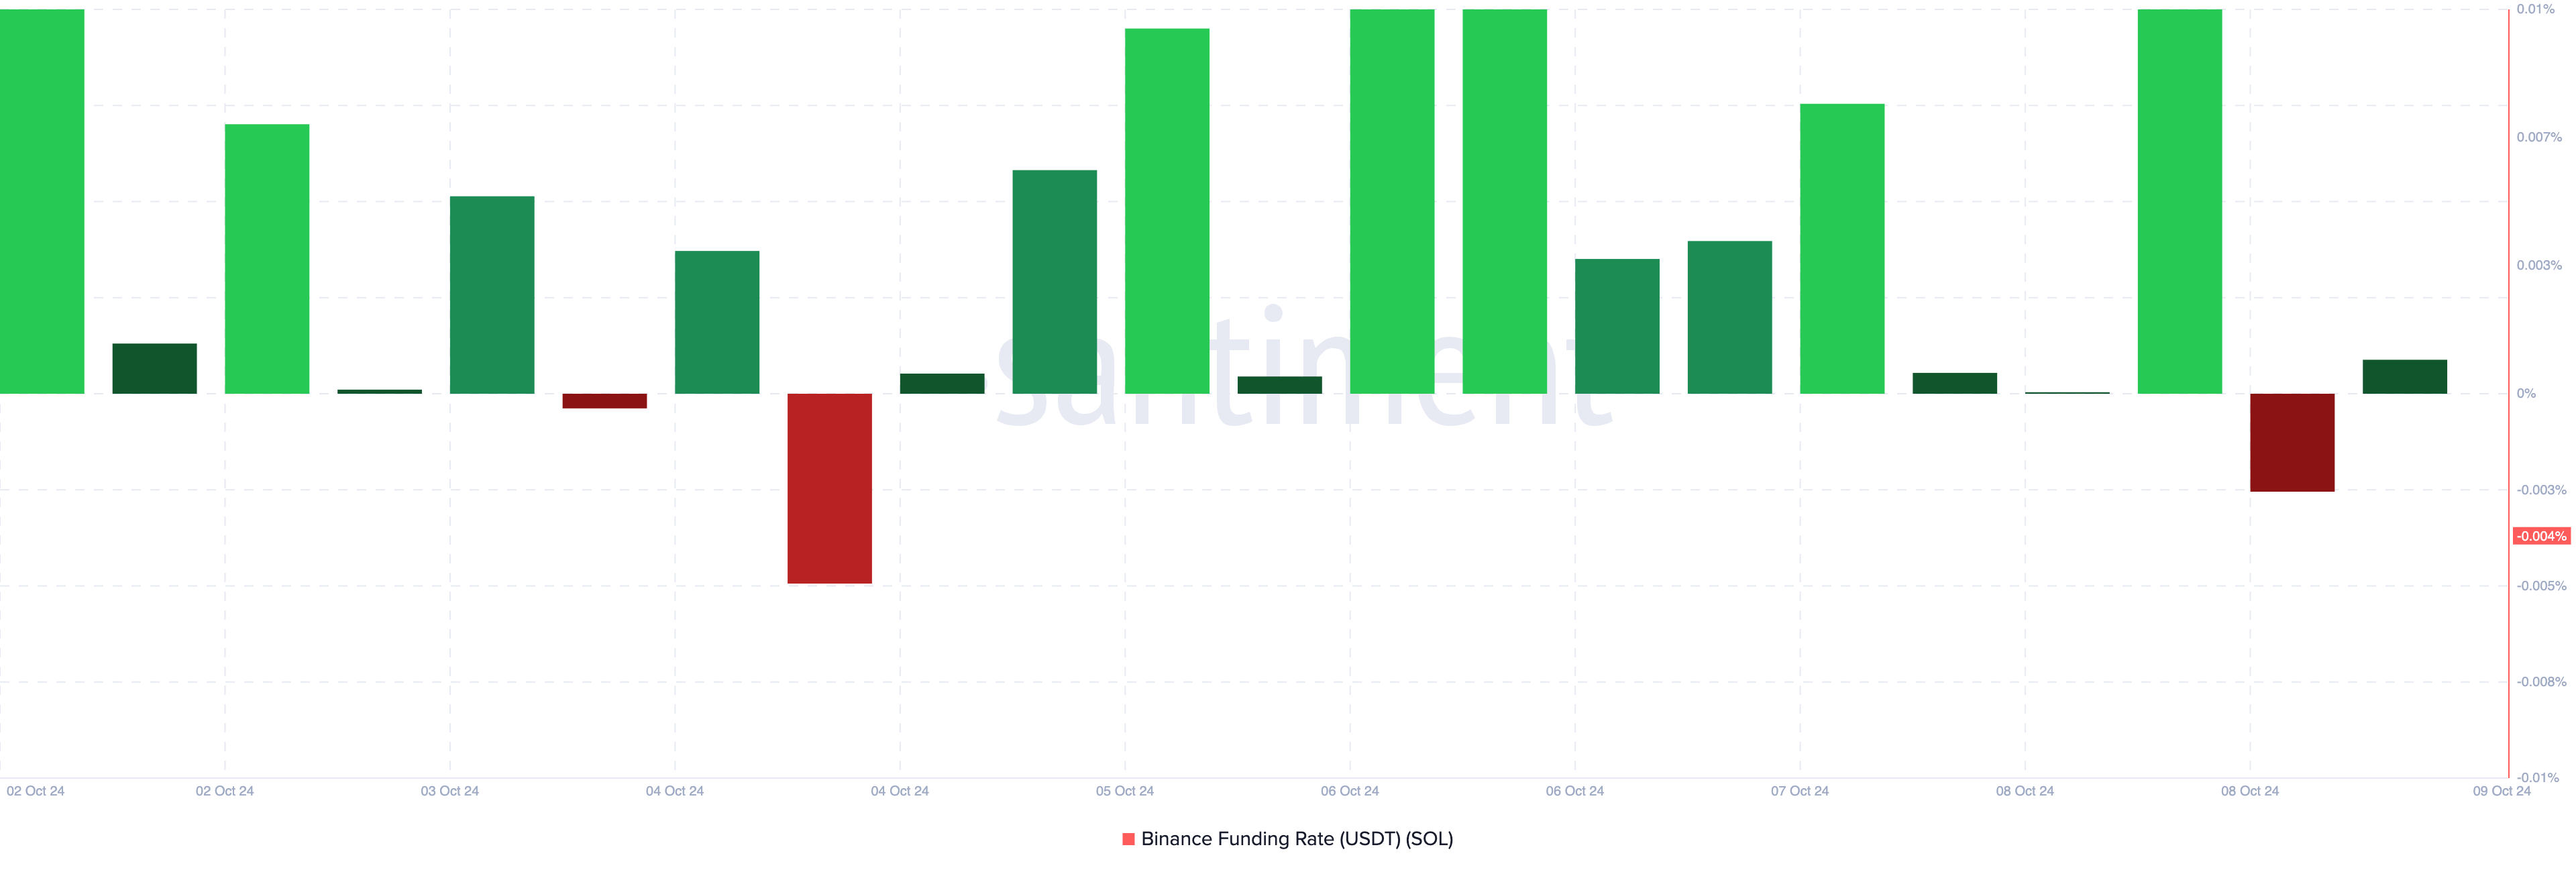
This thesis is also supported by the Funding Rate, which measures traders’ position in the market. When the Funding Rate is positive, longs (buyers) are paying shorts (sellers), and the average expectation is a price increase.
On the flip side, a negative Funding Rate indicates that shorts are paying longs, with most traders anticipating a decline. Yesterday, the metric was negative, but as of this writing, it has returned to the positive region, suggesting that increasing long positions could contribute to Solana’s price recovery.
 Solana Funding Rate. Source: Santiment
SOL Price Prediction: Rally Incoming
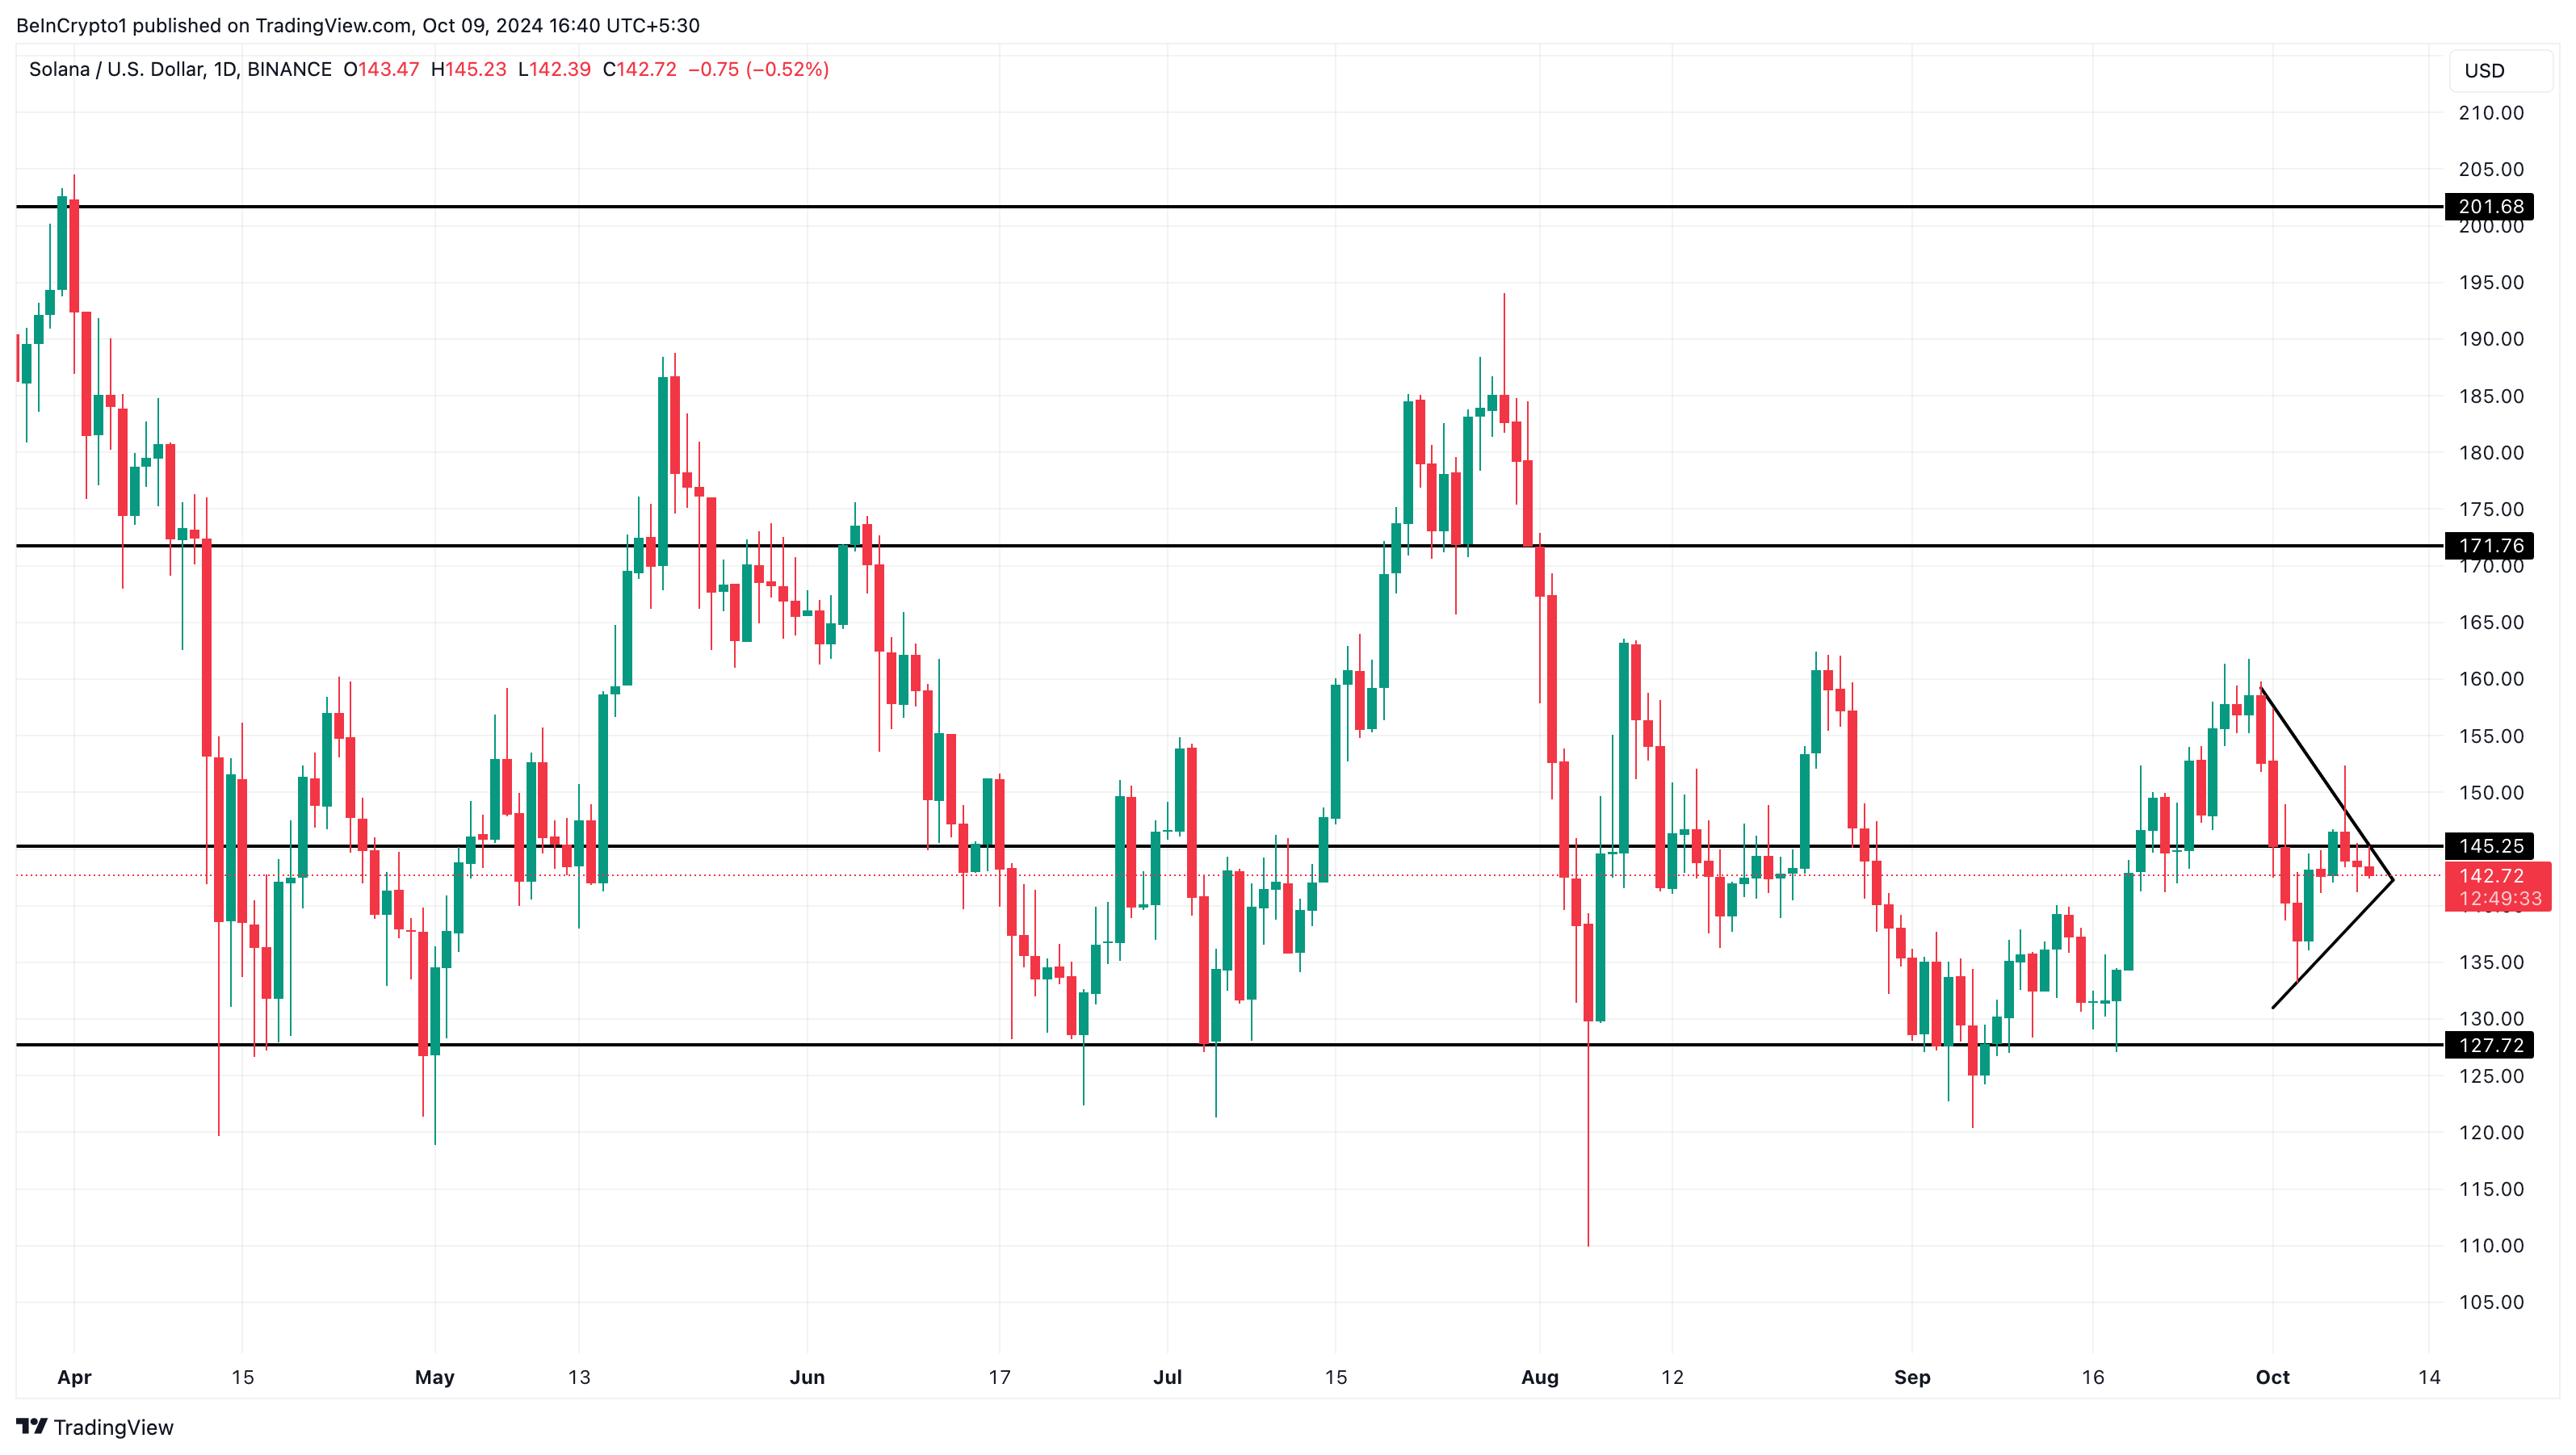
A closer look at Solana’s daily chart reveals that its price is nearing a breakout from a symmetrical triangle pattern, formed by converging falling and rising trendlines of equal slopes.
This pattern can signal either a bullish or bearish outcome. However, the current setup suggests SOL may break through the $145 resistance level. If this breakout is confirmed, the next target could be around $171.76, opening the possibility for a climb beyond $200.
Read more: 13 Best Solana (SOL) Wallets To Consider in October 2024
 Solana Daily Price Analysis. Source: TradingView
Conversely, if bulls fail to push the price above $145, Solana could face a decline, potentially dropping to $127.72.


