
VeChain price prediction 2024-2030: What’s the growth potential of VET?
Key takeaways
- VeChain price projection suggests a peak price of $0.0506 by December 2024.
- Traders can expect a minimum price of $0.0891 and a maximum price of $0.11 by 2027.
- By 2030, VeChain’s price could potentially surge to $0.16.
Despite occasional market volatility and regulatory uncertainties, VeChain demonstrates resilience and a strong value proposition, positioning itself as a leader in blockchain-based solutions for supply chain transparency, product authentication, and data management.
Overall, the prevailing sentiment within the VeChain community is one of optimism and confidence, with stakeholders bullish on its long-term prospects and the transformative impact of blockchain technology. As VeChain continues to expand its reach and enhance its offerings, questions surrounding its price trajectory persist, inviting further analysis and exploration of its future potential.
VeChain overview
| Cryptocurrency | VeChain |
| Token | VET |
| Price | $0.0226 |
| Market Cap | $1.82 B |
| Trading Volume (24-h) | $10.97 M |
| Circulating Supply | 80.99B VET |
| All-time High | $0.2782, Apr 17, 2021 |
| All-time Low | $0.001678, Mar 13, 2020 |
| 24-h High | $0.0233 |
| 24-h Low | $0.02229 |
VeChain price prediction: Technical analysis
| Volatility | -4.04% |
| Sentiment | Bullish |
| 50-Day SMA | $0.0227 |
| 200-Day SMA | $0.0320 |
| Price Prediction | $0.0516 (114.94%) |
| F & G Index | 17.88 (extreme fear) |
| Green Days | 13/30 (44%) |
| 14-Day RSI | 68.55 |
VeChain price analysis
TL;DR Breakdown
- VeChain price analysis shows a bearish outlook.
- The VET coin has fallen by over 4% at the time of writing.
- VeChain prices have sought support and resistance at $0.02400 and $0.02500, respectively.
The VeChain price analysis for October 8 shows VET has fallen towards the $0.024 mark as bulls get rejected at $0.027. This bullish support has enabled the price to return to $0.02260, but the selling pressure at $0.02300 is still strong. The broader cryptocurrency market observed bearish sentiment over the last 24 hours as most major cryptocurrencies recorded negative price movements. Major players include DOT and ADA, which recorded a 6.36 and 5.03 percent decline, respectively.
VeChain price analysis 1-day chart: VET returns to $0.02260 after rejection at $0.02700
The 24-hour VET/USD price chart indicates a broader downward trend as prices move toward the $0.024 level. The lack of bullish support between $0.027 and $0.02260 suggests strong bearish activity in the short-term markets, which has dictated price action in the mid-term charts.

The indicators reflect a declining bearish dominance, as all three major technical indicators signal a reversing bearish trend. The MACD is bearish but only at 0.00023, showing low bullish momentum. The EMAs are below the mean position, and the indicator shows a slight bullish momentum. The RSI also shares this sentiment, falling to 45.83 from the 70.00 index level. The converging Bollinger Bands suggest decreasing volatility, indicating that the $0.02260 support may hold for the short term.
VeChain price analysis 4-hour chart
The 4-hour price chart of VET shows a steady decline as the price fell from above the $0.032 mark to the $0.019 support. The bearish rejection was unexpected as the price moved rapidly from the $0.02700 mark to the $0.02260 mark where it currently trades.

The RSI is at 42.17, suggesting that the asset is at the bottom of the neutral zone, which indicates room for a further short-term price decrease. Moreover, the downward slope suggests further downwards movement to the $0.02260 level instead of a recovery back to the $0.02500 mark. The MACD suggests declining bearish momentum, with the indicator at -0.00020. These indicators collectively suggest rising bullish pressure.
VeChain technical indicators: Levels and action
Daily simple moving average (SMA)
| Period | Value | Action |
|---|---|---|
| SMA 3 | $ 0.023188 | SELL |
| SMA 5 | $ 0.02277 | BUY |
| SMA 10 | $ 0.023775 | SELL |
| SMA 21 | $ 0.024347 | SELL |
| SMA 50 | $ 0.023309 | SELL |
| SMA 100 | $ 0.024858 | SELL |
| SMA 200 | $ 0.031068 | SELL |
Daily exponential moving average (EMA)
| Period | Value | Action |
|---|---|---|
| EMA 3 | $ 0.023596 | SELL |
| EMA 5 | $ 0.023399 | SELL |
| EMA 10 | $ 0.023287 | SELL |
| EMA 21 | $ 0.02374 | SELL |
| EMA 50 | $ 0.025425 | SELL |
| EMA 100 | $ 0.028058 | SELL |
| EMA 200 | $ 0.030107 | SELL |
What to expect from VeChain price analysis?

The VeChain price analysis shows that the VeChain market observes strong bearish momentum, causing the price to fall from the $0.03900 mark towards the $0.02100 mark. While the bulls found strong support at $0.02100 and rose back to $0.02260, the buyers find it difficult to cross the $0.02300 level.
Traders should expect VET to rise past the $0.02500 mark as the bulls continue to gain momentum across the daily charts. Moreover, the rising trade volume suggests increasing trade activity for the asset, suggesting a momentum change. As such, the price can be expected to move between the $0.02100 and $0.02400 price levels across the short-term charts. However, a decline below the $0.02100 mark may send the price to the $0.02000.
Is Vechain a good investment?
VeChain stands out in cryptocurrency because it focuses on supply chain management and enterprise solutions. It offers transparency and traceability across various industries, enhancing trust and efficiency in global trade. With partnerships with major companies and a strong emphasis on real-world applications, VeChain has significant growth potential. Its innovative use cases and practical implementations appeal to businesses seeking operational improvements. As awareness of supply chain issues continues to grow, VeChain’s relevance and adoption are expected to increase, making it an attractive investment option for those interested in blockchain technology.
Why is VET down?
VeChain’s price hit a key support level as the bears crushed support levels above the $0.02100 mark. However, the $0.02100 support has held on, and the selling momentum was crushed as the bulls held strong and rose to the $0.02700 mark before crumbling. Since then, the price has returned back to $0.02400 as the selling pressure has escalated.
Will VET reach $0.03?
Based on the current market analysis and historical performance, VeChain (VET) is highly likely to rise to $0.03 in the next few months as the bulls gain momentum in the broader cryptocurrency market.
Will VET reach $0.05?
VET is projected to reach $0.05 with predictions indicating it could exceed this value in 2025.
Will VeChain reach $0.10?
Reaching $0.10 is ambitious and would require significant adoption and market growth. While possible, it’s uncertain and would depend on multiple factors, including the movement of the broader cryptocurrency market.
Does VET have a good long-term future?
VET has a good long-term future due to its strong use cases, growing adoption, and active development team.
Recent news/opinion on Vechain
VeChain recently announced the launch of Oobit that enables VET payments across 100 million retailers across the globe via Apple iOS
VeChain price prediction October 2024
In October 2024, the price of VeChain is anticipated to reach a minimum of $0.0195. The VET price can be expected to peak at $0.0505, maintaining an average of $0.0232 by the end of the month.
| Month | Minimum Price ($) | Average Price ($) | Maximum Price ($) |
| September | 0.0195 | 0.0232 | 0.0505 |
VeChain price prediction 2024
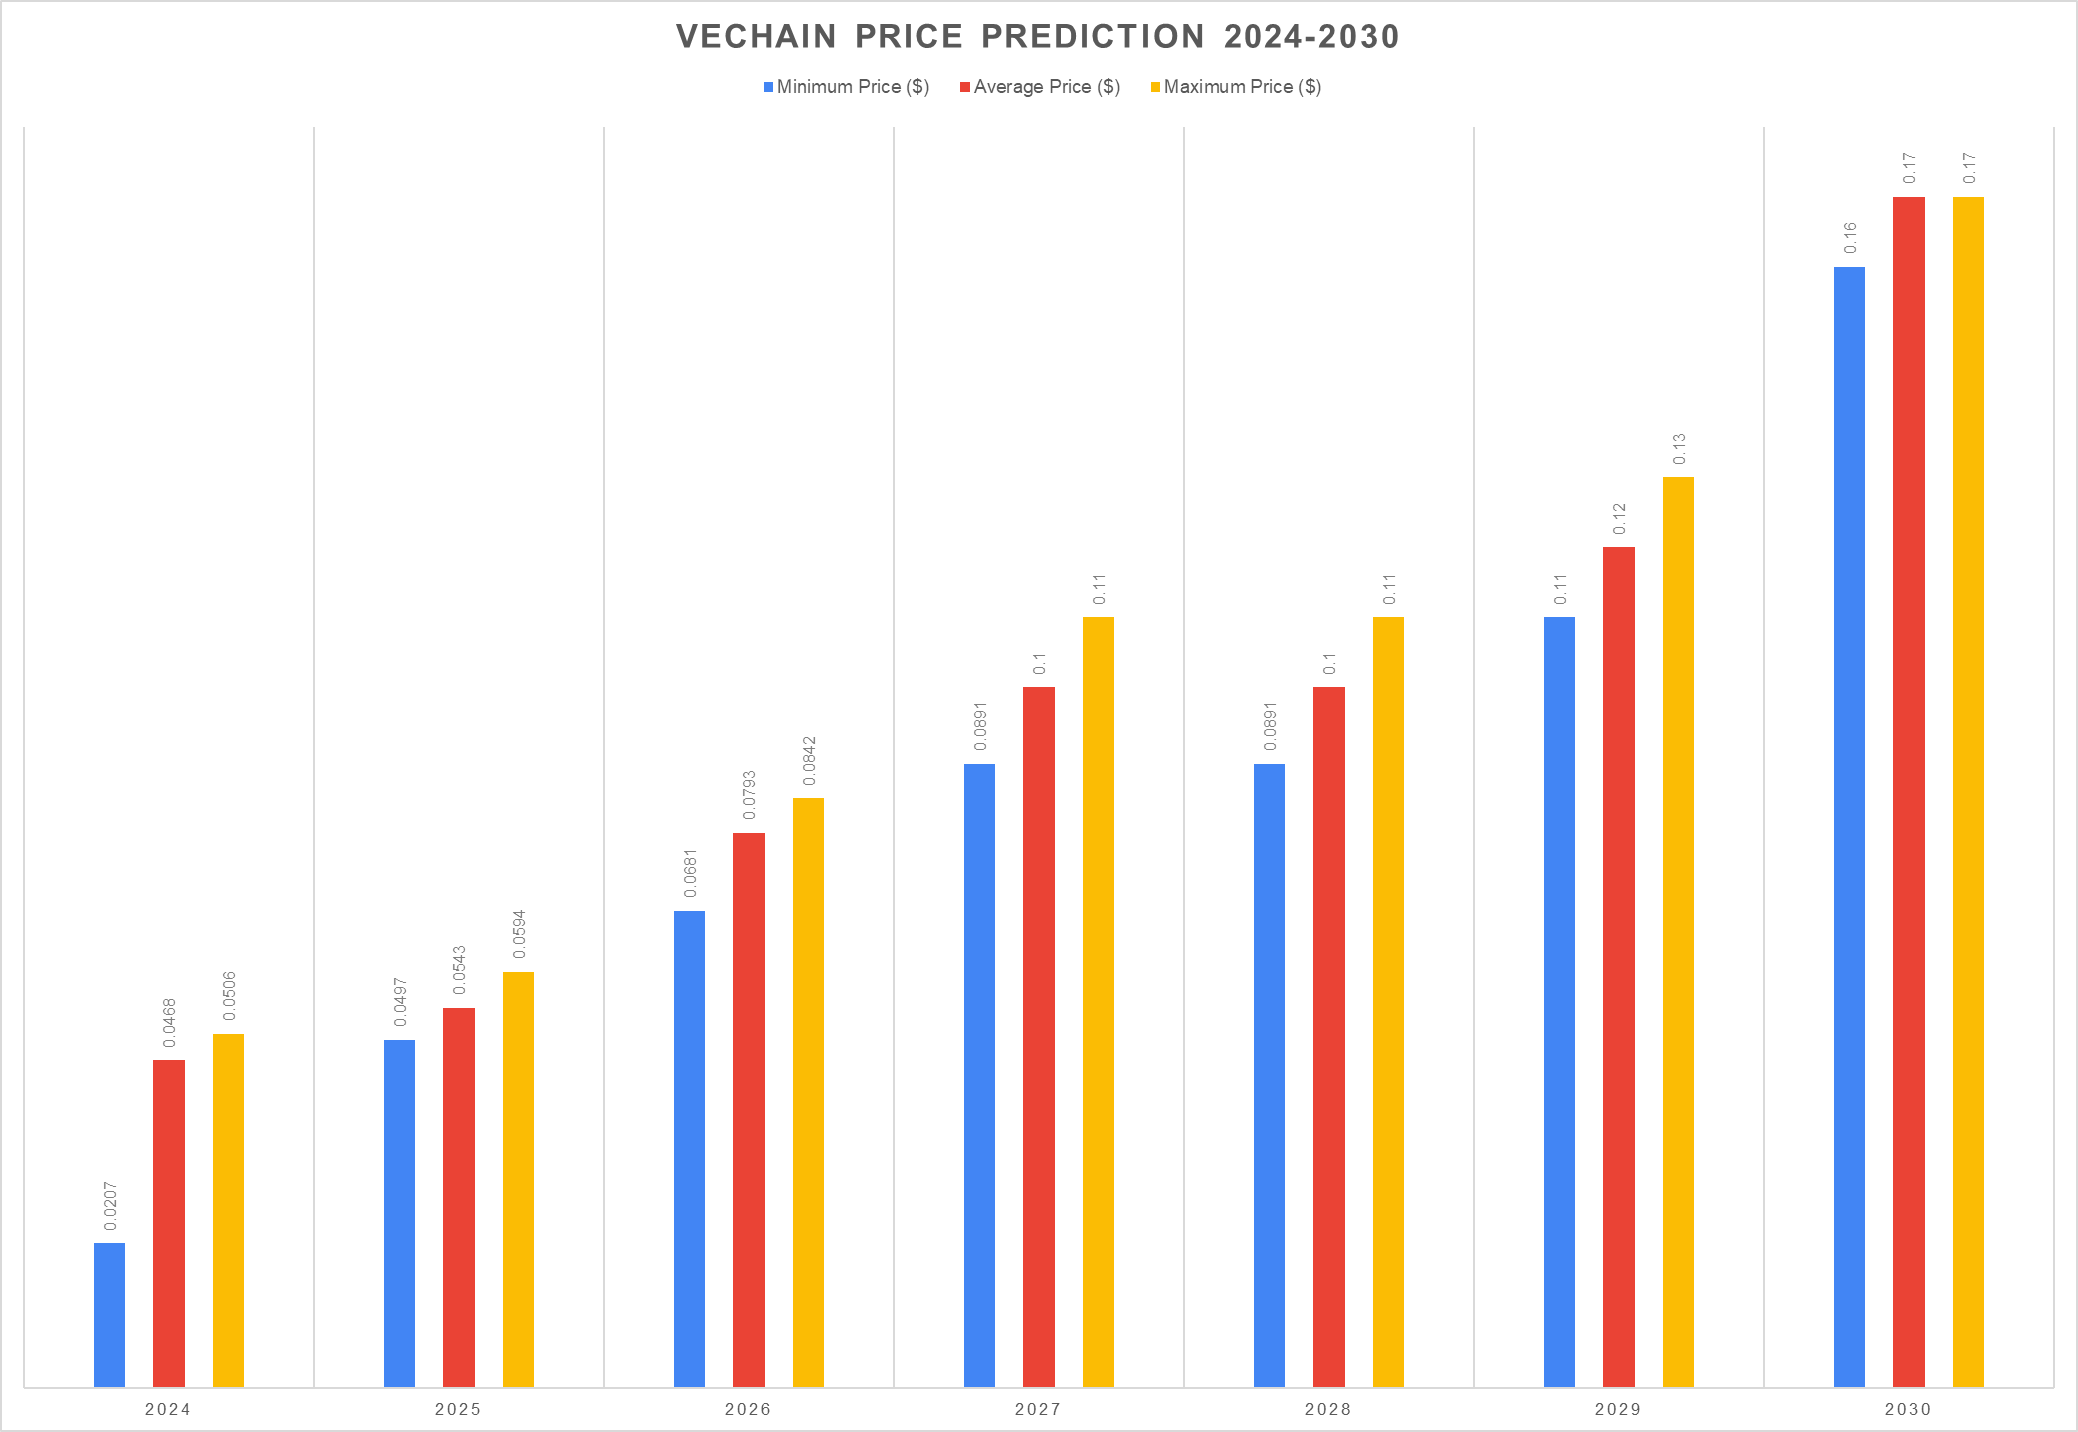
In 2024, the price of VeChain is anticipated to touch a minimum of $0.0207. The VET price might peak at $0.0506, maintaining an average of $0.0468 by the end of the year.
| Year | Minimum Price ($) | Average Price ($) | Maximum Price ($) |
| 2024 | 0.0207 | 0.0468 | 0.0506 |
VeChain price prediction 2025-2030
| Year | Minimum Price ($) | Average Price ($) | Maximum Price ($) |
| 2025 | 0.0448 | 0.0489 | 0.0535 |
| 2026 | 0.0613 | 0.0714 | 0.0758 |
| 2027 | 0.0802 | 0.0909 | 0.0948 |
| 2028 | 0.0802 | 0.0909 | 0.0948 |
| 2029 | 0.0990 | 0.11 | 0.11 |
| 2030 | 0.14 | 0.15 | 0.16 |
VeChain (VET) Price Prediction 2025
For 2025, VeChain (VET) is expected to reach a minimum price of $0.0497. It could potentially climb to a high of $0.0594, averaging around $0.0543.
VET Price Prediction 2026
By 2026, VeChain’s price is projected to trade at a minimum value of $0.0681. It might surge to a high of $0.0842, with an average price hovering around $0.0793.
VeChain (VET) Price Prediction 2027
Come 2027, VeChain is estimated to trade at a minimum of $0.0891. The price might reach a maximum price of $0.11 and an average value of $0.1.
VeChain (VET) Price Prediction 2028
In 2028, VeChain’s price will likely hit a floor of $0.0891. Based on analysis, it could peak at $0.11, with an average price of $0.1.
VeChain Price Prediction 2029
The VeChain price prediction for 2029 projects a minimum price of $0.11, a maximum price of $0.13, and an average of $0.12.
VeChain (VET) Price Prediction 2030
In 2030, VeChain could be trading at a minimum of $0.16. The price might soar to $0.17, maintaining an average of $0.17.
VeChain price prediction 2024-2030
VeChain market price prediction: Analyst’s VET price forecast
| Firm | 2024 | 2025 |
| Coincodex | $0.0333 | $0.1278 |
| DigitalCoinPrice | $0.060 | $0.080 |
| CryptoPredictions.com | $0.058 | $0.064 |
Cryptopolitan’s VeChain (VET) price prediction
Cryptopolitan’s predictions show that VeChain will achieve a high of $0.0535 in the second half of 2024. In 2025, it will range between $0.0448 and $0.0535, with an average of $0.0489. In 2030, it will range between $0.14 and $0.16, with an average of $0.15. Note the predictions are not investment advice. Seek independent professional consultation or do your research.
VeChain historic price sentiment
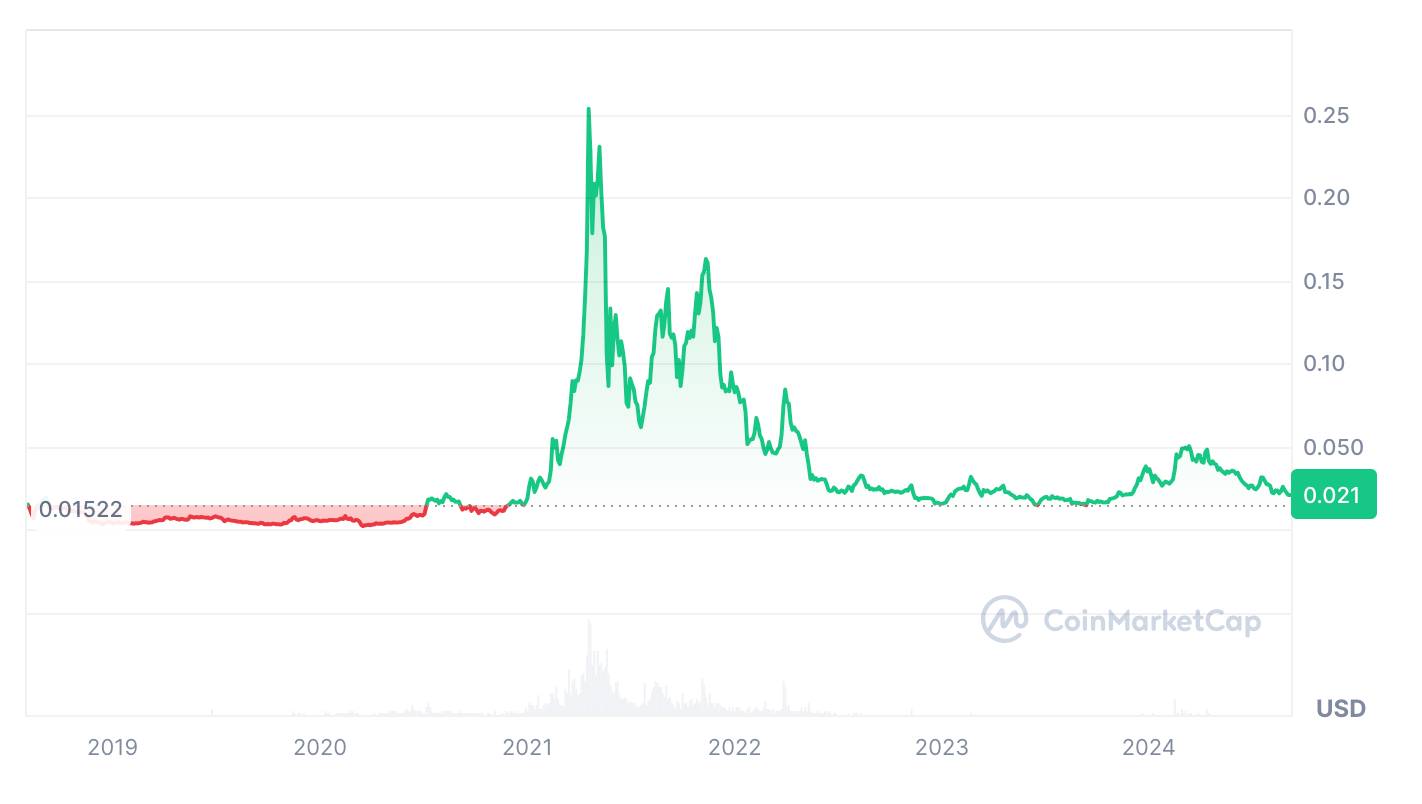
- VeChain began in 2015 as a private consortium chain for blockchain applications. It transitioned to a public blockchain with the ERC-20 token VEN in 2017 and launched its mainnet as VET in 2018.
- In 2018, VeChain partnered with DHL to develop blockchain solutions for logistics but saw a significant price correction, stabilizing at lower levels.
- The price remained relatively stable in 2019 and 2020 with occasional spikes, as VeChain continued to develop technology and form partnerships.
- In 2021, VeChain’s price surged to an all-time high of $0.20 in May but dropped to $0.070 by December.
- In 2022, VeChain attempted to recover but remained below $0.10, with continued volatility throughout the year and into early 2023.
- Towards the end of 2023, the price saw a slight uptick, stabilizing around $0.020 by early 2024.
- In 2024, VeChain’s price fluctuated, recovering to $0.025 by mid-March but dropping due to bearish trends, reaching a low of $0.019 by August.
- In September, it traded around $0.021, but managed to end the month above the $0.024 mark. In October, the bears have swung with full force as price fell to the $0.02200 support.
Recommended Articles


