
Fantom (FTM) Rallies 68% in 30 Days, but the Path to $1 Remains Unclear
Fantom (FTM) price has seen a remarkable rally in the last 30 days, surging 68% and sparking speculation of the token’s return to $1. However, despite this impressive performance, on-chain data suggest that the run toward this milestone is far from guaranteed.
FTM’s price last hit $1 six months ago. In this analysis, BeInCrypto reveals the challenges ahead and what investors should watch for.
Holders, Bitcoin Are Obstructing Fantom’s Move
On September 22, Fantom’s price hit $0.71 after the formation of an inverse head and shoulders pattern helped validate the uptrend. However, as of this writing, the value is $0.69, indicating that the FTM’s predicted run to $1 has been pegged back.
According to data from IntoTheBlock, FTM holders are largely responsible for this decline. Notably, Coins Holding Time, which measures the amount of time a cryptocurrency has been held without being sold, climbed up until October 4.
This development suggests a strong conviction in the token’s short-term potential to move higher. But over the last four days, Fantom’s Coins Holding Time has declined, suggesting that holders have booked profits off the recent hike. If sustained, this selling pressure could hinder FTM’s price from climbing higher.
Read more: How to Add Fantom to MetaMask: A Step-by-Step Guide
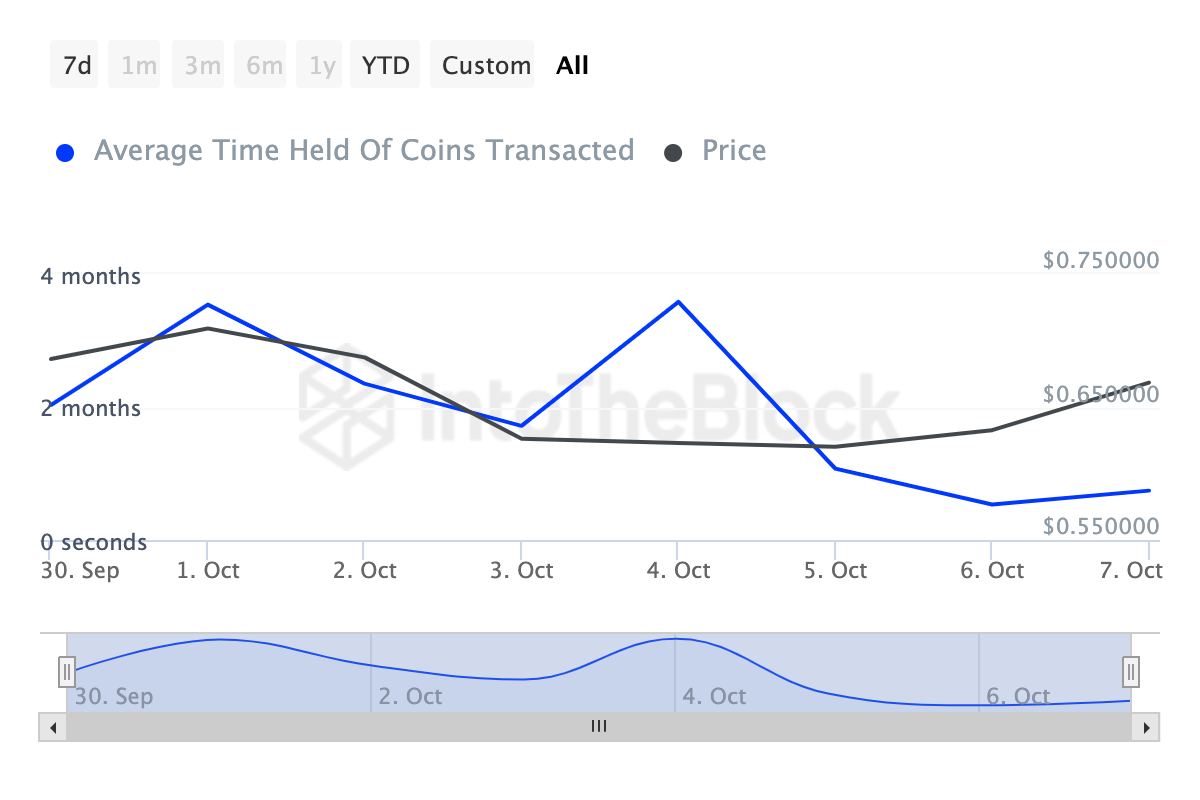 Fantom Coins Holding Time. Source: IntoTheBlock
Another factor that could hinder the cryptocurrency’s progress is its correlation with Bitcoin (BTC). Based on IntoTheBlock’s data, the 30-day correlation matrix between BTC and FTM is 0.92. This matrix or coefficient ranges from -1 to +1, where the former indicates little to no correlation while the latter signifies strong directional movement.
The current coefficient reading indicated that FTM moves in almost the same direction as Bitcoin. But recently, Bitcoin’s price, which hit $64,000 yesterday, has decreased to $62,383. As such, FTM’s price will likely follow a similar direction due to the bond the cryptocurrencies share.
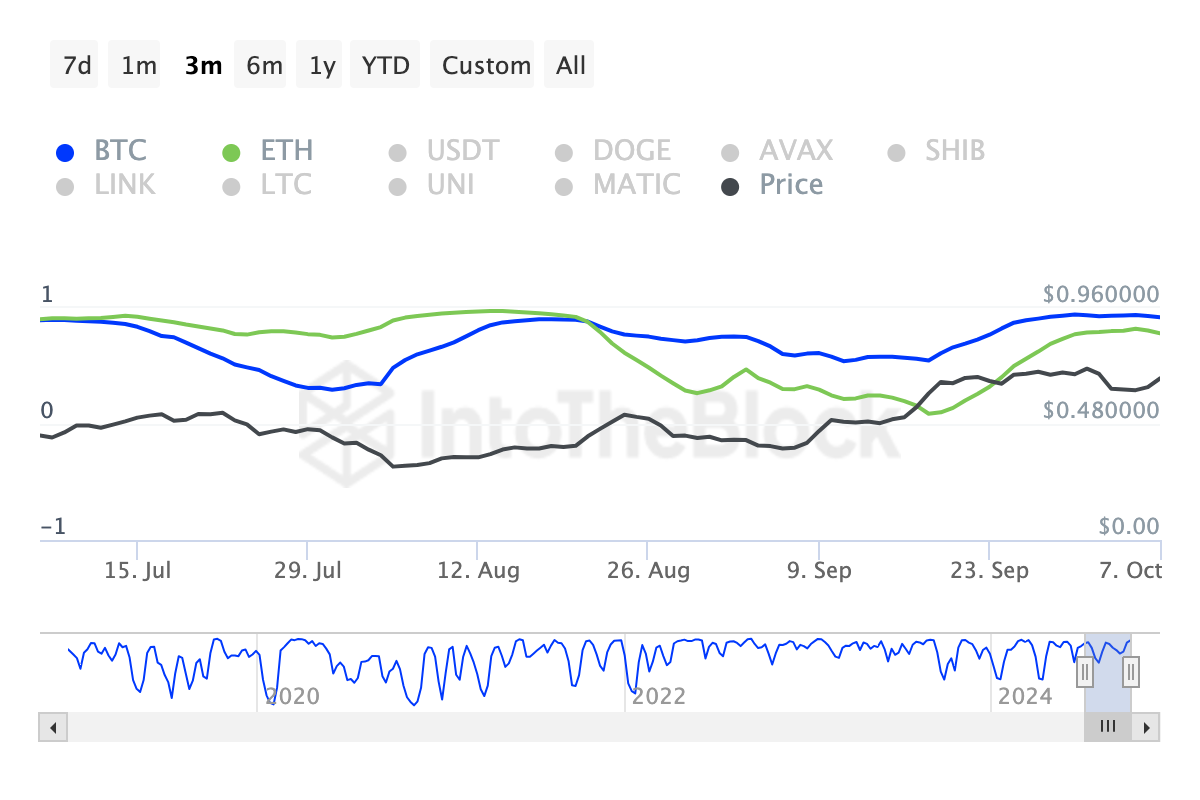 Fantom Price Correlation with Bitcoin. Source: IntoTheBlock
FTM Price Prediction: Key Obstacles Threaten $1 Target
On the daily chart, FTM’s price is getting close to the supply zone at $0.73. Historically, whenever the altcoin reaches this point, it experiences a pullback. For instance, on May 10, the price hit $0.73. But shortly after, it decline to $0.64.
A similar occurrence happened on June 8, when FTM got rejected as soon as it hit this point. Should the same pattern play out in this instance, the token’s price could decline to $0.60. Furthermore, a highly bearish scenario could see FTM’s price plunge to $0.52.
Read more: 9 Crypto Wallet Security Tips To Safeguard Your Assets
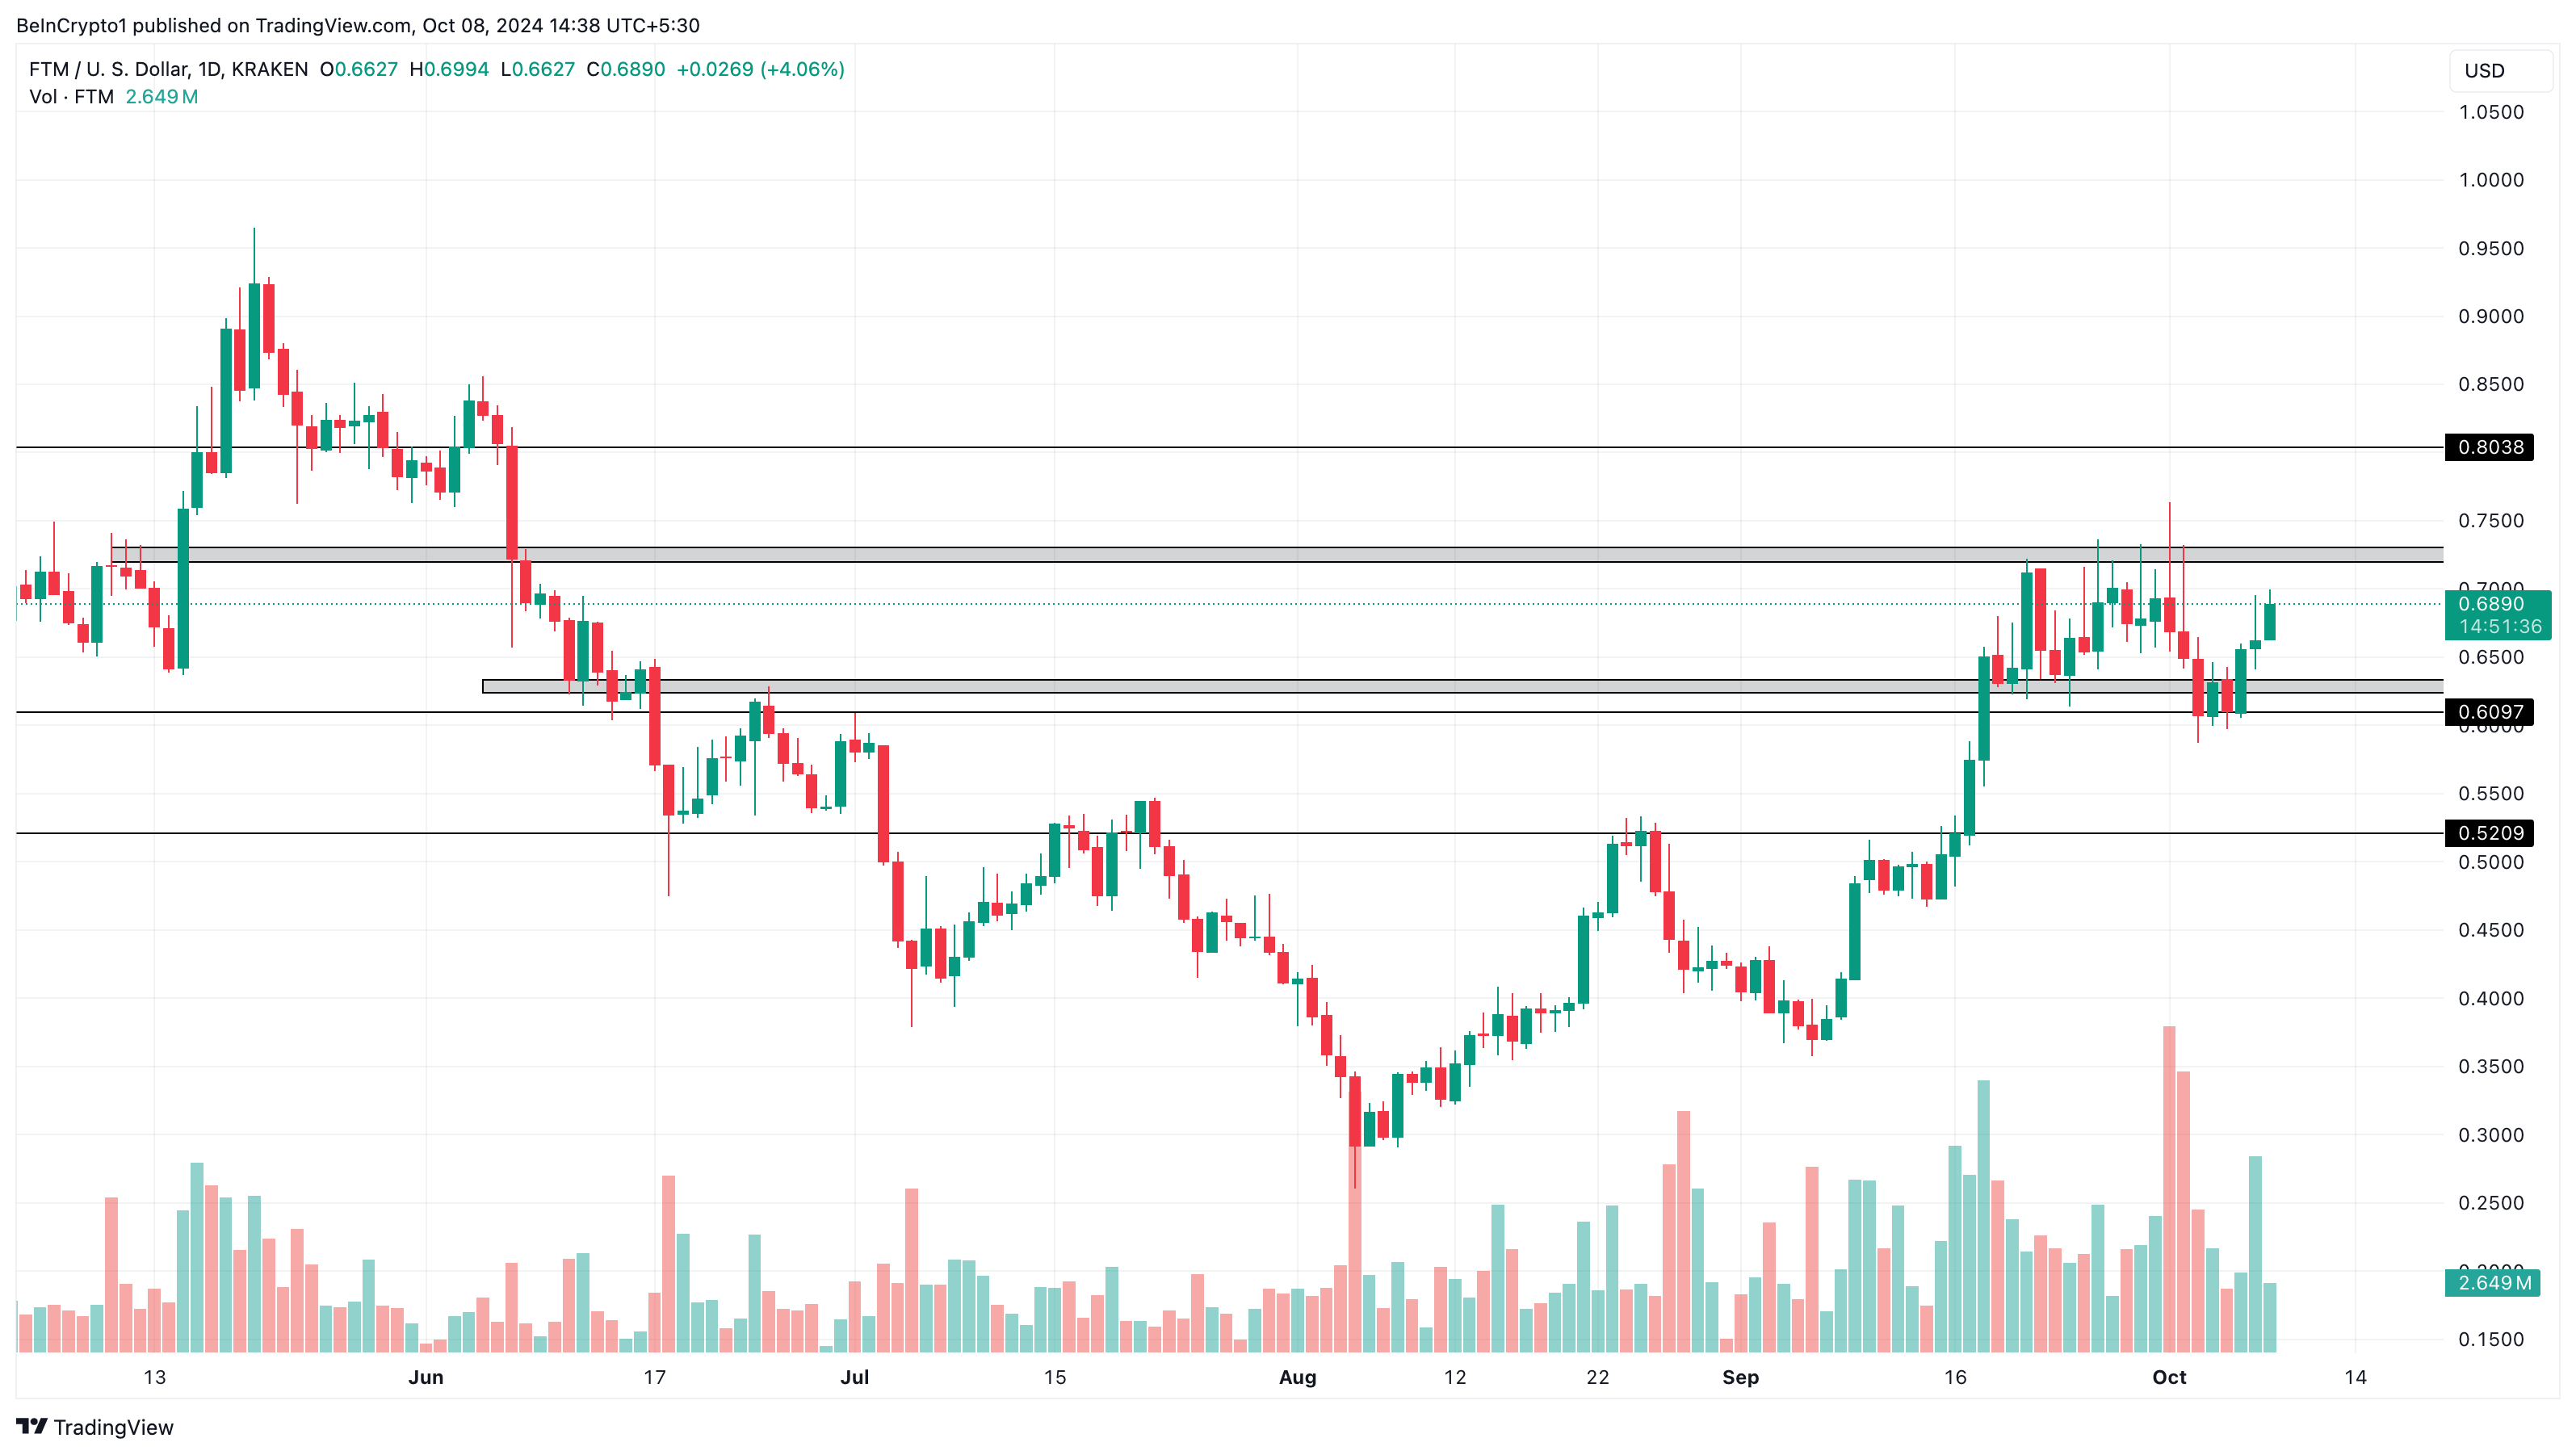 Fantom Daily Price Analysis. Source: TradingView
However, if bulls want to prevent the downside, they have to push the token well above the $0.73 resistance. If successful, the FTM/USD pair could rise to $0.80 and later toward $1 in the short term.
Recommended Articles


