Memecoin price prediction 2024 – 2030: Is MEME a wise investment?
Key takeaways:
- By 2024, the Memecoin price prediction shows it could reach a maximum price of $0.0231.
- In 2027, the price of Memecoin is predicted to reach a maximum level of $0.0454.
- Memecoin is expected to cross a price level of $0.0751 in 2030
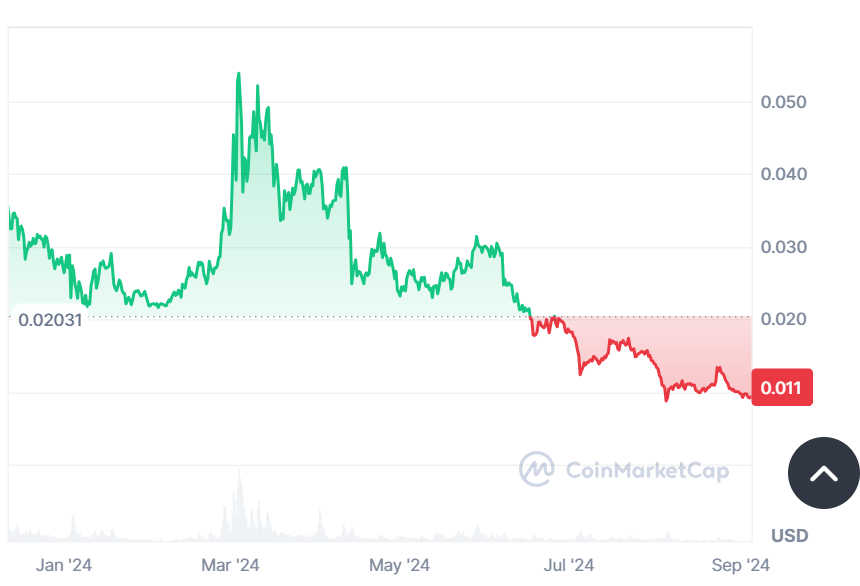
Analyzing the recent price action, MEME’s price has fluctuated significantly over the past month, with notable resistance and support levels. The bearish trend has been consistent, but the increased trading volume could indicate the potential for a reversal. Despite the current market conditions, long-term projections remain bullish due to Memecoin’s fundamental potential and market positioning.
Overview
| Cryptocurrency | Memecoin |
| Token | MEME |
| Price | $0.009893 |
| Market Cap | $268,985,197 |
| Trading Volume | $16,307,219 |
| Circulating Supply | 27,190,775,949 |
| All-time High | $0.05706 Mar 03, 2024 |
| All-time Low | $0.01706 Nov 07, 2023 |
| 24-hour High | $0.01024 |
| 24-hour Low | $0.009617 |
Memecoin price prediction: Technical analysis
| Metric | Value |
| Price Prediction | $ 0.032254 (226.38%) |
| Volatility | 10.26% |
| 50-Day SMA | $ 0.010736 |
| 14-Day RSI | 43.18 |
| Sentiment | Bearish |
| Fear & Greed Index | 50 (Neutral) |
| Green Days | 16/30 (53%) |
| 200-Day SMA | $ 0.021127 |
Memecoin MEME price analysis: MEME shows volatile movements amidst a recovering crypto market
Key takeaways:
- Memecoin price analysis shows an uptrend.
- MEME faces volatility with $0.0103 as key support.
- RSI indicates MEME is neither overbought nor oversold.
Memecoin MEME has experienced fluctuating price movements today, reflecting the broader volatility within the cryptocurrency market. It is trading at $0.01019, marking a 1.88% increase over the last 24 hours. The market capitalization currently is at $278.23 million, up 2.30%, highlighting renewed interest and increasing demand for MEME among investors. The 24-hour trading volume surged by a significant 73.48% to reach $28.21 million, suggesting heightened buying and selling activity within the MEME ecosystem.
With a circulating supply of over 27.3 billion MEME coins, representing around 39.58% of the total supply, MEME continues to display a modest supply-side pressure. The coin’s total and max supply of 69 billion MEME gives investors an understanding of its inflationary nature, which can affect its future price trajectory. The current market sentiment, while neutral, is leaning toward recovery, driven by positive momentum in meme coins across the market. Despite a declining global trading volume, meme coins like MEME are capturing attention with their notable rise.
MEME daily chart analysis
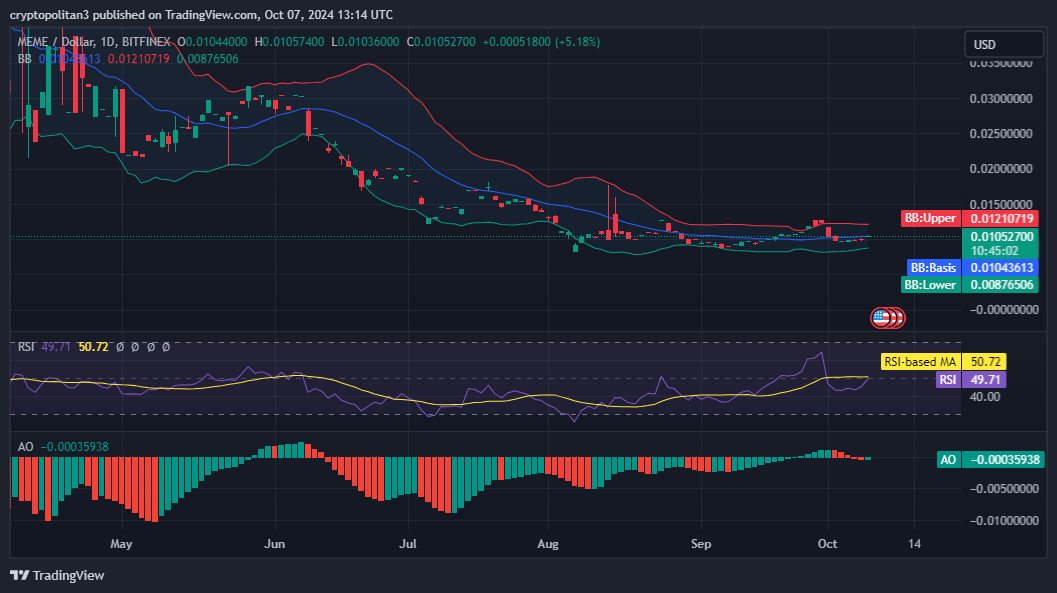
The daily chart analysis indicates that MEME has experienced significant price fluctuations within 24 hours. The price peaked early in the day at $0.0106 before returning to a low of $0.0101. The price movement shows a general uptrend in the morning, with a subsequent correction later in the day. This volatility is typical for meme coins, driven by market sentiment and speculative trading. Investors have capitalized on the early morning rally before profit-taking kicked in later.

Bollinger Bands suggests that the coin’s price is approaching the upper resistance level, indicating that the market might be preparing for another short-term correction or consolidation phase. The Relative Strength Index (RSI) is around 50.72, signaling that MEME is neither overbought nor oversold. This balanced RSI indicates that there could be room for upward or downward price movement, depending on market conditions and news events affecting the broader cryptocurrency market. The Awesome Oscillator (AO), currently below zero, signals a lack of bullish momentum in the long-term price movement.
MEME 4-hour chart analysis: MEME tests support levels
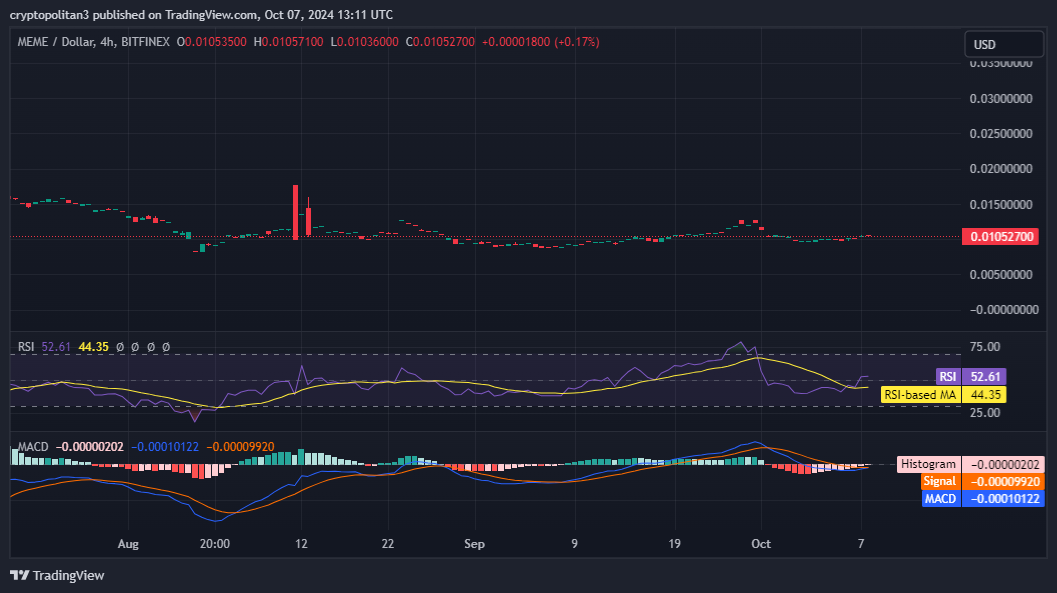
The 4-hour chart analysis reflects MEME’s ongoing consolidation after the volatility earlier in the week. Currently trading at $0.010527, the price has fluctuated between $0.0103 and $0.0105 over the last few hours. The chart reveals a slight bearish bias with price movement heading towards testing the $0.0103 support level. MACD indicators show the histogram in the red, which might suggest that selling pressure is more substantial at the moment, although not overwhelmingly so. The RSI hovers around 44.35, indicating a slight inclination towards oversold conditions.

This could suggest that there may be further downside momentum if the price breaks below the support level. However, if buying pressure increases at these levels, MEME could see a rebound, with a potential upside to $0.011, a key resistance level. The Bollinger Bands also indicate tightening volatility in the short term, pointing toward potential sharp price movements.
Memecoin technical indicators: Levels and action
Daily simple moving average (SMA)
| Period | Value | Action |
| SMA 3 | $ 0.009836 | BUY |
| SMA 5 | $ 0.009776 | BUY |
| SMA 10 | $ 0.011185 | SELL |
| SMA 21 | $ 0.011123 | SELL |
| SMA 50 | $ 0.010736 | SELL |
| SMA 100 | $ 0.012541 | SELL |
| SMA 200 | $ 0.021127 | SELL |
Daily exponential moving average (EMA)
| Period | Value | Action |
| EMA 3 | $ 0.010634 | SELL |
| EMA 5 | $ 0.010535 | SELL |
| EMA 10 | $ 0.010534 | SELL |
| EMA 21 | $ 0.011072 | SELL |
| EMA 50 | $ 0.013356 | SELL |
| EMA 100 | $ 0.017163 | SELL |
| EMA 200 | $ 0.021669 | SELL |
Is Memecoin a good investment?
Investing in MEME coins can be considered a strategic move for those looking to tap into the viral nature of meme-driven assets. These coins often see rapid appreciation or decrease in value driven by social media trends and community enthusiasm, which can lead to substantial short-term gains. The appeal of MEME coin lies in its potential to capitalize on the widespread attention and excitement surrounding viral tokens, making it an attractive option for investors adept at navigating the volatile crypto market and timing their trades to optimize returns.
Will Memecoin recover?
Based on the chart and the recent upward movement, Memecoin shows signs of recovery. If this positive trend continues, Memecoin has the potential for further recovery.
Will Memecoin reach 10?
Given its current price levels and market trends, reaching $10 for Memecoin is highly unlikely.
Will Memecoin reach 100?
Reaching $100 for Memecoin is extremely improbable due to its current price levels and the enormous market capitalization required. Such a drastic increase in prices would necessitate unprecedented growth and adoption.
Does Memecoin have a good long-term future?
Based on data and the recent upward movement, Memecoin may have the potential for a good long-term future. Positive market trends, adoption, and development will be crucial for its success.
Memecoin October price Prediction 2024
According to Memecoin’s forecast and technical analysis, in October 2024, Memecoin is expected to trade at an average price of $0.01089, a minimum price of $0.009276, and a maximum price of $0.01197.
| Month | Potential Low | Potential Average | Potential High |
| October | $0.009276 | $0.01089 | $0.01197 |
Memecoin Price Prediction 2024
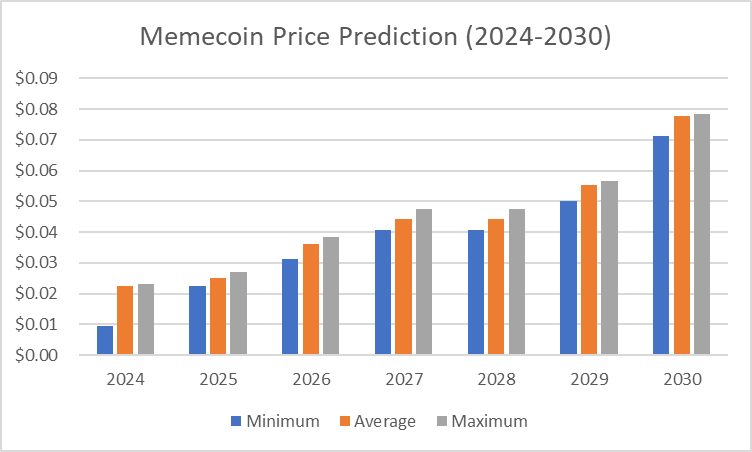
The Memecoin price is predicted to trade at a minimum value of $0.00938, a maximum value of $0.0231, and an average forecast price of $0.0226 in Q3 and Q4 of 2024.
| Year | Potential Low | Potential Average | Potential High |
| 2024 | $0.00938 | $0.0226 | $0.0231 |
Memecoin Price Prediction 2025-2030
| Year | Minimum | Average | Maximum |
| 2025 | $0.0217 | $0.0241 | $0.0258 |
| 2026 | $0.0298 | $0.0345 | $0.0369 |
| 2027 | $0.0389 | $0.0423 | $0.0454 |
| 2028 | $0.0389 | $0.0423 | $0.0454 |
| 2029 | $0.0479 | $0.0531 | $0.0542 |
| 2030 | $0.0683 | $0.0745 | $0.0751 |
Memecoin Price Prediction 2025
The price of Memecoin is forecast to reach the lowest possible level of $0.0217 in 2025. The MEME price could reach a maximum possible level of $0.0258, with an average forecast price of $0.0241.
Memecoin Price Prediction 2026
The price of Memecoin is expected to reach a minimum level of $0.0298 in 2026. The MEME price can reach a maximum level of $0.0369 with an average price of $0.0345.
Memecoin Price Prediction 2027
In 2027, the price of Memecoin is predicted to reach a minimum level of $0.0389. The MEME price can reach a maximum level of $0.0454, with an average trading price of $0.0423.
Memecoin Price Prediction 2028
The price of Memecoin is predicted to reach a minimum level of $0.0389 in 2028. It can reach a maximum level of $0.0454 with an average price of $0.0423.
Memecoin Price Prediction 2029
Memecoin is expected to exceed $0.0531 in 2029, reach a minimum price of $0.0479 this year, and reach a maximum price of $0.0542.
Memecoin Price Prediction 2030
The price of Memecoin is forecast to reach its lowest possible level of $0.0683 in 2030. According to our findings, it could reach a maximum possible level of $0.0751 with an average forecast price of $0.0745.

Memecoin market price prediction: Analysts’ MEME price forecast
| Firm Name | 2024 | 2025 |
| Gov.Capital | $0.0157 | $0.0348 |
| DigitalCoinPrice | $0.0405 | $0.0631 |
| CoinCodex | $0.0266 | $0.04098 |
Memecoin price prediction by Cryptopolitan
According to Cryptopolitan, Memecoin Price Prediction, or MEME, will experience tremendous growth as it can achieve new highs in price points and market cap. Meanwhile, Memecoin is expected to reach a minimum price of $0.0. The maximum price may reach $0.0177 in 2024.
Memecoin historic price sentiment
- Memecoin was launched on 28th October by the renowned internet humor platform 9GAG and has quickly become a significant player in the meme coin market.
- The Memecoin garnered immense popularity through a unique launch strategy involving a fire sale and strategic social media airdrops to cultivate a robust and dedicated community.
- This approach proved highly successful. The fire sale raised over $11 million and sold more than 11.4 billion MEME tokens at $0.001 each, representing a 150% surge from what the team initially planned.

- Looking at its price history since 27th October 2020, MEME saw its first price pump on the same day, reaching a high of $0.02868.
- The MEME token price remained above $0.0020 until 7 November, when a minor pullback occurred below the $0.0200 level.
- Memecoin continued trading around the $0.020 level, with minor fluctuations, until the price spiked again on 4 January, reaching an all-time high of $0.04075 on November 15th.
- Memecoin recorded an all-time low of $0.0751 on 14 January, following a significant market correction. This dip was short-lived, and the token’s price quickly rebounded. The meme coin has been trading at around $0.0268 for the past few days.


