
Top 3 Price Prediction Bitcoin, Ethereum, Ripple: Bitcoin breaks above its $62,000 resistance barrier
- Bitcoin price broke above the resistance level around $62,000, eyeing a rally ahead.
- Ethereum price approaches its crucial resistance barrier around $2,500; a firm close above would suggest a rally ahead.
- Ripple price is nearing its resistance level at around $0.554; if rejected, it could continue its downward lean.
Bitcoin (BTC) has surged past its resistance barrier, signaling a potential rally, while Ethereum (ETH) is testing a critical resistance level near $2,500, a close above suggesting further gains. In contrast, Ripple (XRP) is approaching its resistance, and a rejection here could lead to a continuation of its downtrend.
Bitcoin price is poised for a rally as it broke above its resistance level
Bitcoin price retested, and support was found at the 200-day Exponential Moving Average (EMA), around $60,000, on October 2. It rose 3.5% in the following four days and broke above the $62,125 resistance level. As of Monday, trades above $63,600.
If the $62,125 holds as support, BTC could extend the rally to retest its psychological level of $66,000.
The Relative Strength Index (RSI) on the daily chart is trading at 56, above its neutral level of 50, indicating that bulls control the momentum.
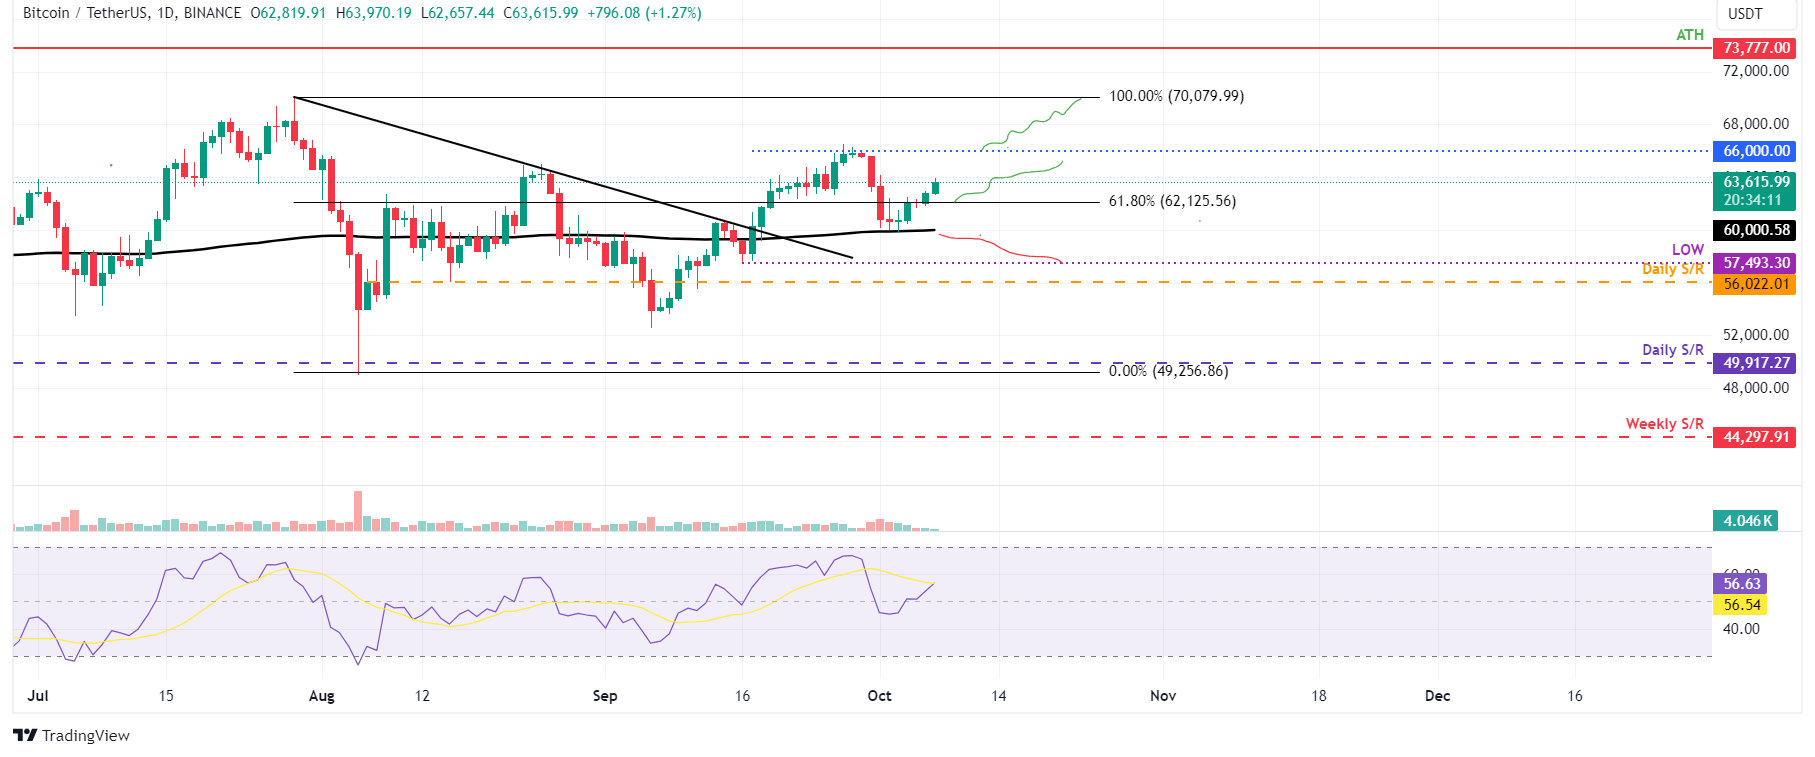
BTC/USDT daily chart
However, if the $62,125 level fails, BTC could decline to retest its 200-day EMA level at $60,000.
Ethereum price could rally if it closes above its resistance barrier
Ethereum price is retesting its daily resistance level of around $2,461 on Monday. This level roughly coincides with the 50% price retracement level at $2,487 and the 50-day EMA around $2,557, making it a key resistance zone.
If ETH breaks and closes above the $2,557 level, it could extend the rise to retest its August 25 high of $2,820.
The RSI is approaching its neutral level of 50, indicating indecisiveness among the traders. For Ethereum's rise to be sustained, the RSI must break above its neutral level and should continue the rise.
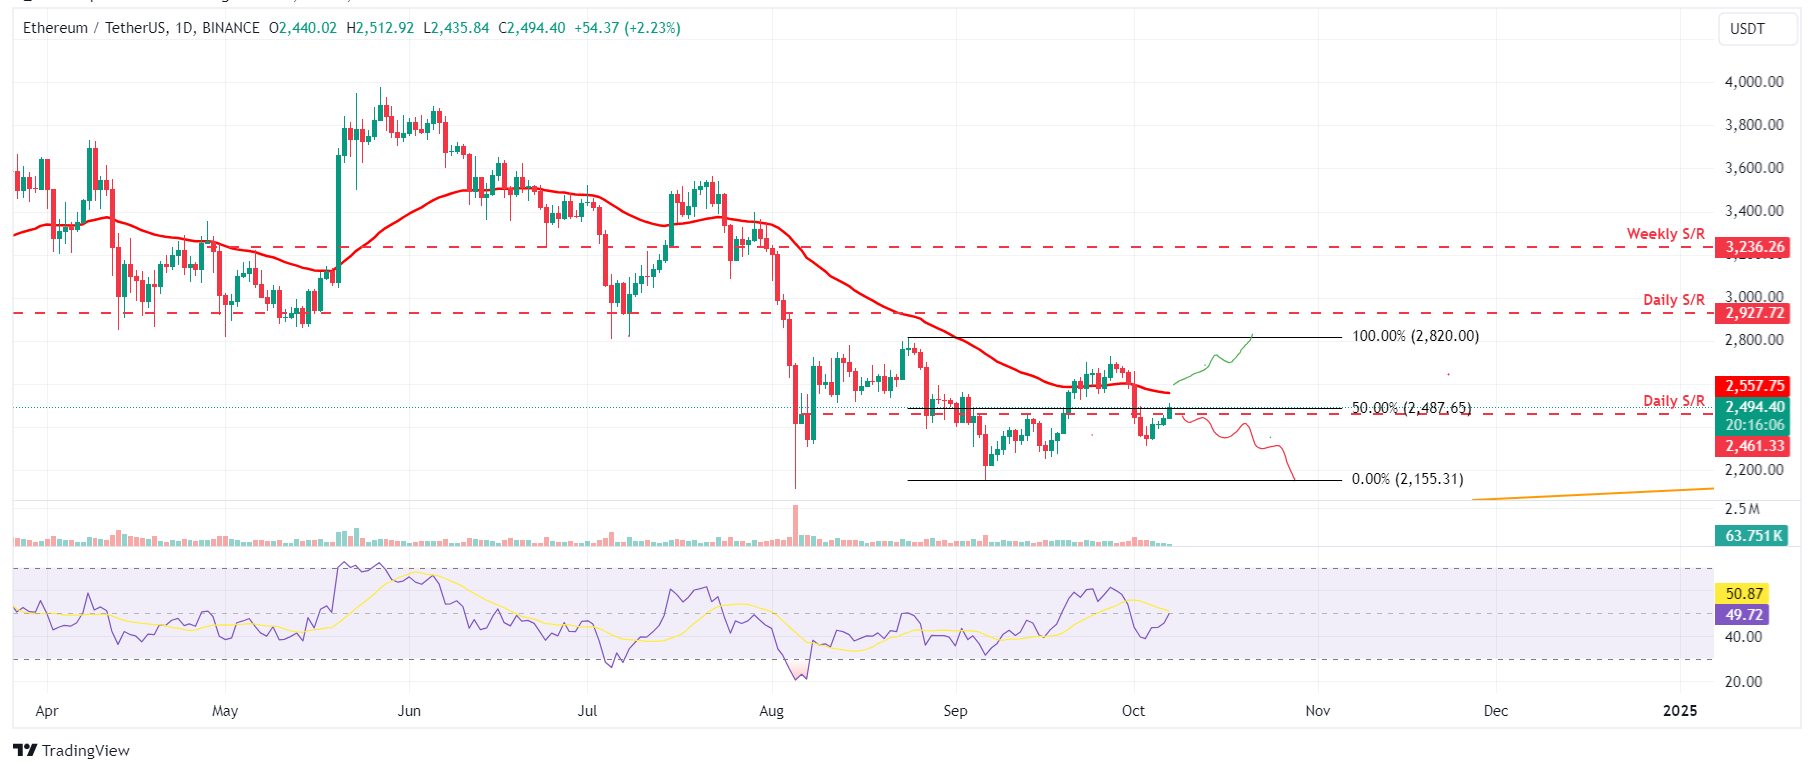
ETH/USDT daily chart
On the other hand, if ETH fails to break and closes below the daily resistance of around $2,461, it could decline to retest its September 6 low of $2,155.
Ripple bulls show weakness
Ripple price broke below its 200-day EMA of around $0.554, and its daily support level was at $0.544 on October 2. It also closed below its ascending trendline. As of Monday, it trades around $0.540, approaching its crucial resistance levels.
If the 200-day EMA around $0.554, the daily level at $0.544 and the ascending trendline holds as resistance, XRP could decline to retest its September 6 low of $0.502.
The RSI indicator on the daily chart also trades below its neutral level of 50, indicating bearish momentum and a continuation of the downward trend.
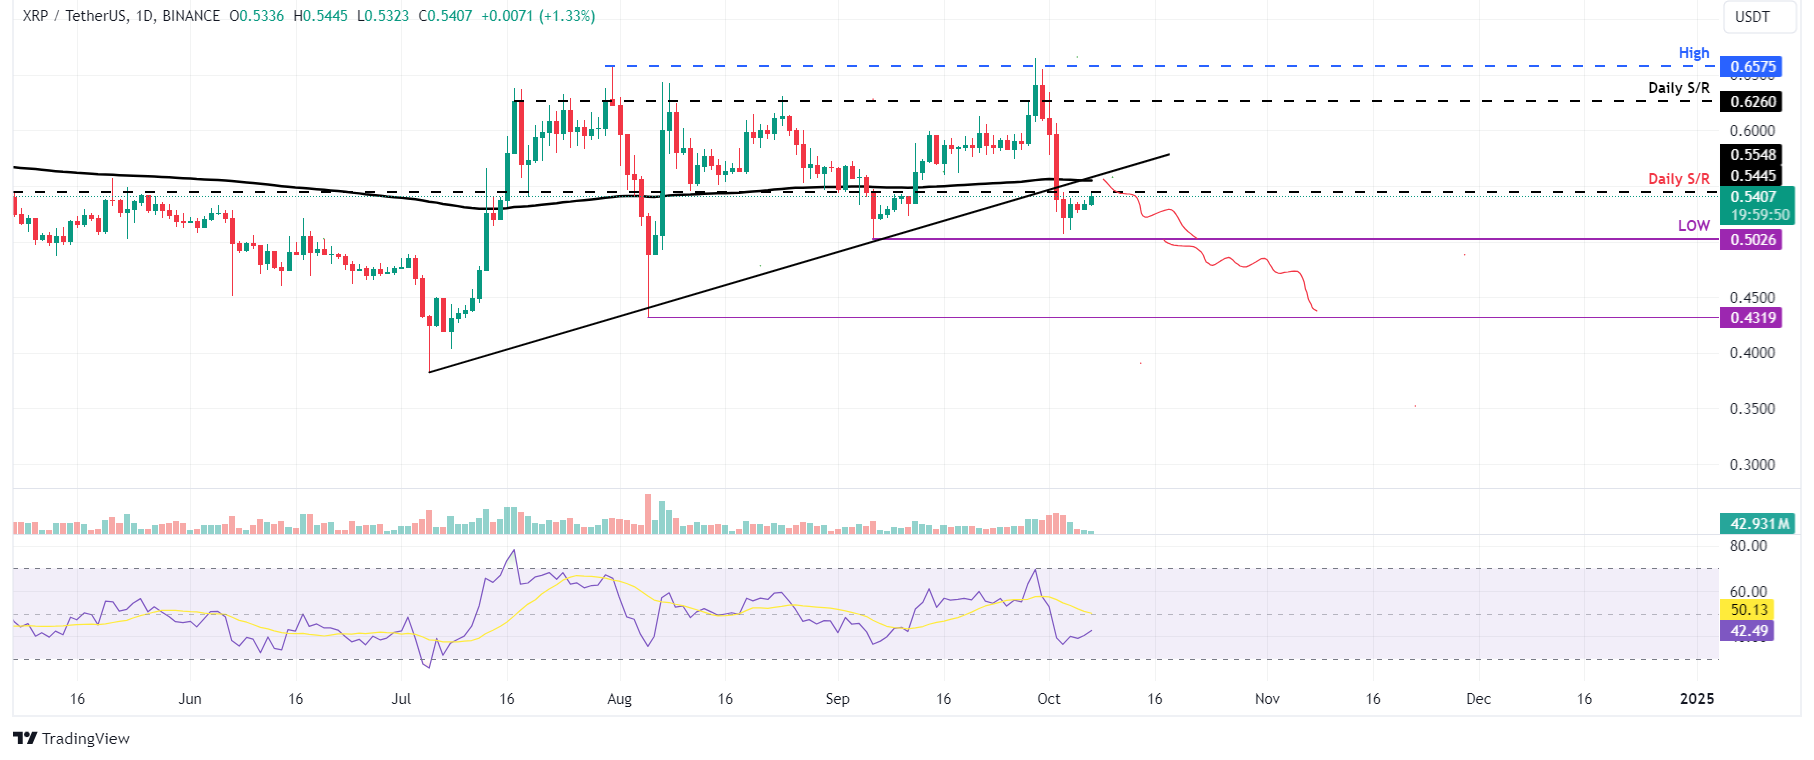
XRP/USDT daily chart
Conversely, if XRP breaks and closes above the $0.554 level, it could extend the rise to retest its next daily resistance at $0.626.
Bitcoin, altcoins, stablecoins FAQs
Bitcoin is the largest cryptocurrency by market capitalization, a virtual currency designed to serve as money. This form of payment cannot be controlled by any one person, group, or entity, which eliminates the need for third-party participation during financial transactions.
Altcoins are any cryptocurrency apart from Bitcoin, but some also regard Ethereum as a non-altcoin because it is from these two cryptocurrencies that forking happens. If this is true, then Litecoin is the first altcoin, forked from the Bitcoin protocol and, therefore, an “improved” version of it.
Stablecoins are cryptocurrencies designed to have a stable price, with their value backed by a reserve of the asset it represents. To achieve this, the value of any one stablecoin is pegged to a commodity or financial instrument, such as the US Dollar (USD), with its supply regulated by an algorithm or demand. The main goal of stablecoins is to provide an on/off-ramp for investors willing to trade and invest in cryptocurrencies. Stablecoins also allow investors to store value since cryptocurrencies, in general, are subject to volatility.
Bitcoin dominance is the ratio of Bitcoin's market capitalization to the total market capitalization of all cryptocurrencies combined. It provides a clear picture of Bitcoin’s interest among investors. A high BTC dominance typically happens before and during a bull run, in which investors resort to investing in relatively stable and high market capitalization cryptocurrency like Bitcoin. A drop in BTC dominance usually means that investors are moving their capital and/or profits to altcoins in a quest for higher returns, which usually triggers an explosion of altcoin rallies.
Recommended Articles


