


From $100 Million to $500 Million: Growing Volume Aims to Push Aptos (APT) Price by 80%
Despite registering a 43% price increase in the last 30 days, Aptos (APT) price could be gearing up for another phase of explosive growth. This is largely due to the incredible surge in volume within the last few days.
With bullish momentum building, this analysis reveals the key drivers behind the surge and what investors should expect from Aptos’ price before the end of this quarter.
Aptos Volume Explodes
On September 30, Aptos’ volume was a little over $100 million. But today, the metric has risen to $507.20 million, meaning that over $400 million in liquidity flowed into the ecosystem within the last five days.
This spike in volume is connected to Franklin Templeton’s decision to expand its tokenized fund on the Aptos blockchain. Moments after that, the volume rose to $300 million but later declined to $265 million.
Therefore, the recent hike implies that investors are looking beyond the development to drive APT’s price higher. At press time, Aptos’ price is $8.86, representing a 6% increase in the last 24 hours.
Read more: Where To Buy Aptos (APT): 5 Best Platforms for 2024
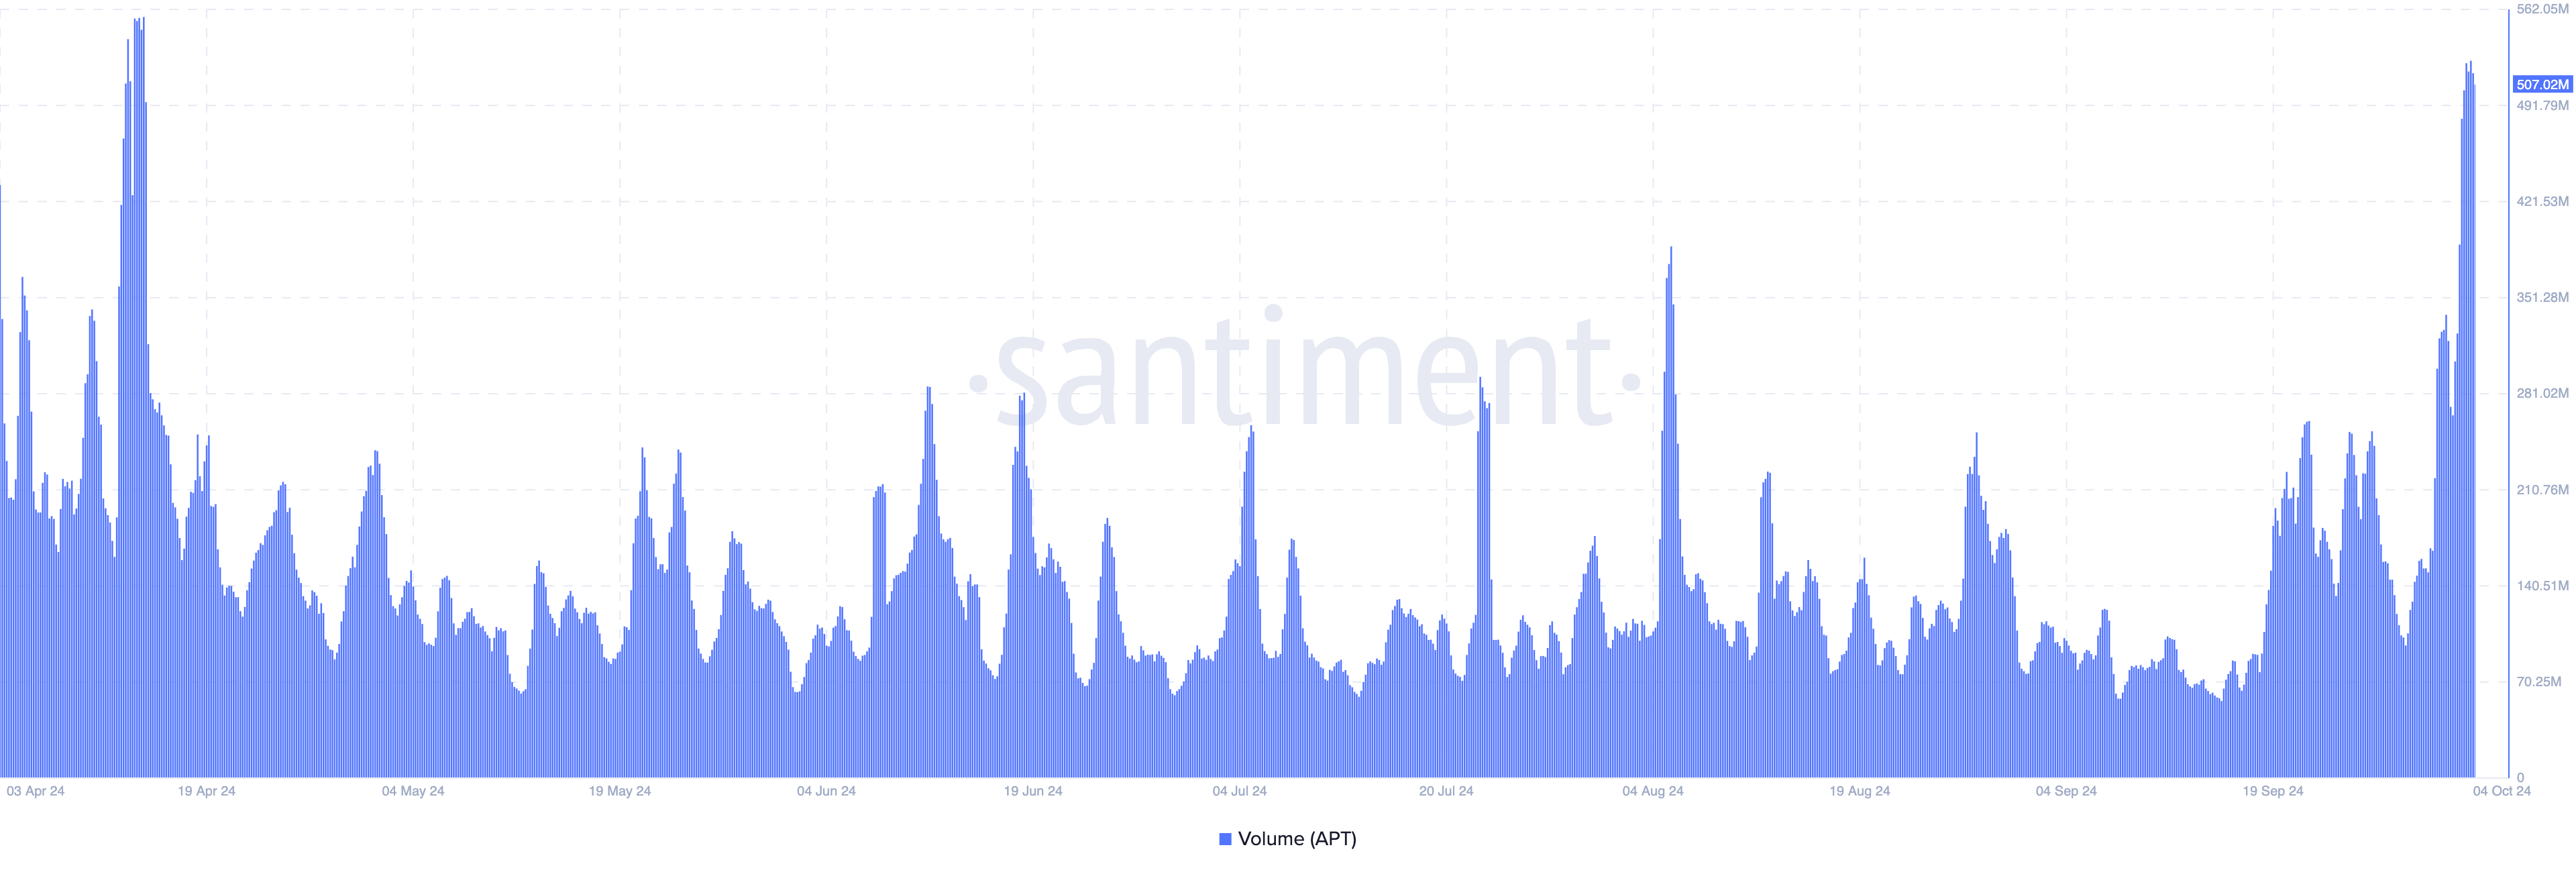 Aptos Volume. Source: Santiment
Typically, when trading volume increases along with the price, it reinforces the strength of the uptrend. However, a decline in volume during a price increase suggests otherwise. If volume continues to rise, Aptos’ price may follow suit.
From a technical point of view, the Ichimoku Cloud also suggests that APT could go higher. The Ichimoku Cloud is a collection of technical indicators that show support and resistance levels and trend direction.
When the price is below the cloud, it indicates a downward trend, while a price above the cloud suggests potential upward movement. On the daily chart, APT’s price sits above the Ichimoku Cloud, signaling strong support that could drive the altcoin’s value further north.
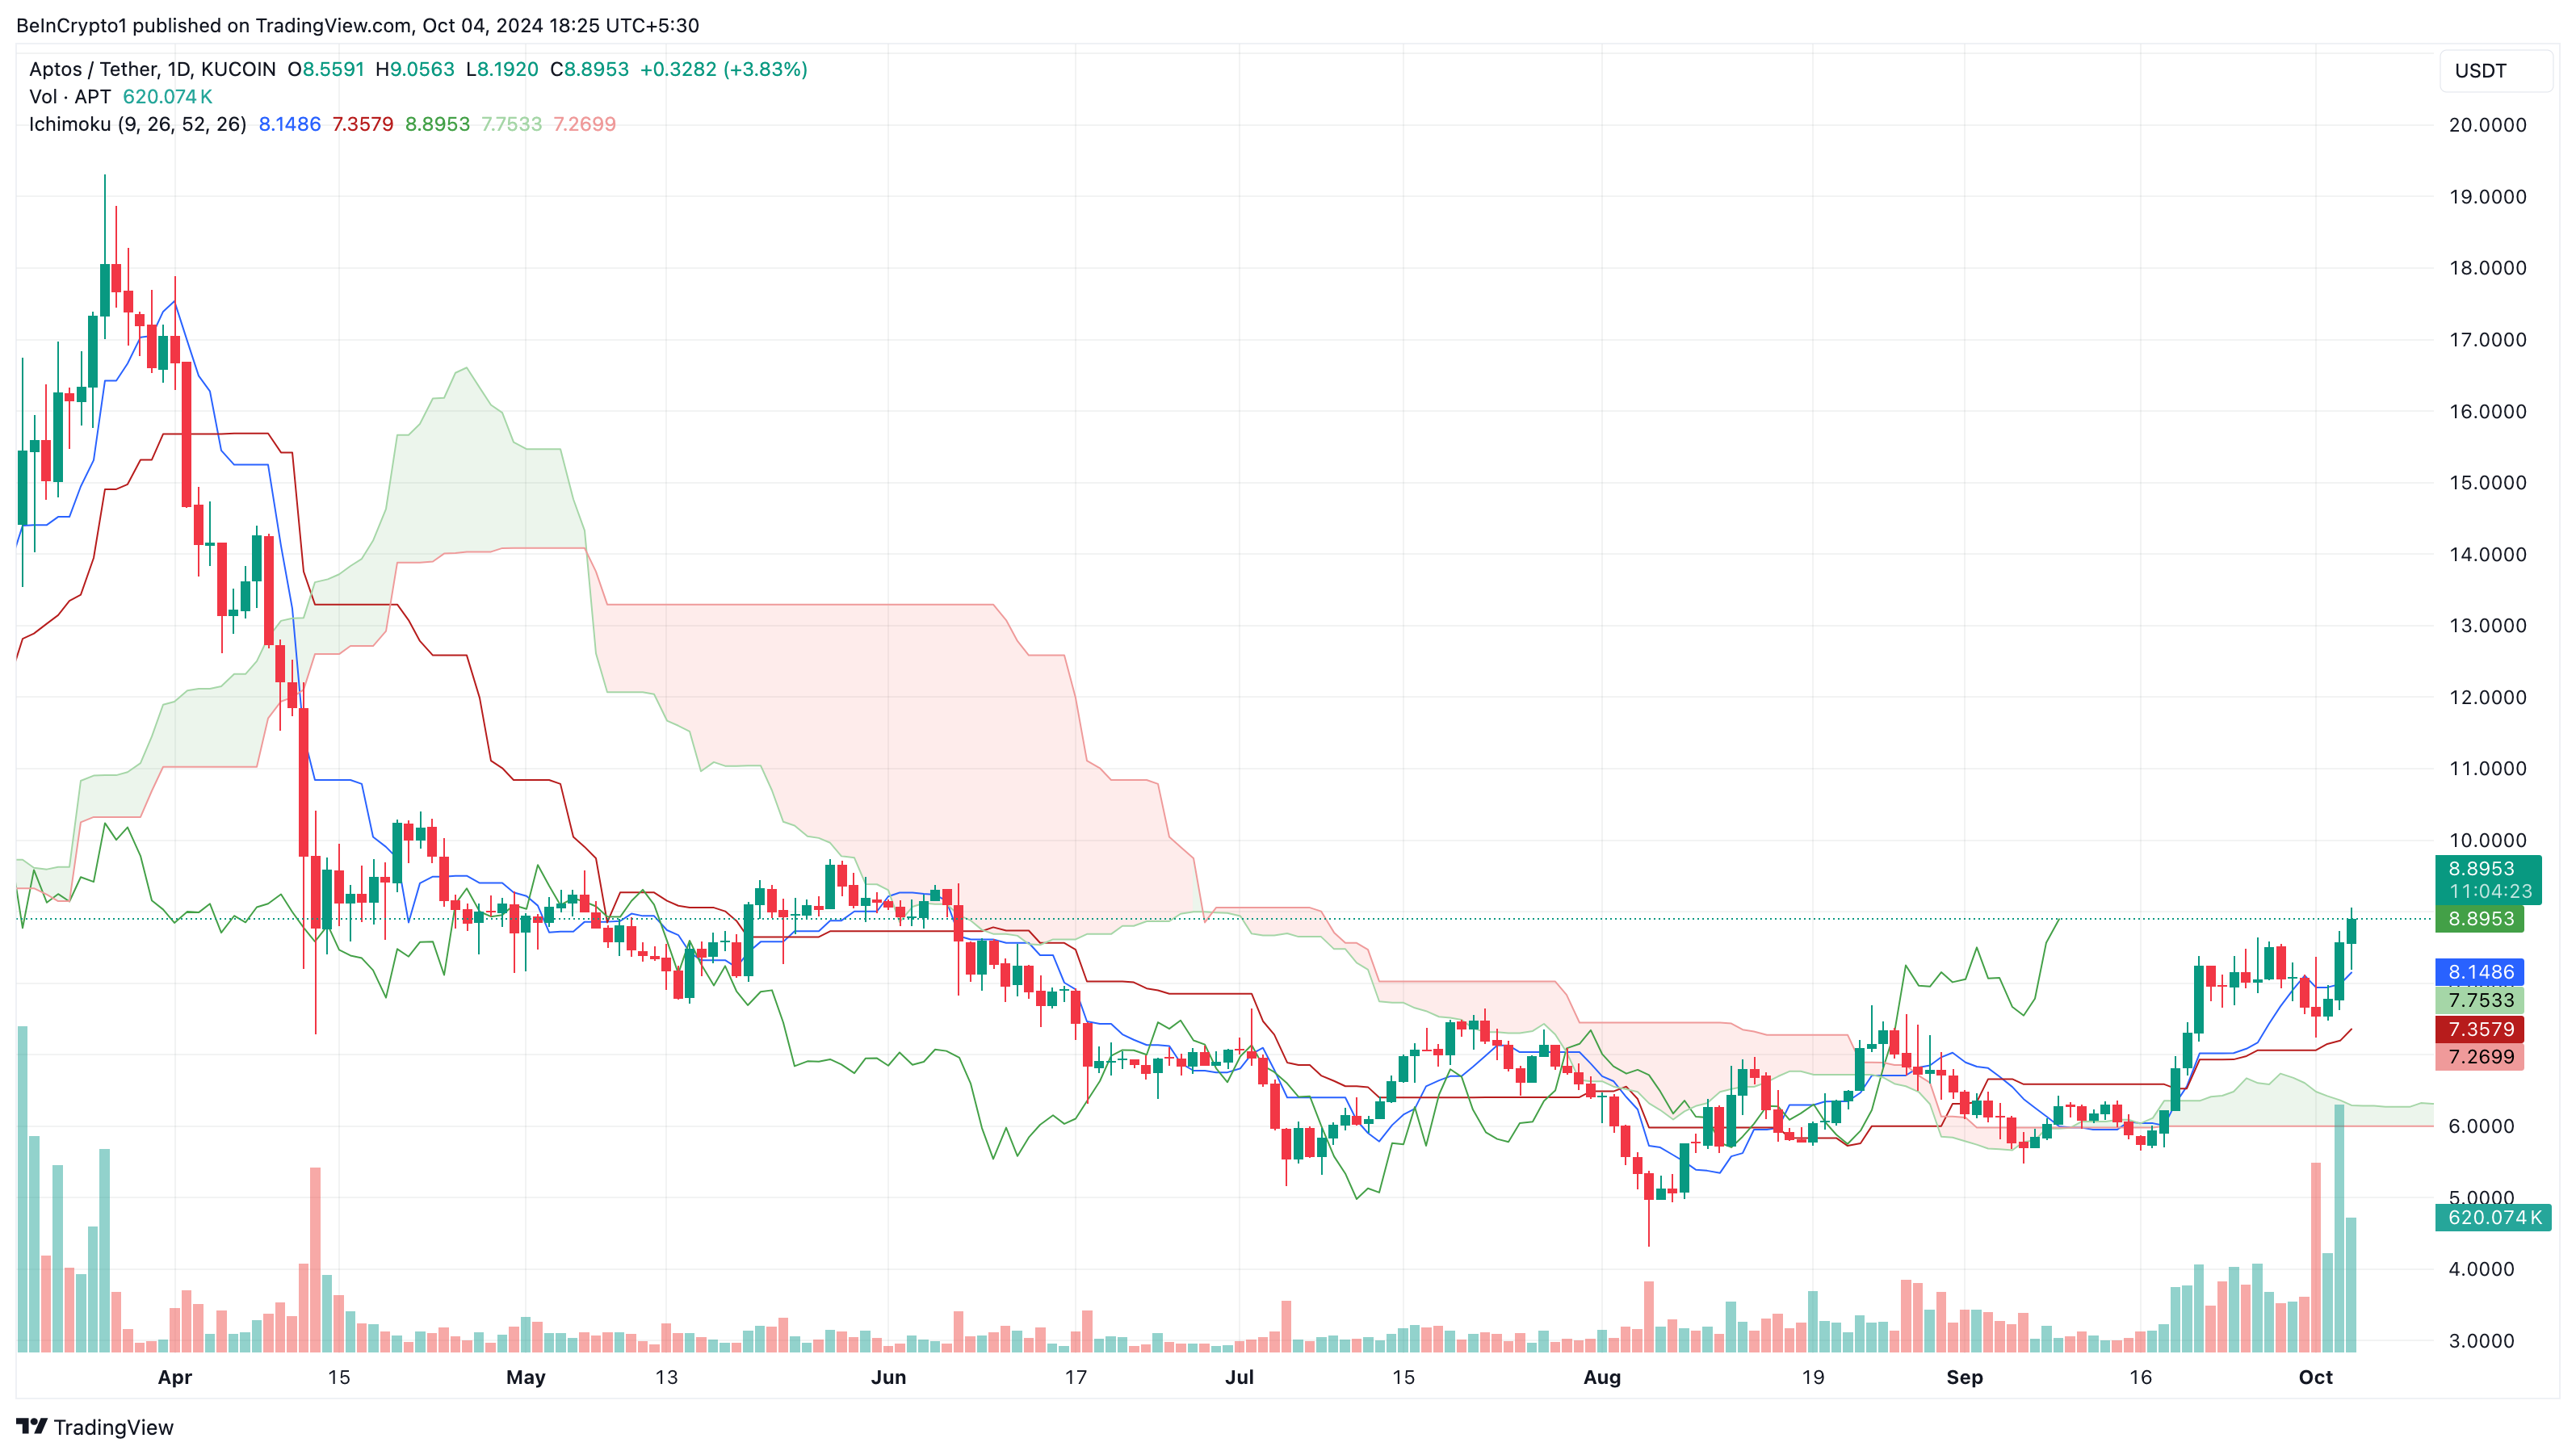 Aptos Ichimoku Cloud. Source: TradingView
APT Price Prediction: Double-Digits Soon
On the daily chart, Aptos (APT) has finally trended upward after a prolonged downturn. The support at $7.55 played a key role in preventing another decline, especially after the broader market faced headwinds earlier in the week.
Currently, APT is approaching the critical $9 support level, which had previously propelled the token’s price to $18 in March. A break above this level could signal further gains. The Relative Strength Index (RSI), a momentum indicator, also supports this outlook, as it has shown an increase.
Read more: 5 Best Aptos (APT) Wallets in 2024
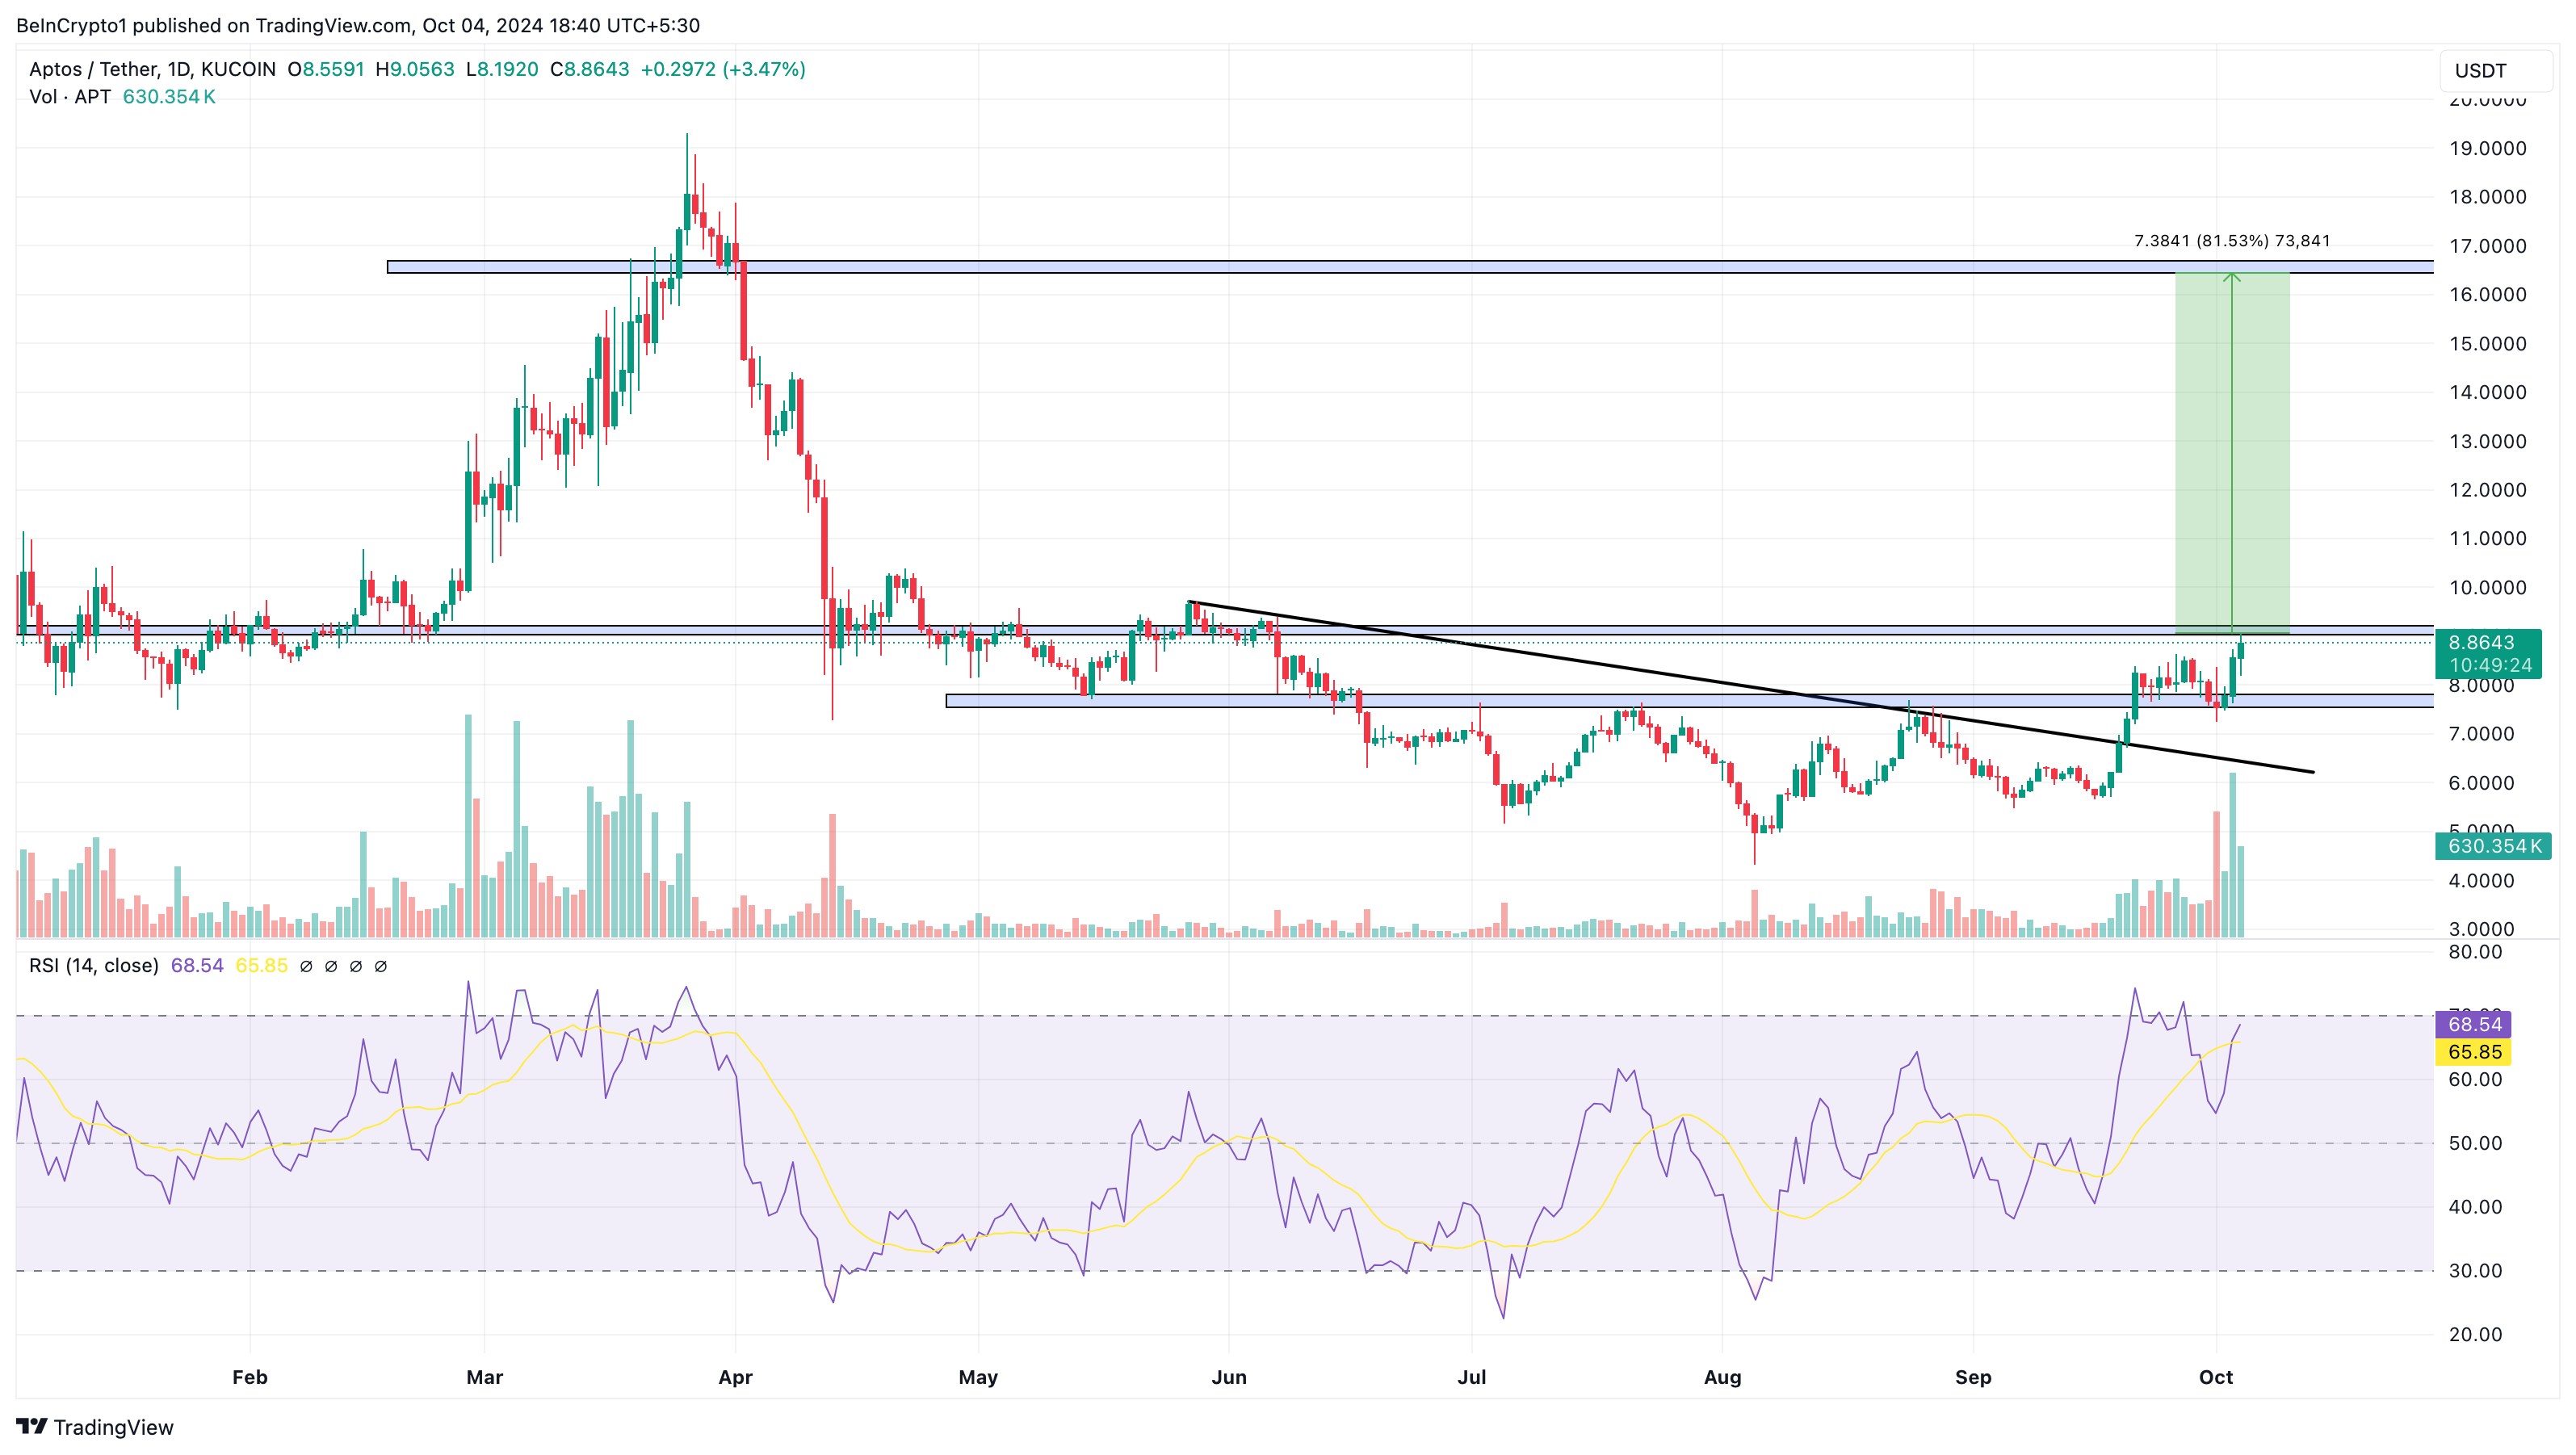 Aptos Daily Price Analysis. Source: TradingView
If the bullish momentum holds, Aptos could surge by 81%, reaching $16.75 in the short term. However, if traders begin taking profits or buying pressure eases, this forecast could be invalidated, with Aptos potentially falling below $8.
Recommended Articles


