
Bitcoin MVRV Trend Could Suggest BTC Cycle Top Not In Yet
The trend in the Bitcoin Market Value to Realized Value (MVRV) Ratio may point towards a top being yet to occur in the current cycle.
Bitcoin MVRV Ratio Hasn’t Yet Hit The Peaks Of Previous Cycles
In a new post on X, the market intelligence platform IntoTheBlock discusses the historical trend of the Bitcoin MVRV Ratio. The “MVRV Ratio” is a popular BTC on-chain indicator that compares the asset’s market cap and realized cap.
The market cap here is just the simple total valuation of the cryptocurrency’s supply at the current price. At the same time, the latter is an on-chain capitalization model that puts the last transaction price of each coin in circulation as its ‘true’ value.
Assuming that the last transfer for most coins was the last time that they changed hands, the price at its time would denote their cost basis. Thus, the realized cap is just an estimation for the sum of the cost basis of all BTC tokens.
In other words, it measures the total capital the investors have put into the cryptocurrency. In contrast, the market cap denotes the value the investors hold right now.
As such, the MVRV Ratio, which compares the two metrics, contains information about the profit/loss status of the Bitcoin userbase. Naturally, the ratio greater than 1 implies the investors are in a state of net profit, while under the cutoff implies the dominance of loss.
Now, here is a chart that shows the trend in the Bitcoin MVRV Ratio over the past decade or so:
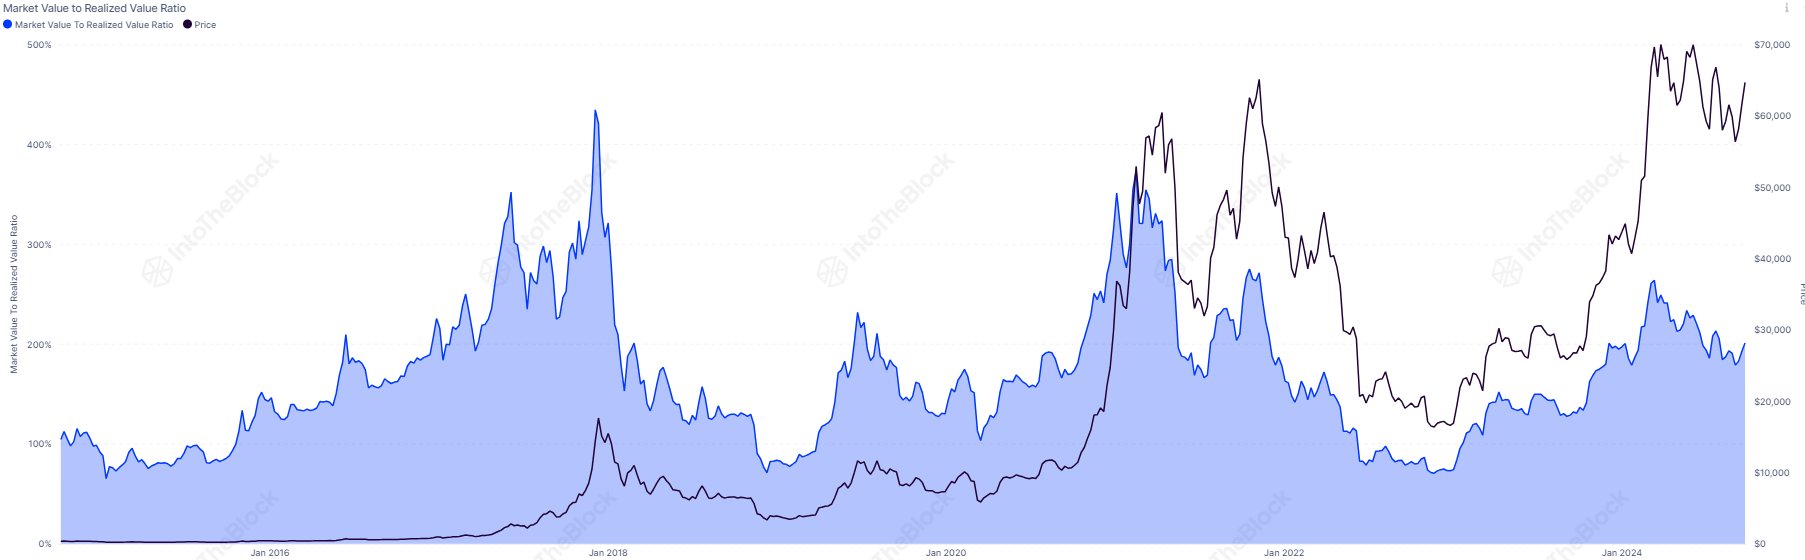
As displayed in the above graph, the Bitcoin MVRV Ratio surged during the rally to the new price all-time high (ATH) in the year’s first quarter as the investors’ profits ballooned.
Historically, tops have been more likely to form for BTC, and the more inflated holder gains have become since investors become tempted to sell when their profits reach high levels.
Thus, the MVRV Ratio hitting high values can imply the cryptocurrency may be becoming overpriced and, therefore, could be due to a correction. At the price top earlier in the year, the indicator had hit a peak value of 2.64, which suggests the market cap had become more than double the realized cap.
According to IntoTheBlock, the indicator’s peak value was 4.35 in the 2017 bull run and 3.7 in the 2021 bull run. The recent high in the MVRV Ratio hasn’t come close to either of these levels yet. The analytics firm notes that the latest value “seems relatively low to signal a market top.”
BTC Price
At the time of writing, Bitcoin is trading at around $60,600, down around 7% over the past week.
Recommended Articles


