BONK Price on Track to Hit $0.000035 – Key Indicators to Watch

Source Beincrypto

Solana-based dog-themed meme coin Bonk (BONK) has seen its price increase by 37% in the last seven days. This development came after the broader market experienced a significant recovery, and other meme coin prices also jumped.

While some meme coins have seen their gains erased, BONK appears to be showing immense strength. As a result, the price could be set to go higher in the short term.

The Solana Meme Coin Stays Strong

With Bonk trading at $0.000024, the Awesome Oscillator (AO) on the daily chart supports a bullish outlook. The AO is a momentum indicator that compares recent price movements to historical trends, using a zero-line signal to determine whether momentum is bullish or bearish.

When the AO reading is below the zero line, momentum is bearish, and when it is above, momentum is bullish. Currently, BONK’s AO shows bullish momentum, suggesting that the recent sideways movement may soon lead to a significant upswing.

Read more: How to Buy Solana Meme Coins: A Step-By-Step Guide

Bonk bullish momentum
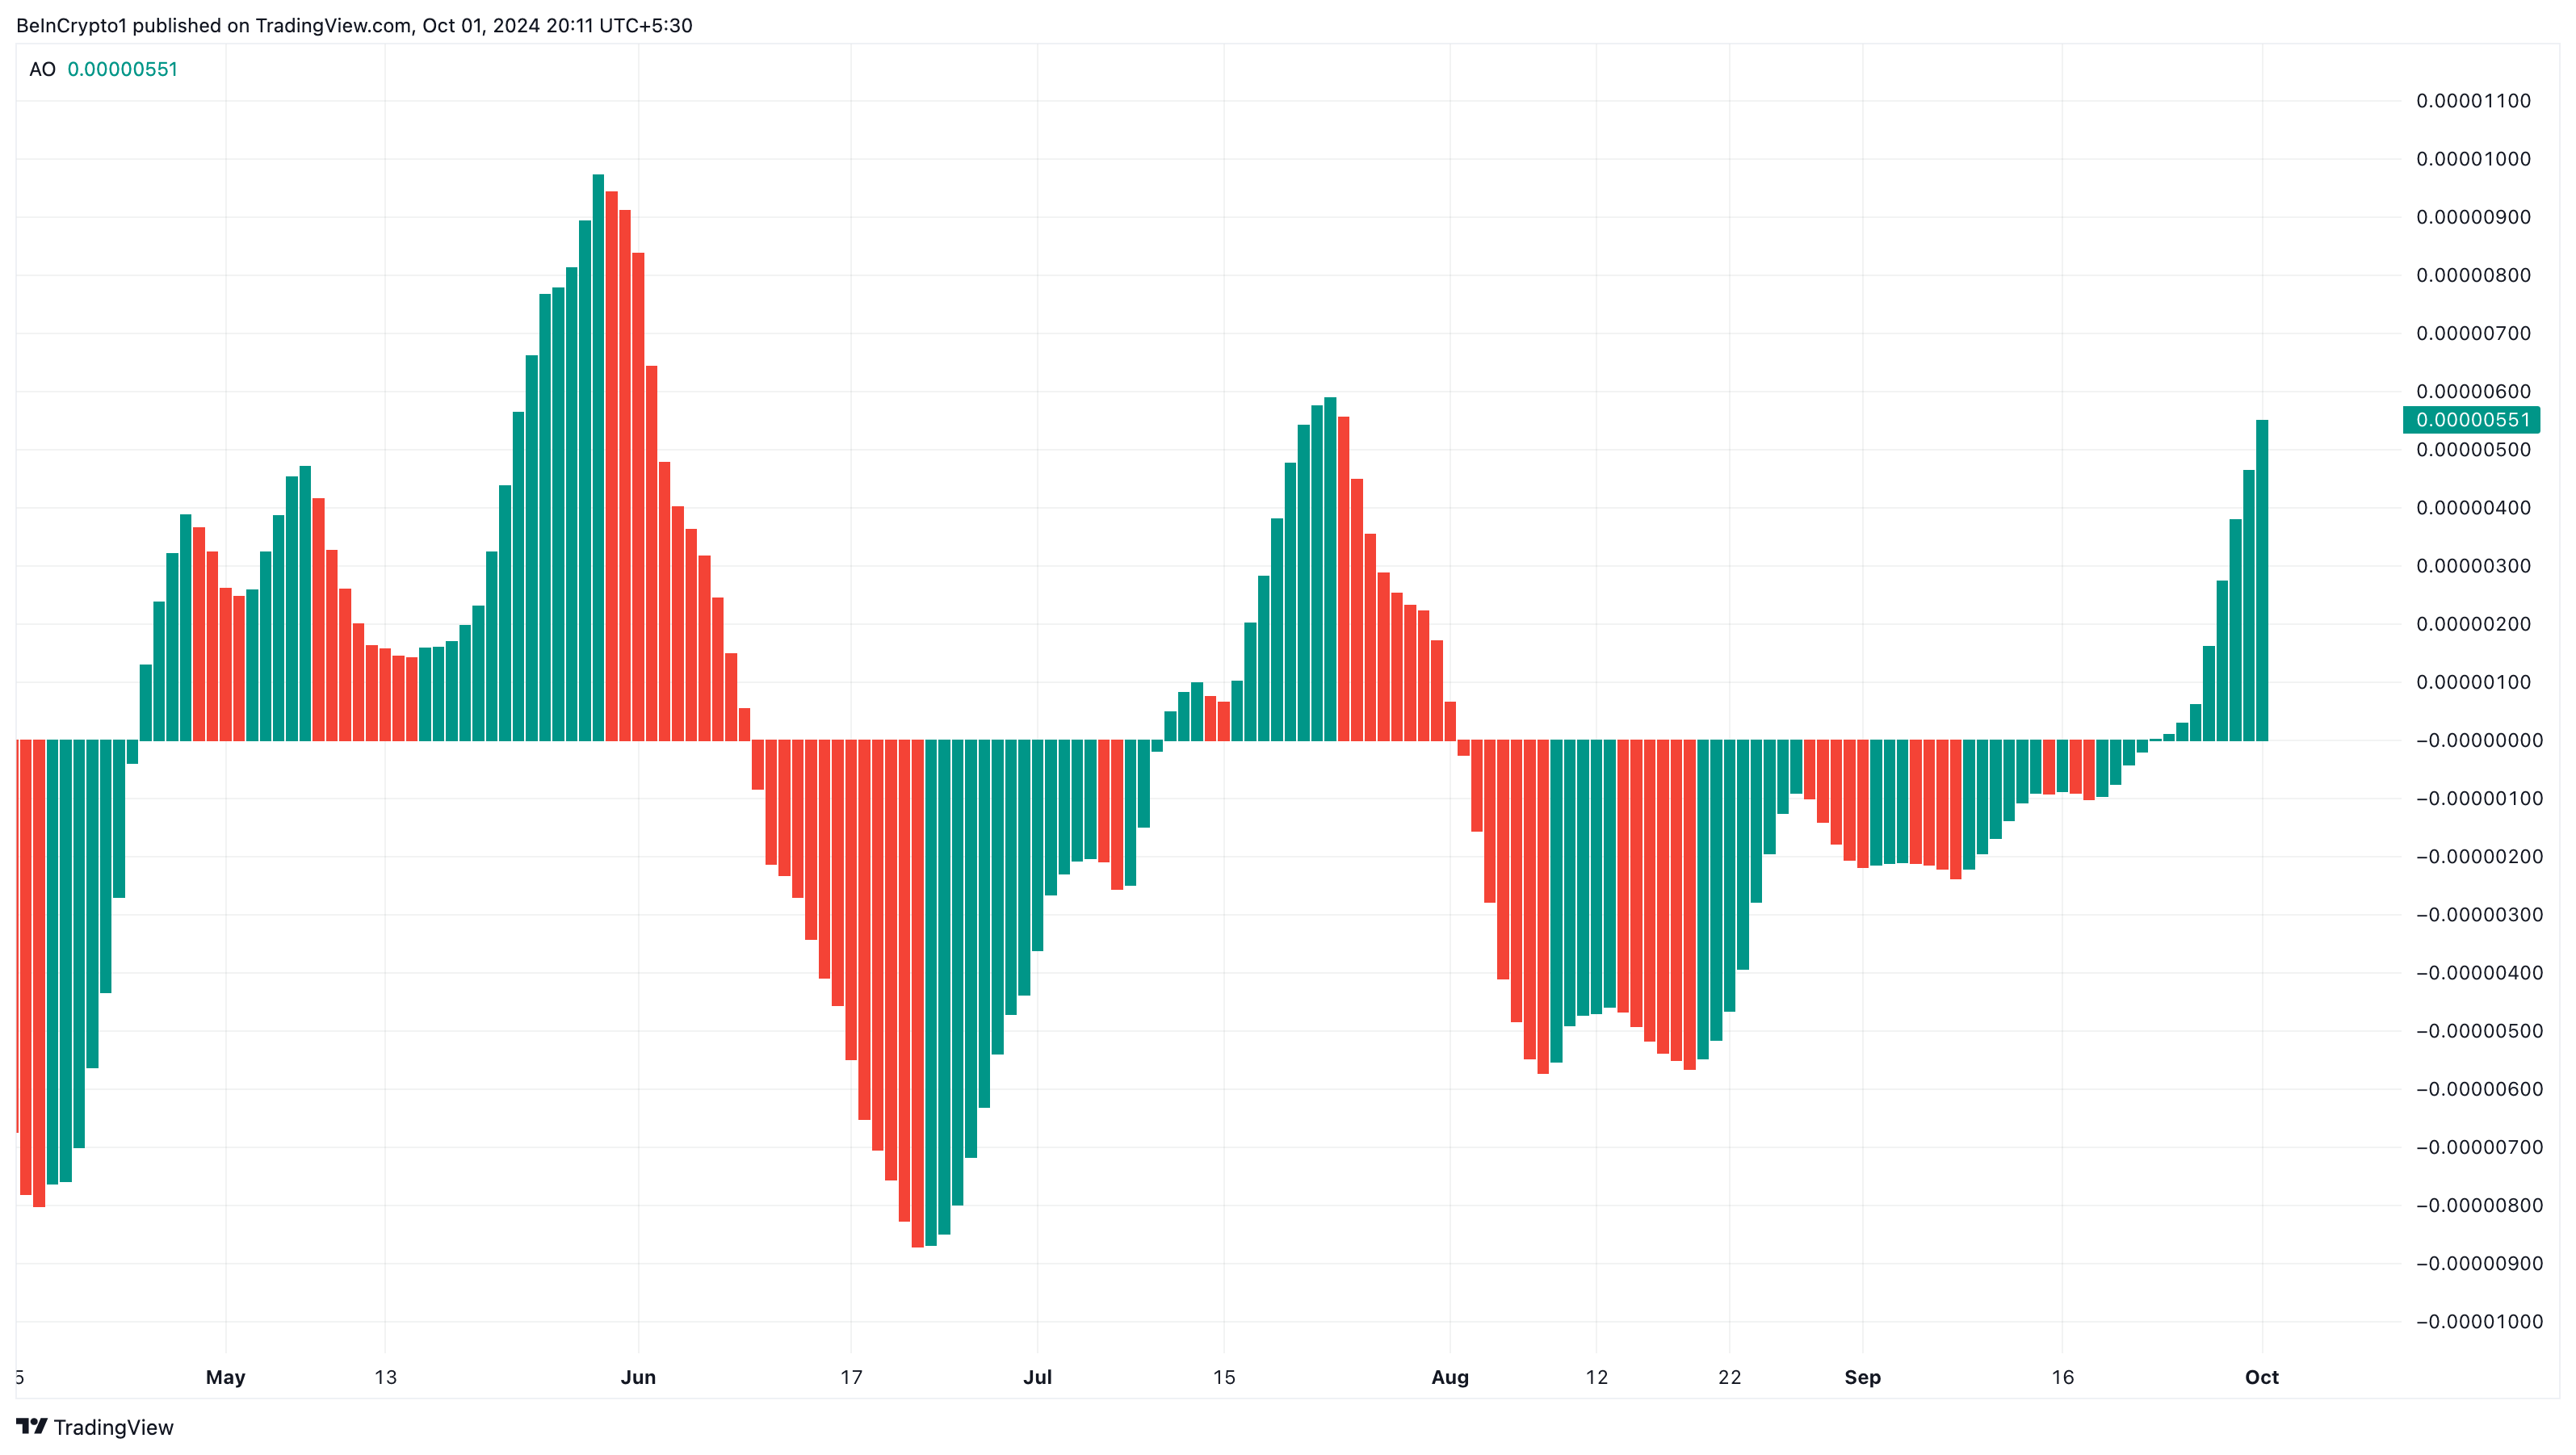
Bonk Awesome Oscillator. Source: TradingView

Furthermore, the Bull Bear Power (BBP) aligns with this sentiment. The BBP shows the strength of buyers (bulls) and the strength of sellers (bears). 

When the BBP climbs, bulls are in control, indicating that the price can increase. Conversely, if the BBP is negative, bears are dominant, and the price might drop if it intensifies. On the daily chart, BONK’s BBP is positive, suggesting that the price can go much higher than $0.000024.

Bonk bullish power increases
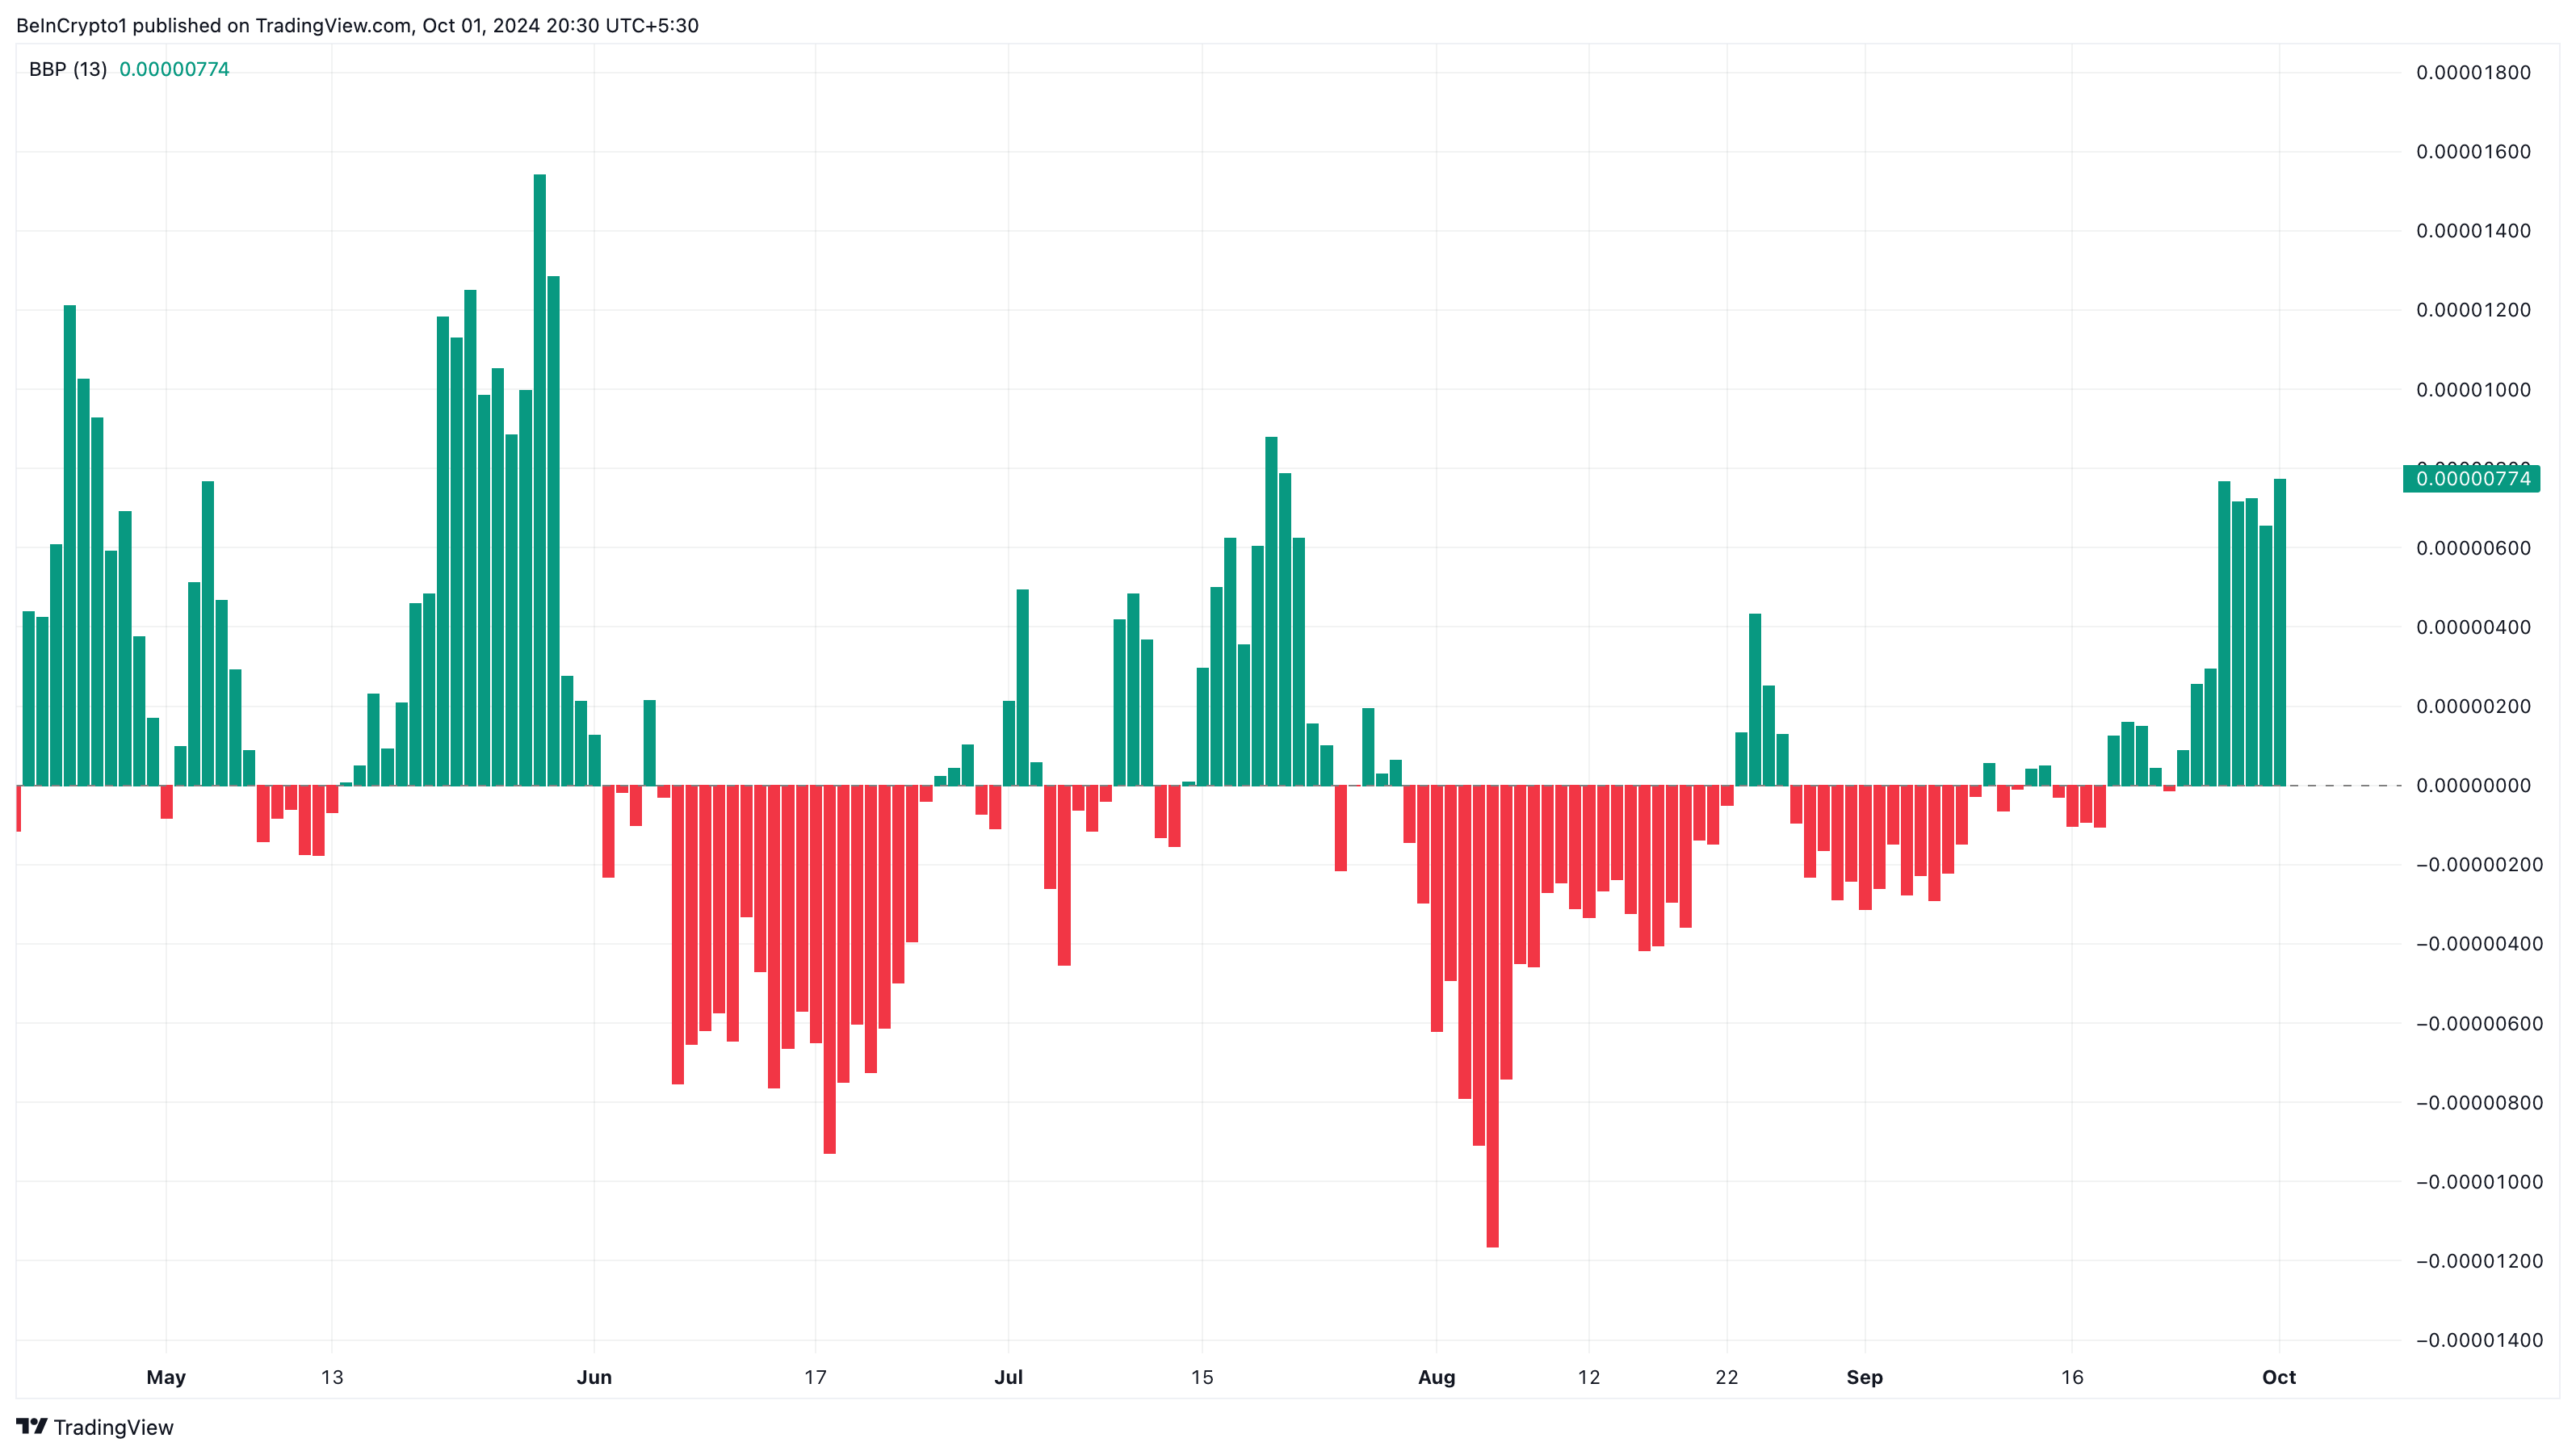
Bonk Bull Bear Power. Source: TradingView

BONK Price Prediction: The Rally May Continue

The daily chart shows BONK’s price nearing $0.000026, though it could encounter resistance at this level. With the current bullish momentum and dominance, the token may break through this region.

If successful, BONK’s short-term target could rise to $0.000030. However, this depends on whether bears can avoid pulling the price back to $0.000021.

Read more: 11 Top Solana Meme Coins to Watch in October 2024

Bonk Daily Price Analysis.
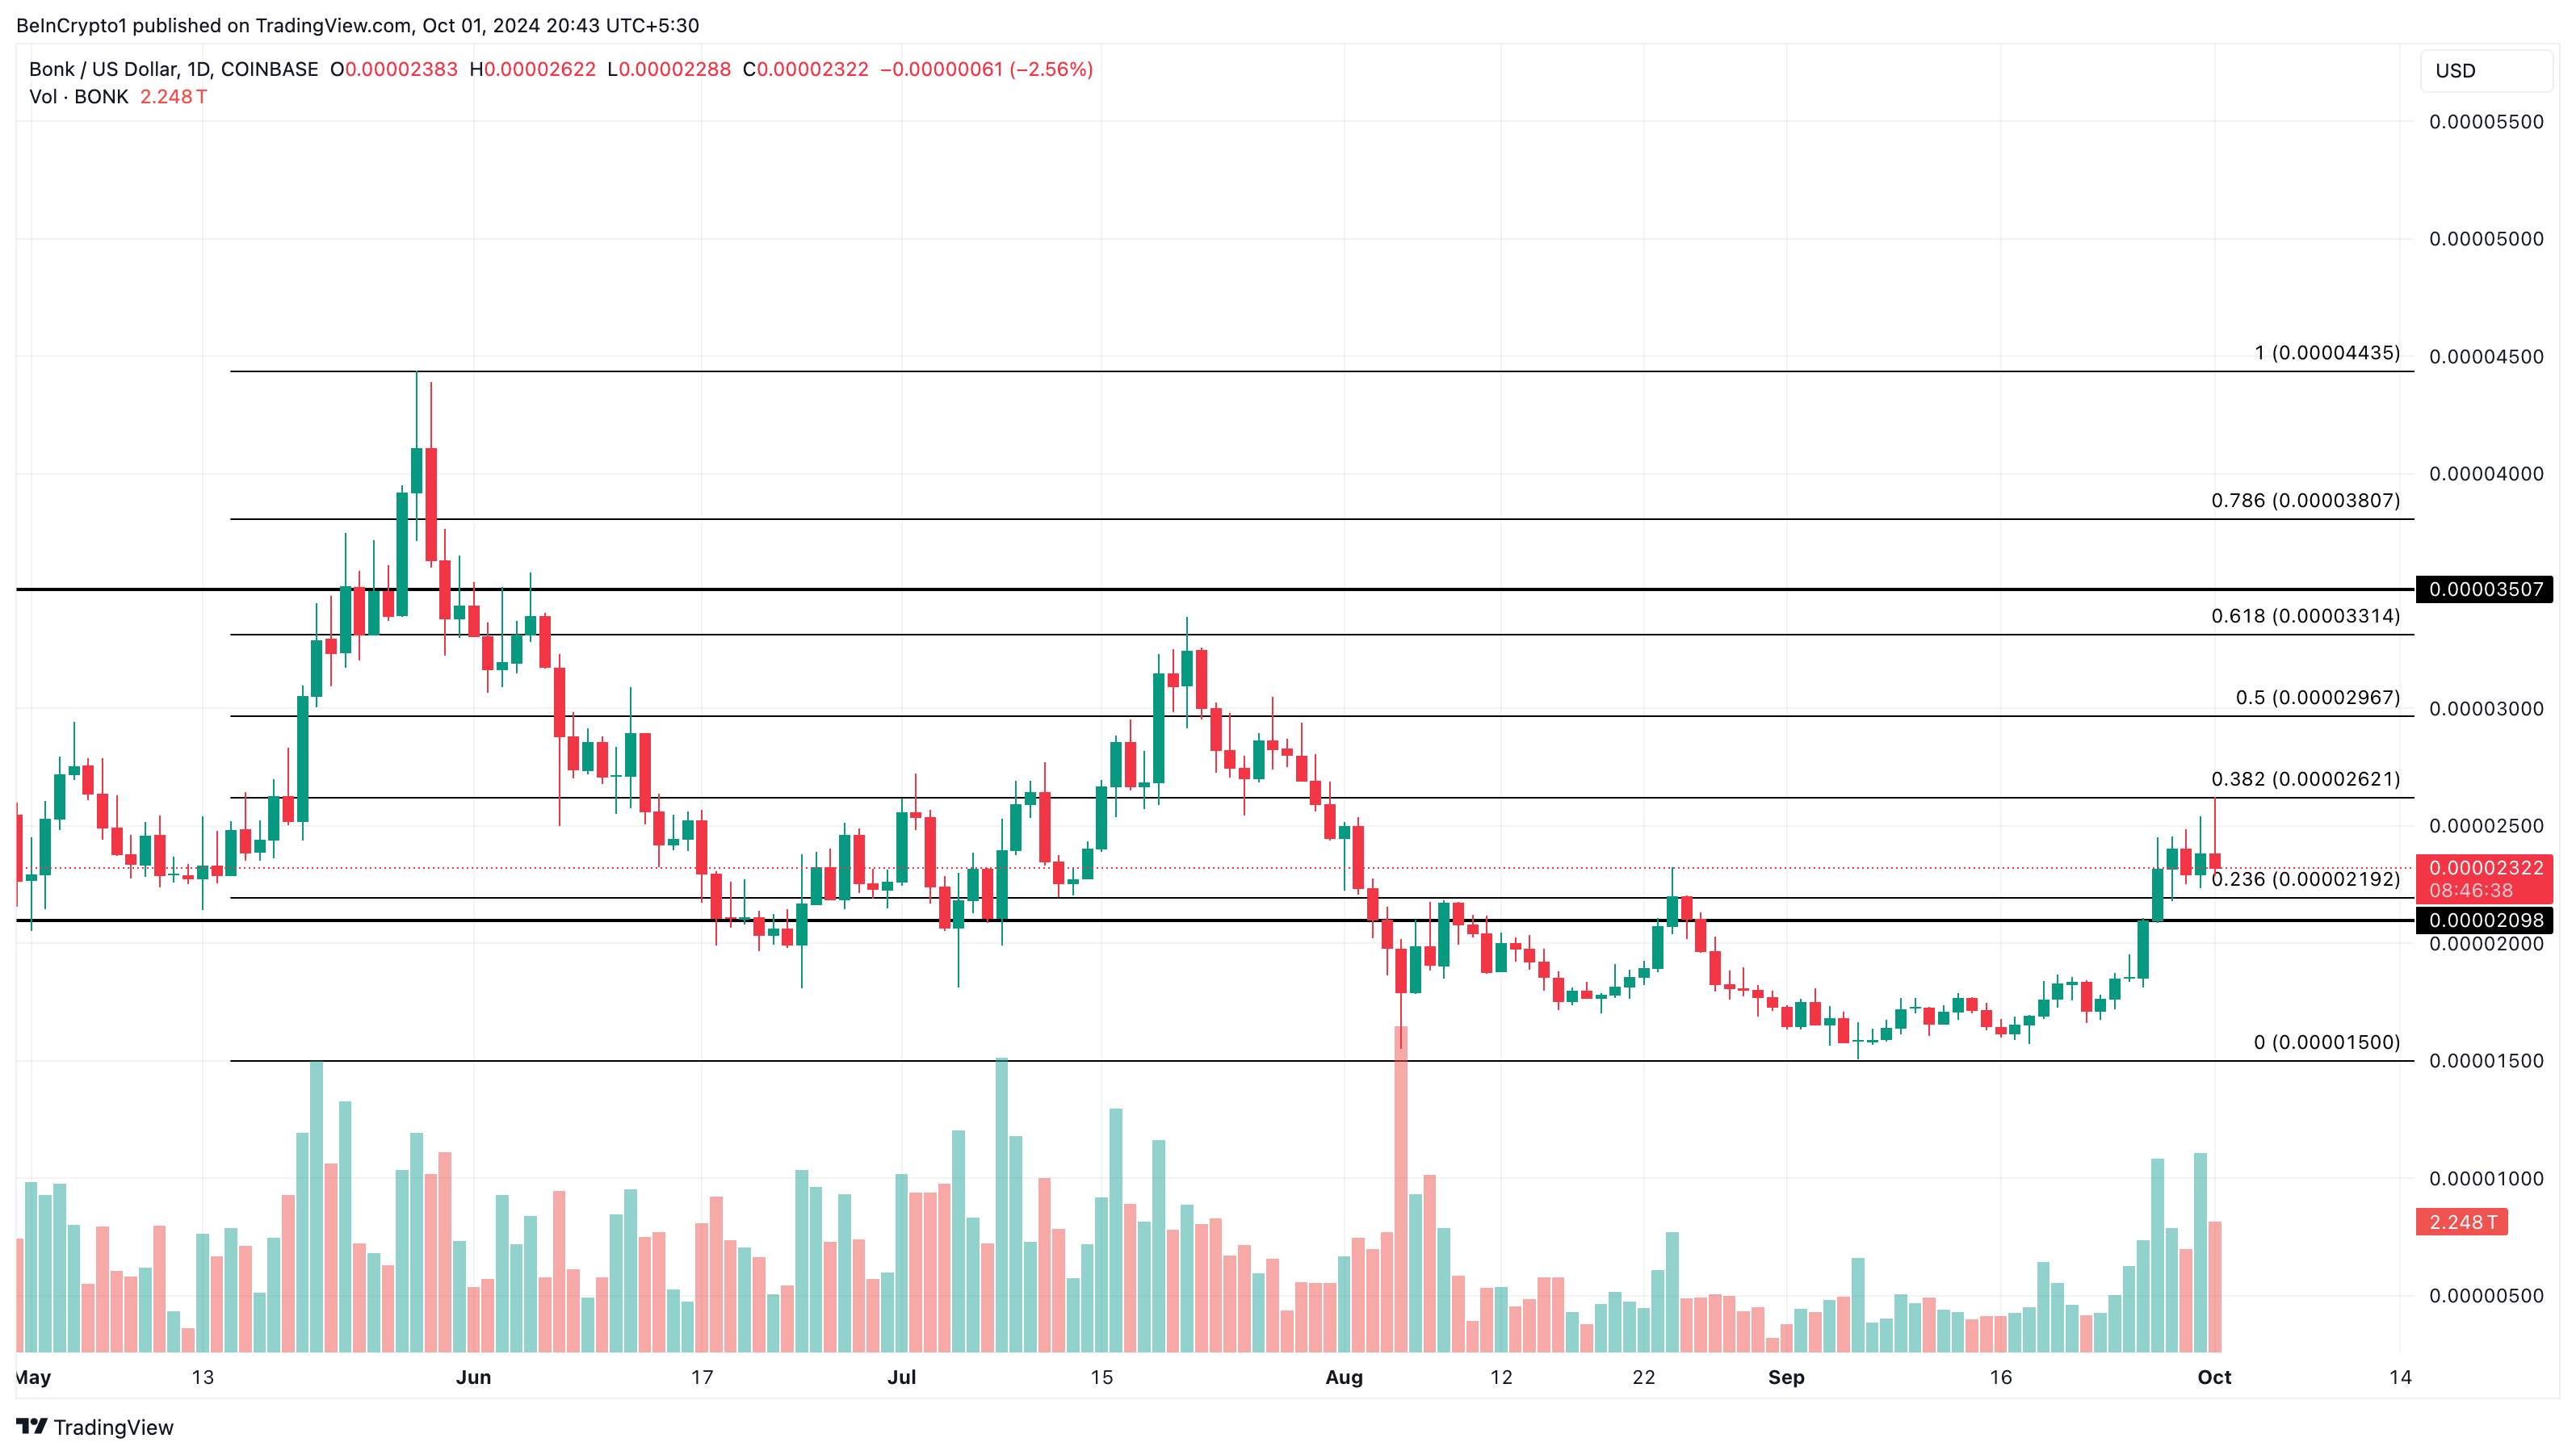
Bonk Daily Price Analysis. Source: TradingView

If buying pressure intensifies, BONK’s price could rally toward $0.000035. Conversely, a drop in buying activity could invalidate this forecast, potentially pushing the Solana meme coin down to $0.000021.

Disclaimer: For information purposes only. Past performance is not indicative of future results.
placeholder
EURUSD Long-term Forecast: Can ECB Hawks Overcome the Dollar Bullishness? As one of the most traded currency pair in the forex markets, the price of EURUSD affects many traders. Check out our EURUSD long-term forecast for more information.
Author  Mitrade
Mar 13, 2023
As one of the most traded currency pair in the forex markets, the price of EURUSD affects many traders. Check out our EURUSD long-term forecast for more information.
placeholder
Will the Palestine-Israel Conflict Impact BTC Safe-Haven Demand? What Is the Future Outlook for BTC?The current Palestinian-Israeli conflict is not enough to stimulate investor demand for BTC, but it cannot be ruled out that the escalation of the conflict will drive BTC to a high of $31,000.
Author  Mitrade
Oct 10, 2023
The current Palestinian-Israeli conflict is not enough to stimulate investor demand for BTC, but it cannot be ruled out that the escalation of the conflict will drive BTC to a high of $31,000.
placeholder
Crypto Controversy Ignited by Israeli-Palestinian Conflict: What Impact Does It Have on Regular Investors? The Palestinian-Israeli conflict has increased people's demand for BTC, but it is relatively limited and may have a negative impact.
Author  Mitrade
Oct 17, 2023
The Palestinian-Israeli conflict has increased people's demand for BTC, but it is relatively limited and may have a negative impact.
placeholder
Understanding the first crypto market crash of 2024 and what to expect nextThe 365-day MVRV ratio suggests that this crash may be just the beginning. If the ETF is rejected before the second quarter of 2024, it could trigger a sharp correction.
Author  FXStreet
Jan 04, Thu
The 365-day MVRV ratio suggests that this crash may be just the beginning. If the ETF is rejected before the second quarter of 2024, it could trigger a sharp correction.
placeholder
Natural Gas sinks to pivotal level as China’s demand slumpsNatural Gas price (XNG/USD) edges lower and sinks to $2.56 on Monday, extending its losing streak for the fifth day in a row. The move comes on the back of China cutting its Liquified Natural Gas (LNG) imports after prices rose above $3.0 in June. It
Author  FXStreet
Jul 01, Mon
Natural Gas price (XNG/USD) edges lower and sinks to $2.56 on Monday, extending its losing streak for the fifth day in a row. The move comes on the back of China cutting its Liquified Natural Gas (LNG) imports after prices rose above $3.0 in June. It
goTop
quote