
Top 3 Price Prediction Bitcoin, Ethereum, Ripple: Bitcoin faces resistance around $66,000
- Bitcoin price faces resistance around its key level of $66,000; a close above this level could continue its rise.
- Ethereum price finds support around its 50-day EMA level of around $2,600, eyeing a rally ahead.
- Ripple price breaks above its consolidation zone between the $0.560 and $0.613 key levels, signaling an upswing on the horizon.
Bitcoin (BTC) is at a critical resistance point, and a close above this level could signal further gains. At the same time, Ethereum (ETH) and Ripple (XRP) are gaining momentum as they establish support and break through their key levels, hinting at potential rallies ahead.
Bitcoin is poised for a rally if it breaks above $66,000
Bitcoin price broke above the consolidation zone between $62,000 and $64,700 on Thursday and rose 1% in the next two days. However, it faced rejection around the $66,000 psychological level on Saturday and declined slightly the next day. As of this writing on Monday, it continues to trade down around $64,500.
If BTC breaks and closes above the $66,000 level, it could rally 6% to retest its July 29 high of $70,079.
The Relative Strength Index (RSI) on the daily chart declined slightly and is currently pointing downward, trading at 59, indicating a slowdown of bullish momentum. For Bitcoin to continue its rally, the RSI must rise above its current trading level. However, traders should be cautious if it exceeds the overbought level of 70.
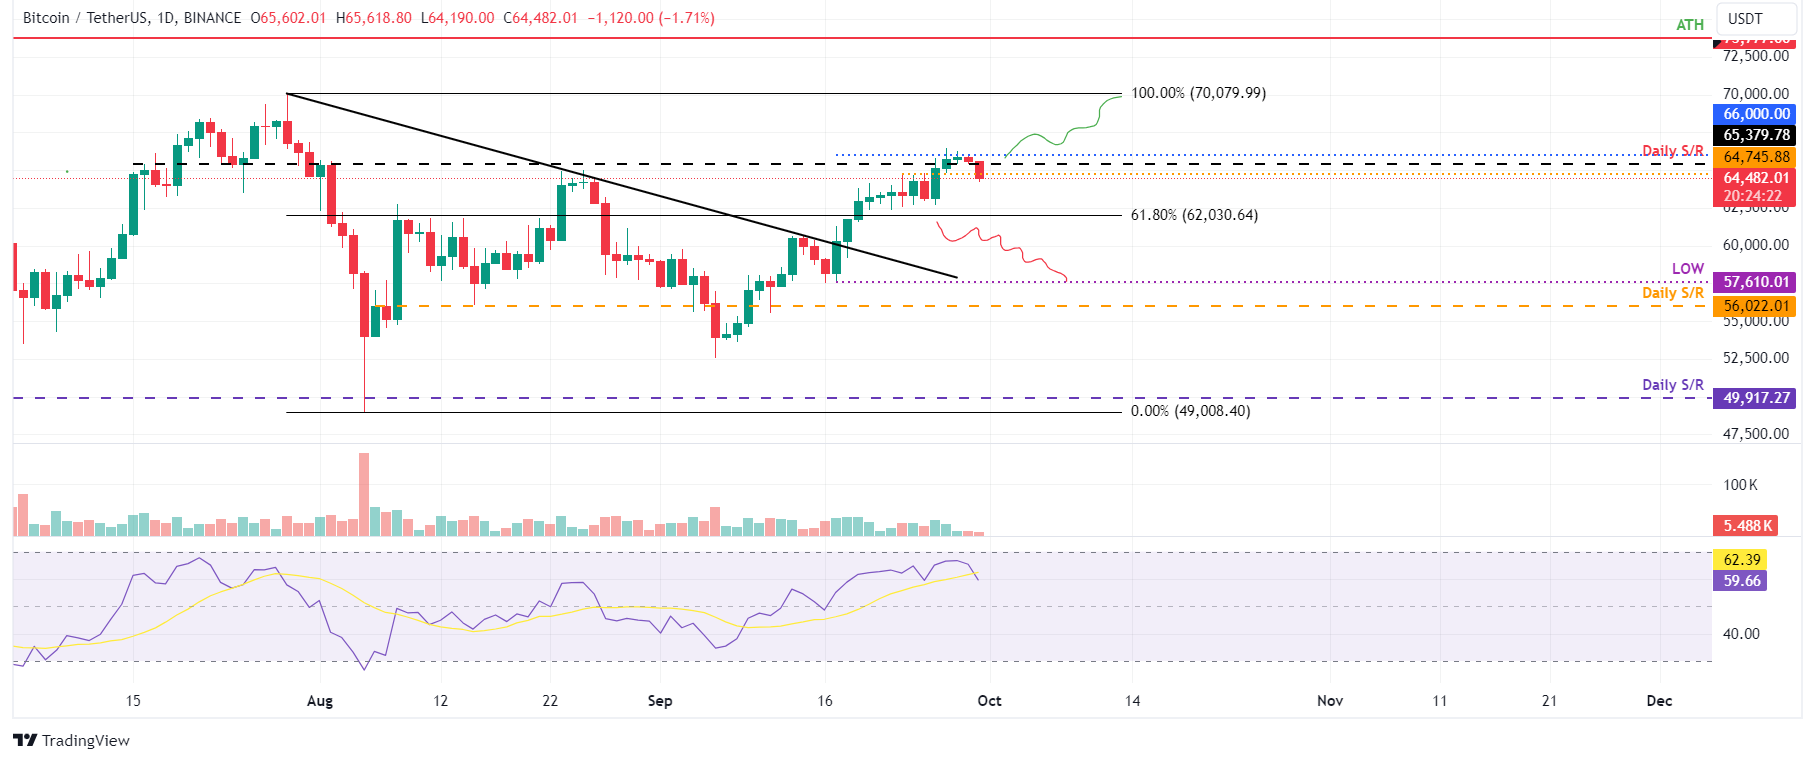
BTC/USDT daily chart
However, if BTC breaks and closes below the consolidation zone around $62,000, it could extend the decline by 7% to retest its September 17 low of $57,610.
Ethereum finds support at key level, eyeing potential rally ahead
Ethereum price is trading around its 50-day Exponential Moving Average (EMA) at $2,601 on Monday. It found support after breaking above its descending trendline on September 19, which led to an 11% rally.
If the 50-day EMA support at $2,601 holds, ETH could continue its rally from the current trading level of $2,625 to retest its August 24 high of $2,820.
The RSI on the daily chart is trading lower near the 55 level, reflecting the decrease in the bullish momentum. For the rally to be sustained, the RSI must rise above 60, which generally indicates that bulls are gaining traction.
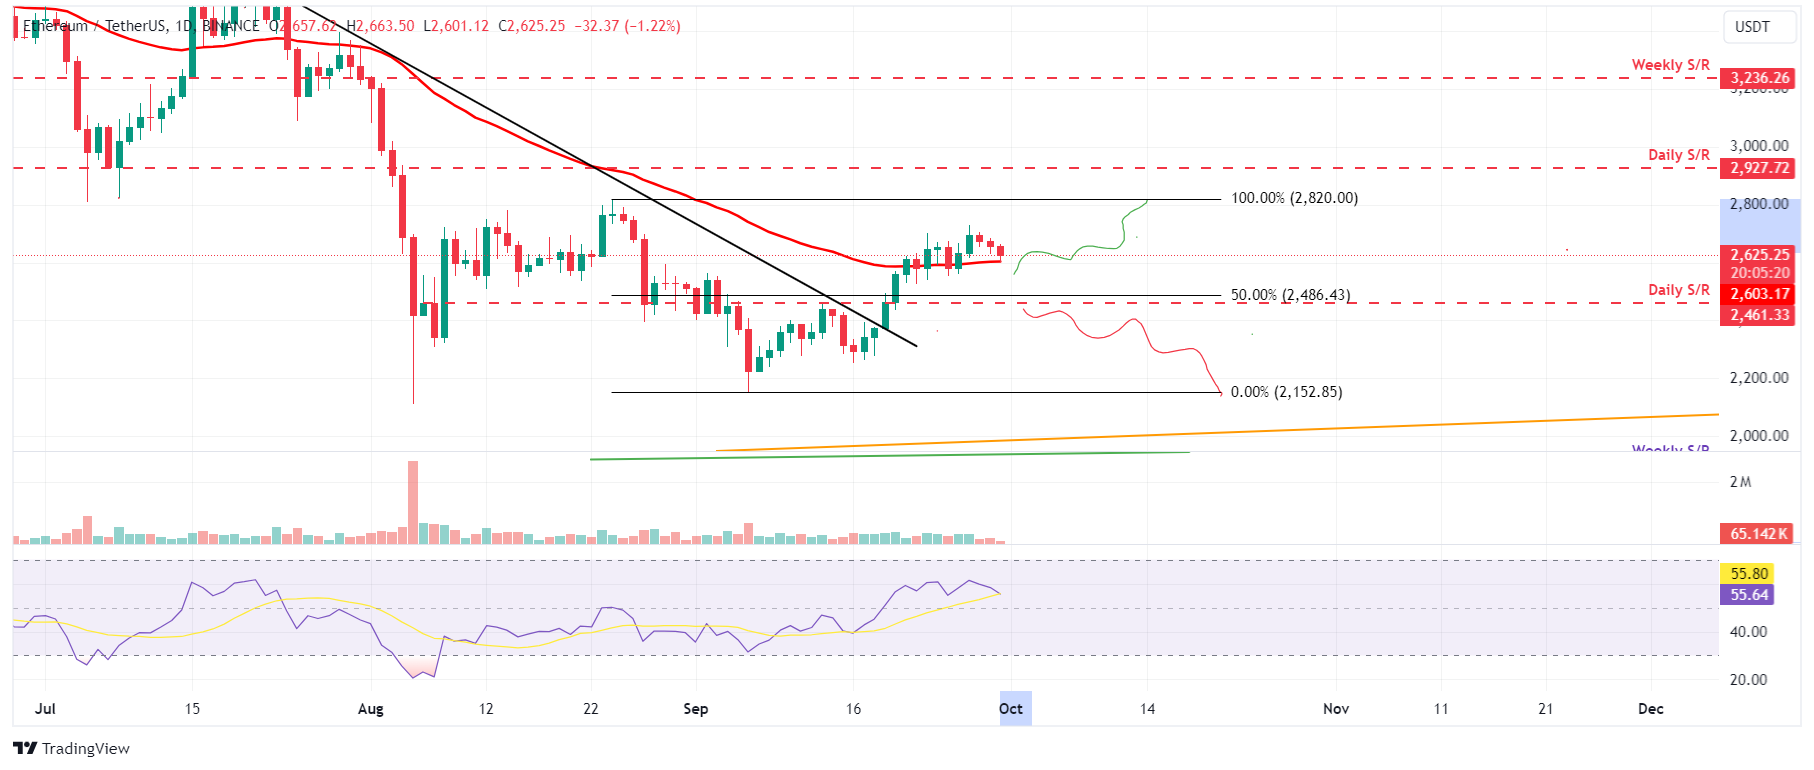
ETH/USDT daily chart
However, if the 50-day EMA fails to hold and Ethereum price declines, closing below the daily support level of $2,461, it could decline further to retest its September 6 low of $2,152.
Ripple price eyes a rally if it closes above the resistance barrier
Ripple price broke above its consolidation zone between the $0.560 and $0.613 key levels on Sunday and rallied 4.5%. It also retested its July 31 high of $0.658 but failed to close above it. As of Monday, it trades slightly above $0.645.
If Ripple price closes above the $0.658 level, it could rally 11% to retest its March 12 high of $0.732.
The RSI is nearing the overbought level of 70. If it enters the zone on a closing basis,the chances of a price pullback increase. Another possibility is that the rally continues, and the RSI climbs further up into overbought.
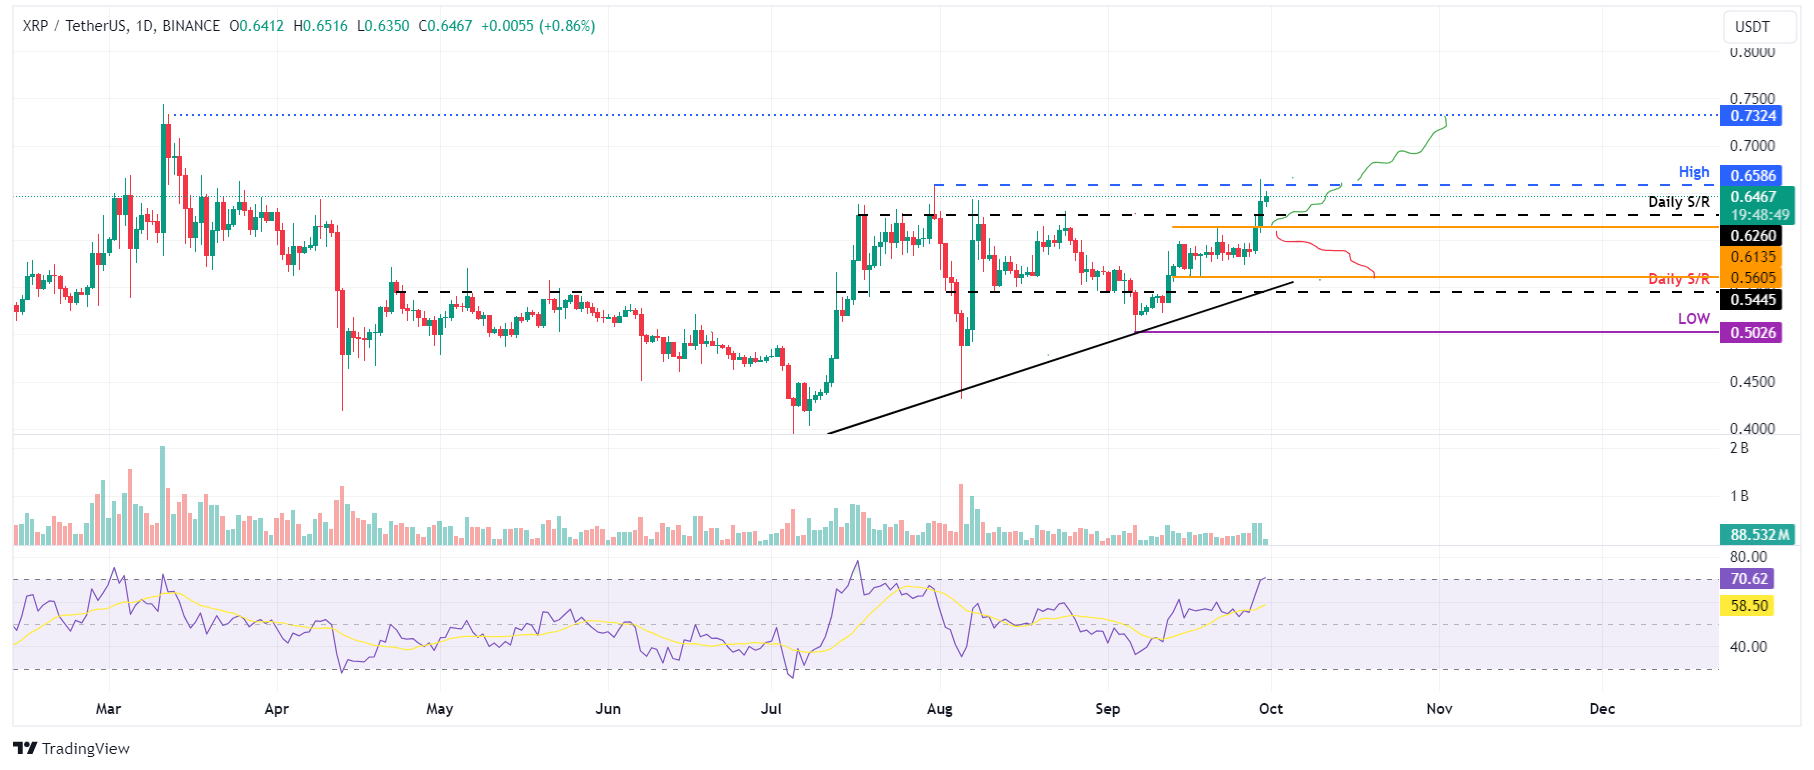
XRP/USDT daily chart
However, if Ripple’s price breaks and closes below the consolidation zone around $0.613, it could continue and extend its decline to retest its lower level of consolidation at $0.560.
Bitcoin, altcoins, stablecoins FAQs
Bitcoin is the largest cryptocurrency by market capitalization, a virtual currency designed to serve as money. This form of payment cannot be controlled by any one person, group, or entity, which eliminates the need for third-party participation during financial transactions.
Altcoins are any cryptocurrency apart from Bitcoin, but some also regard Ethereum as a non-altcoin because it is from these two cryptocurrencies that forking happens. If this is true, then Litecoin is the first altcoin, forked from the Bitcoin protocol and, therefore, an “improved” version of it.
Stablecoins are cryptocurrencies designed to have a stable price, with their value backed by a reserve of the asset it represents. To achieve this, the value of any one stablecoin is pegged to a commodity or financial instrument, such as the US Dollar (USD), with its supply regulated by an algorithm or demand. The main goal of stablecoins is to provide an on/off-ramp for investors willing to trade and invest in cryptocurrencies. Stablecoins also allow investors to store value since cryptocurrencies, in general, are subject to volatility.
Bitcoin dominance is the ratio of Bitcoin's market capitalization to the total market capitalization of all cryptocurrencies combined. It provides a clear picture of Bitcoin’s interest among investors. A high BTC dominance typically happens before and during a bull run, in which investors resort to investing in relatively stable and high market capitalization cryptocurrency like Bitcoin. A drop in BTC dominance usually means that investors are moving their capital and/or profits to altcoins in a quest for higher returns, which usually triggers an explosion of altcoin rallies.
Recommended Articles


