
Ordinals price prediction 2024 – 2030: Can ORDI Surge 100X?
Key Takeaways:
- Our Ordinals price prediction anticipates a high of $35.22 by the end of 2024.
- In 2025, it will range between $45.59 and $55.06, with an average price of $47.23.
- In 2030, it will range between $297.20 and $357.53, with an average price of $305.78.
In December 2023, ORDI became the first BRC-20 token to breach $1 billion in market capitalization. Following this achievement, ORDI has continued to gain attention from DeFi enthusiasts for its role in innovation. The Ordinals protocol allows data to be embedded directly on Bitcoin’s smallest unit—the Satoshi.
ORDI was the first token inscribed on the Ordinals protocol; like Bitcoin, it has a maximum supply of 21,000,000 coins. Currently trading at the $35 mark, investors can’t help but speculate on Ordi’s price trajectory. How high will ORDI go? Can ORDI surge 100x? What will the price of ORDI be in 2030? Let’s explore the ORDI price prediction from 2024 to 2030.
Overview
| Cryptocurrency | Ordinals |
| Ticker | ORDI |
| Current price | $39.06 |
| Market cap | $820,222,002 |
| Trading volume | $79,746,681 |
| Circulating supply | 21,000,000 |
| All-time high | $96.17 on Mar 5, 2024 |
| All-time low | $2.86 on Sep 11, 2023 |
| 24-hour high | $40.28 |
| 24-hour low | $38.35 |
ORDI price prediction: Technical analysis
| Metric | Value |
| Volatility (30-day variation) | 11.00% |
| 50-day SMA | $31.52 |
| 200-day SMA | $45.22 |
| Sentiment | Bullish |
| Fear and Greed Index | 63 (Greed) |
| Green days | 16/30 (53%) |
ORDI price analysis
As of the time of writing (September 29), ORDI’s price had dropped by 2.71% over the past 24 hours, and up 16.73% over the last seven days. The cryptocurrency has a market capitalization of $821.25 million and a trading volume of $79.39 million, which has dropped by 38.12%.
ORDI/USD 1-day chart
The Ordinal daily chart shows a bullish breakout, forming candlesticks above the William alligator trendlines. The coin has traded in a horizontal channel last week, with support and resistance levels at $26.28 and $36.50, respectively.
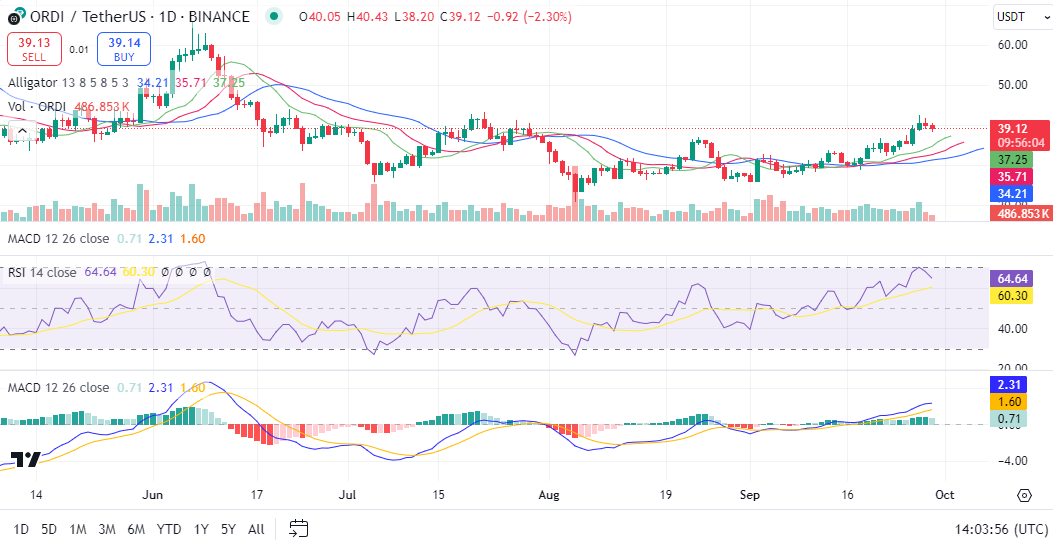
ORDI/USD chart. Image source: TradingView
Also, on the chart, both the signal line and the MACD line of the Moving Average Convergence Divergence indicator are trending above the zero line, signaling an overall bullish sentiment. At the same time, the relative strength index is in neutral territory. The William Alligator is feeding, signaling rising volatility.
ORDI/USD 4-hour chart
Technical analysis of the 4-hour chart reveals that ORDI is bullish, reaching a high of $42.50.
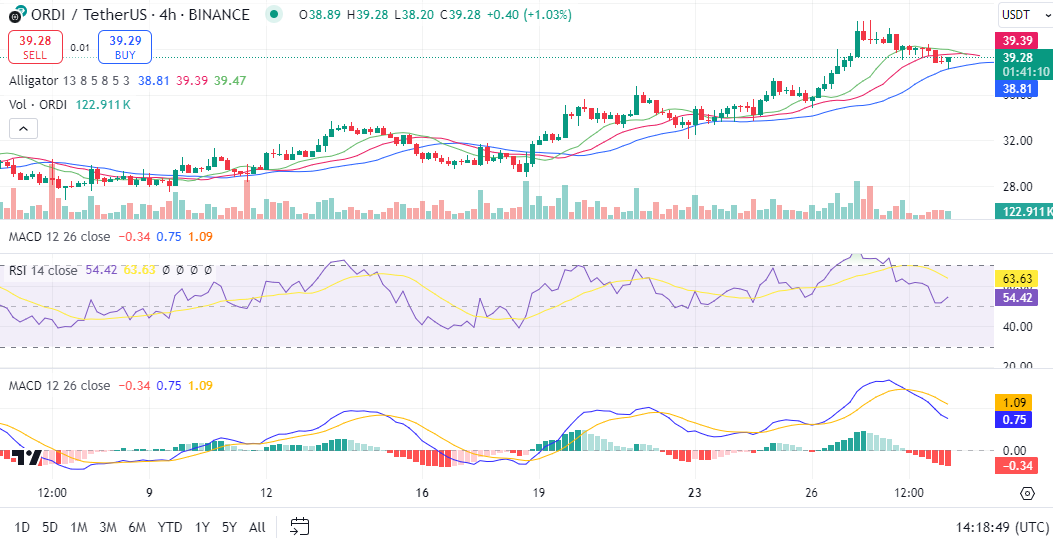
ORDI/USD chart. Image source: TradingView
Unlike the daily chart, ORDI trades along the William Alligator trendlines, marking a brief correction from the recent peak. The MACD shows rising negative momentum.
ORDI technical analysis: Levels and action
Daily simple moving average (SMA)
| Period | Value ($) | Action |
| SMA 3 | 36.02 | BUY |
| SMA 5 | 36.03 | BUY |
| SMA 10 | 35.42 | BUY |
| SMA 21 | 33.70 | BUY |
| SMA 50 | 31.52 | BUY |
| SMA 100 | 33.10 | BUY |
| SMA 200 | 45.22 | SELL |
Daily exponential moving average (EMA)
| Period | Value ($) | Action |
| EMA 3 | 33.20 | BUY |
| EMA 5 | 31.97 | BUY |
| EMA 10 | 30.72 | BUY |
| EMA 21 | 30.60 | BUY |
| EMA 50 | 32.97 | BUY |
| EMA 100 | 37.27 | BUY |
| EMA 200 | 40.79 | SELL |
What to expect from ORDI price analysis next?
The combination of technical indicators and chart analysis suggests that ORDI is bullish but is currently gearing up for a closer move to $39.
Moreover, the William Alligator trendlines, which measure volatility, are widening, indicating rising price movement.
Why is ORDI down?
ORDI is correcting from its recent peak. The drop in ORDI value could be attributed to the general market sentiment.
Recent news
On October 10, Christie’s London will host the first-ever Bitcoin ordinal in a live auction. The ordinal “Ascend” is a one-of-one piece of dynamic digital artwork and will be the only digital artwork in the sale.
Is ORDI a good investment?
ORDI had the first-mover advantage on the Ordinals protocol. ORDI price movements are correlated to Bitcoin’s. Our Cryptopolitan Price Prediction shows how the coin will gain value in years to come.
Will ORDI recover?
ORDI is currently trading at its lowest this year and is ripe for a reversal. It will recover in the coming months.
Will ORDI reach $50?
Yes, ORDI should rise above $50 in 2025. The move will come as the market recovers to previous highs.
Will ORDI reach $100?
According to the Cryptopolitan price prediction, ORDI will rise to $100 in 2027 and reach a maximum price of $116.80 during that time.
Will ORDI reach $1000?
Per the Cryptopolitan price prediction, it remains highly unlikely that ORDI will get to $1000 before 2030.
Does ORDI have a good long-term future?
According to Cryptopolitan price predictions, ORDI will trade higher in years to come. However, factors like market crashes or difficult regulations could invalidate this bullish theory.
Ordinals price prediction September 2024
The Ordinals forecast for September is a maximum price of $30.54 and a minimum price of $24.50. The average trading price will be $27.40.
| Month | Potential low ($) | Potential average ($) | Potential high ($) |
| September | 24.50 | 27.40 | 30.54 |
Ordinals price prediction 2024
For the rest of 2024, ORDI’s price will range between $24.50 and $32.77. The average price for the year will be $30.09.
| Year | Potential low ($) | Potential average ($) | Potential high ($) |
| 2024 | 31.39 | 32.82 | 35.22 |
Ordinals price prediction 2025 – 2030
| Year | Potential low ($) | Potential average ($) | Potential high ($) |
| 2025 | 45.59 | 47.23 | 55.06 |
| 2026 | 67.41 | 69.30 | 80.75 |
| 2027 | 96.94 | 99.71 | 116.80 |
| 2028 | 141.29 | 146.28 | 167.65 |
| 2029 | 208.74 | 214.59 | 244.05 |
| 2030 | 297.20 | 305.78 | 357.53 |
Ordinals price prediction 2025
The Ordinals ORDI price prediction for 2025 is a high of $55.06. It will reach a minimum price of $45.59 and an average price of $47.23.
Ordinals price prediction 2026
The Ordinals ORDI price prediction estimates it will range between $67.41 and $80.75, with an average price of $69.30.
Ordinals ORDI price prediction 2027
Ordinals coin price prediction climbs even higher into 2027. According to the predictions, ORDI’s price will range between $96.94 and $116.80, with an average price of $99.71.
Ordinals crypto price prediction 2028
Our analysis indicates a further acceleration in ORDI’s price. It will trade between $141.29 and $167.65 and average at $146.28.
Ordinals ORDI price prediction 2029
According to the ORDI coin price prediction for 2029, the price of ORDI will range between $208.74 and $244.05, with an average price of $214.59.
Ordinals price prediction 2030
According to the 2030 Ordinals price prediction, they will range between $297.20 and $357.53, with an average price of $305.78.
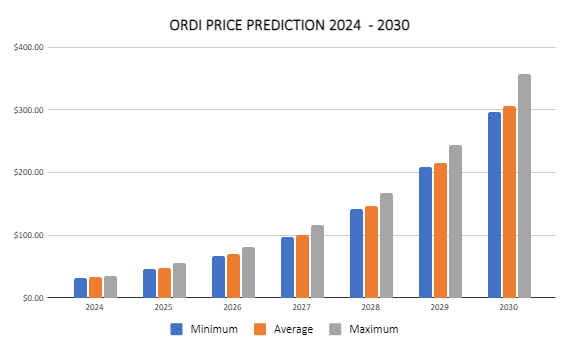
ORDI price prediction 2024 – 2030
Ordinals market price prediction: Analysts ORDI price forecast
| Firm | 2024 | 2025 | 2026 |
| Changelly | $37.36 | $52.70 | $28.71 |
| Digitalcoinprice | $61.48 | $68.53 | $102.57 |
| Gate.io | $28.56 | $31.27 | $35.18 |
Cryptopolitan Ordinals price prediction
Our predictions show that ORDI will achieve a high of $35.22 in the second half of 2024. In 2025, it will range between $45.59 and $55.06, with an average of $47.23. In 2030, it will range between $297.20 and $357.53, with an average of $305.78. Note the predictions are not investment advice. Seek independent consultation or do your research.
ORDI’s historic price sentiment
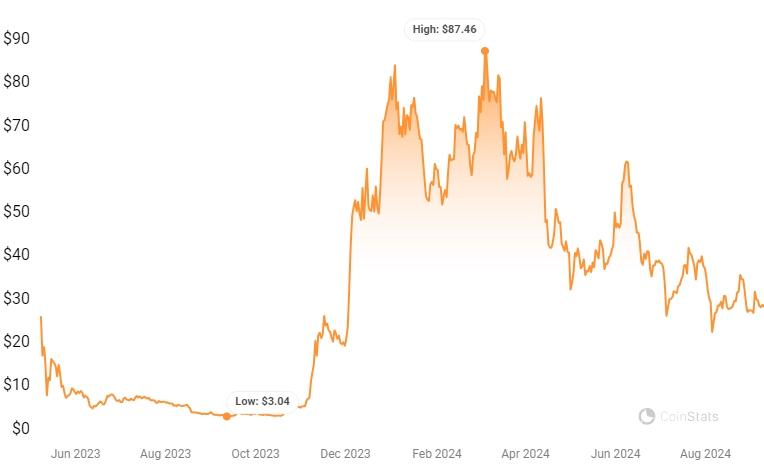
- According to Coinmarketcap, ORDi started trading in May 2023 at $25.3466. It later fell, reaching its lowest value of $2.86 in September 2023.
- Binance listed ORDI on November 17, 2023. However, due to a lack of clear information from Binance, there needed to be more clarity, leading many to mistakenly believe that ORDI was a direct product of the Ordinals protocol.
- This misunderstanding contributed to ORDI’s dramatic market performance. The meme coin saw a 40% increase in value within a single day, culminating in a 100% rise over four days.
- Despite these fluctuations, ORDI’s popularity surged, and by the end of 2023, its price had climbed above $50.
- ORDI peaked in March 2024, hitting an all-time high of $96.17.
- It later moved into a bear run, and by April, it had already dropped by 50%. It now trades at the $28 mark.
Recommended Articles


