

Ethereum risks decline to $2,395 as CoinShares report notes that L2s may be cannibalizing its Layer 1
- Ethereum's main value driver is centered around asset speculation, says CoinShares.
- Ethereum ETFs posted $62.5 million in net inflows on Tuesday, their highest since August 6.
- Ethereum could decline to $2,395 after breaching a key support level.
Ethereum (ETH) is down over 2% on Wednesday following CoinShares' recent report detailing token transfers and asset speculation as some of the key value drivers for ETH. The report also highlighted how the recent Mainnet upgrade has complicated the Layer 1 (L1) and ETH's economic design.
Daily digest market movers: Ethereum key value drivers
CoinShares recently released a report detailing key features that drive value for Ethereum. The report noted that token transfers, largely dominated by ETH and stablecoins, are Ethereum's key value drivers.
"It demonstrates the ongoing importance of ETH as the network's native asset and the critical role stablecoins play in the broader industry," wrote CoinShares analyst Matthew Kimmell
Kimmell added that while Ethereum has grown to boast over a billion dollars in user fee spend annually, most activities within its ecosystem are "highly concentrated into a few use cases centered around asset speculation."
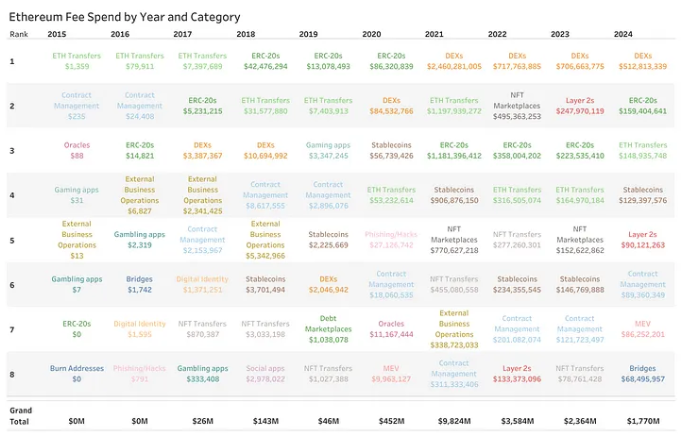
Ethereum Fee Spend
The report also highlighted that Ethereum has focused heavily on scaling via Layer 2 solutions, but this has come at the expense of cannibalizing Layer 1 and complicating its relationship to ETH.
"In our view, the latest major change, EIP-4844, which strongly incentivized Layer-2s, has worked directly against the economic design benefits of EIP-1559, which tied the value of ETH to its Layer 1 platform demand," noted Kimmell.
Meanwhile, Ethereum ETFs recorded net inflows of $62.5 million on Tuesday, their highest inflow data since August 6. BlackRock's ETHA was largely responsible for the positive flows, with over $59 million in inflows. Grayscale's ETHE, on the other day, witnessed zero net flows.
Ethereum risks a decline to $2,395
Ethereum is trading around $2,570 on Wednesday, down over 2% on the day. The top altcoin has seen $15.05 million in liquidations in the past 24 hours, with long and short liquidations accounting for $10.15 million and $4.9 million, respectively.
On the 4-hour chart, Ethereum breached a key rectangle's support level at $2,595 to balance a market inefficiency seen on Sunday. If its price fails to bounce off any of the 50-day, 100-day and 200-day Simple Moving Averages (SMAs), ETH could move toward the $2,395 level.
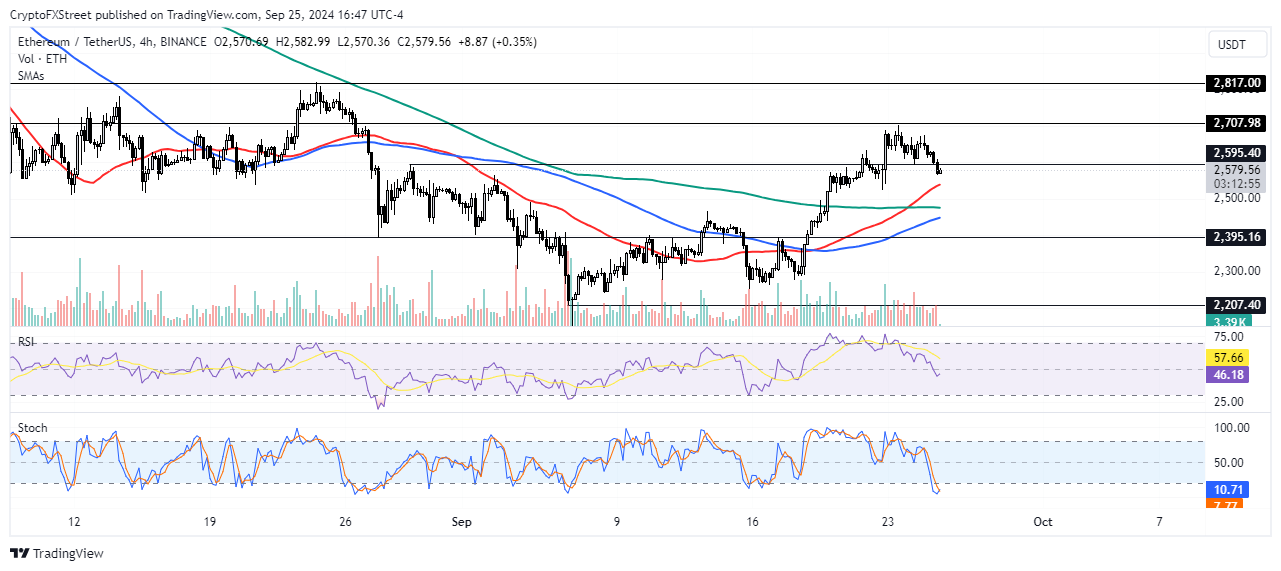
ETH/USDT 4-hour chart
The Relative Strength Index (RSI) momentum indicator has declined below its neutral level, while the Stochastic Oscillator is in the oversold region.
Ethereum FAQs
Ethereum is a decentralized open-source blockchain with smart contracts functionality. Serving as the basal network for the Ether (ETH) cryptocurrency, it is the second largest crypto and largest altcoin by market capitalization. The Ethereum network is tailored for scalability, programmability, security, and decentralization, attributes that make it popular among developers.
Ethereum uses decentralized blockchain technology, where developers can build and deploy applications that are independent of the central authority. To make this easier, the network has a programming language in place, which helps users create self-executing smart contracts. A smart contract is basically a code that can be verified and allows inter-user transactions.
Staking is a process where investors grow their portfolios by locking their assets for a specified duration instead of selling them. It is used by most blockchains, especially the ones that employ Proof-of-Stake (PoS) mechanism, with users earning rewards as an incentive for committing their tokens. For most long-term cryptocurrency holders, staking is a strategy to make passive income from your assets, putting them to work in exchange for reward generation.
Ethereum transitioned from a Proof-of-Work (PoW) to a Proof-of-Stake (PoS) mechanism in an event christened “The Merge.” The transformation came as the network wanted to achieve more security, cut down on energy consumption by 99.95%, and execute new scaling solutions with a possible threshold of 100,000 transactions per second. With PoS, there are less entry barriers for miners considering the reduced energy demands.
Recommended Articles


