
Bitcoin Price Prediction: New All-Time High Still Possible in 2024
Bitcoin’s (BTC) price appears to be seeking to hit a higher value after recently breaking above $63,000. With the market becoming favorable again, speculation is spreading that BTC could hit a new all-time high (ATH) before the end of 2024.
But will the coin succumb to the wishes of these investors? This on-chain analysis looks at the possibility.
Bitcoin Remains Undervalued
Bitcoin surprised the market when the price reached its all-time high of $73,750 before the halving. It was the first time such a thing had happened since BTC became mainstream. Currently, Bitcoin’s price is down 14% from that peak.
At some point, Bitcoin dropped below $50,000. However, with the cryptocurrency back above $63,000, data shows that the uptrend could continue. One metric supporting this bias is the Realized Cap.
In simple terms, the Realized Cap is the total cost of acquiring every Bitcoin in circulation. When the market cap is lower than the Realized Cap, it means BTC is overvalued. At press time, Bitcoin’s market cap is $1.25 billion.
Read more: Top 7 Platforms To Earn Bitcoin Sign-Up Bonuses in 2024
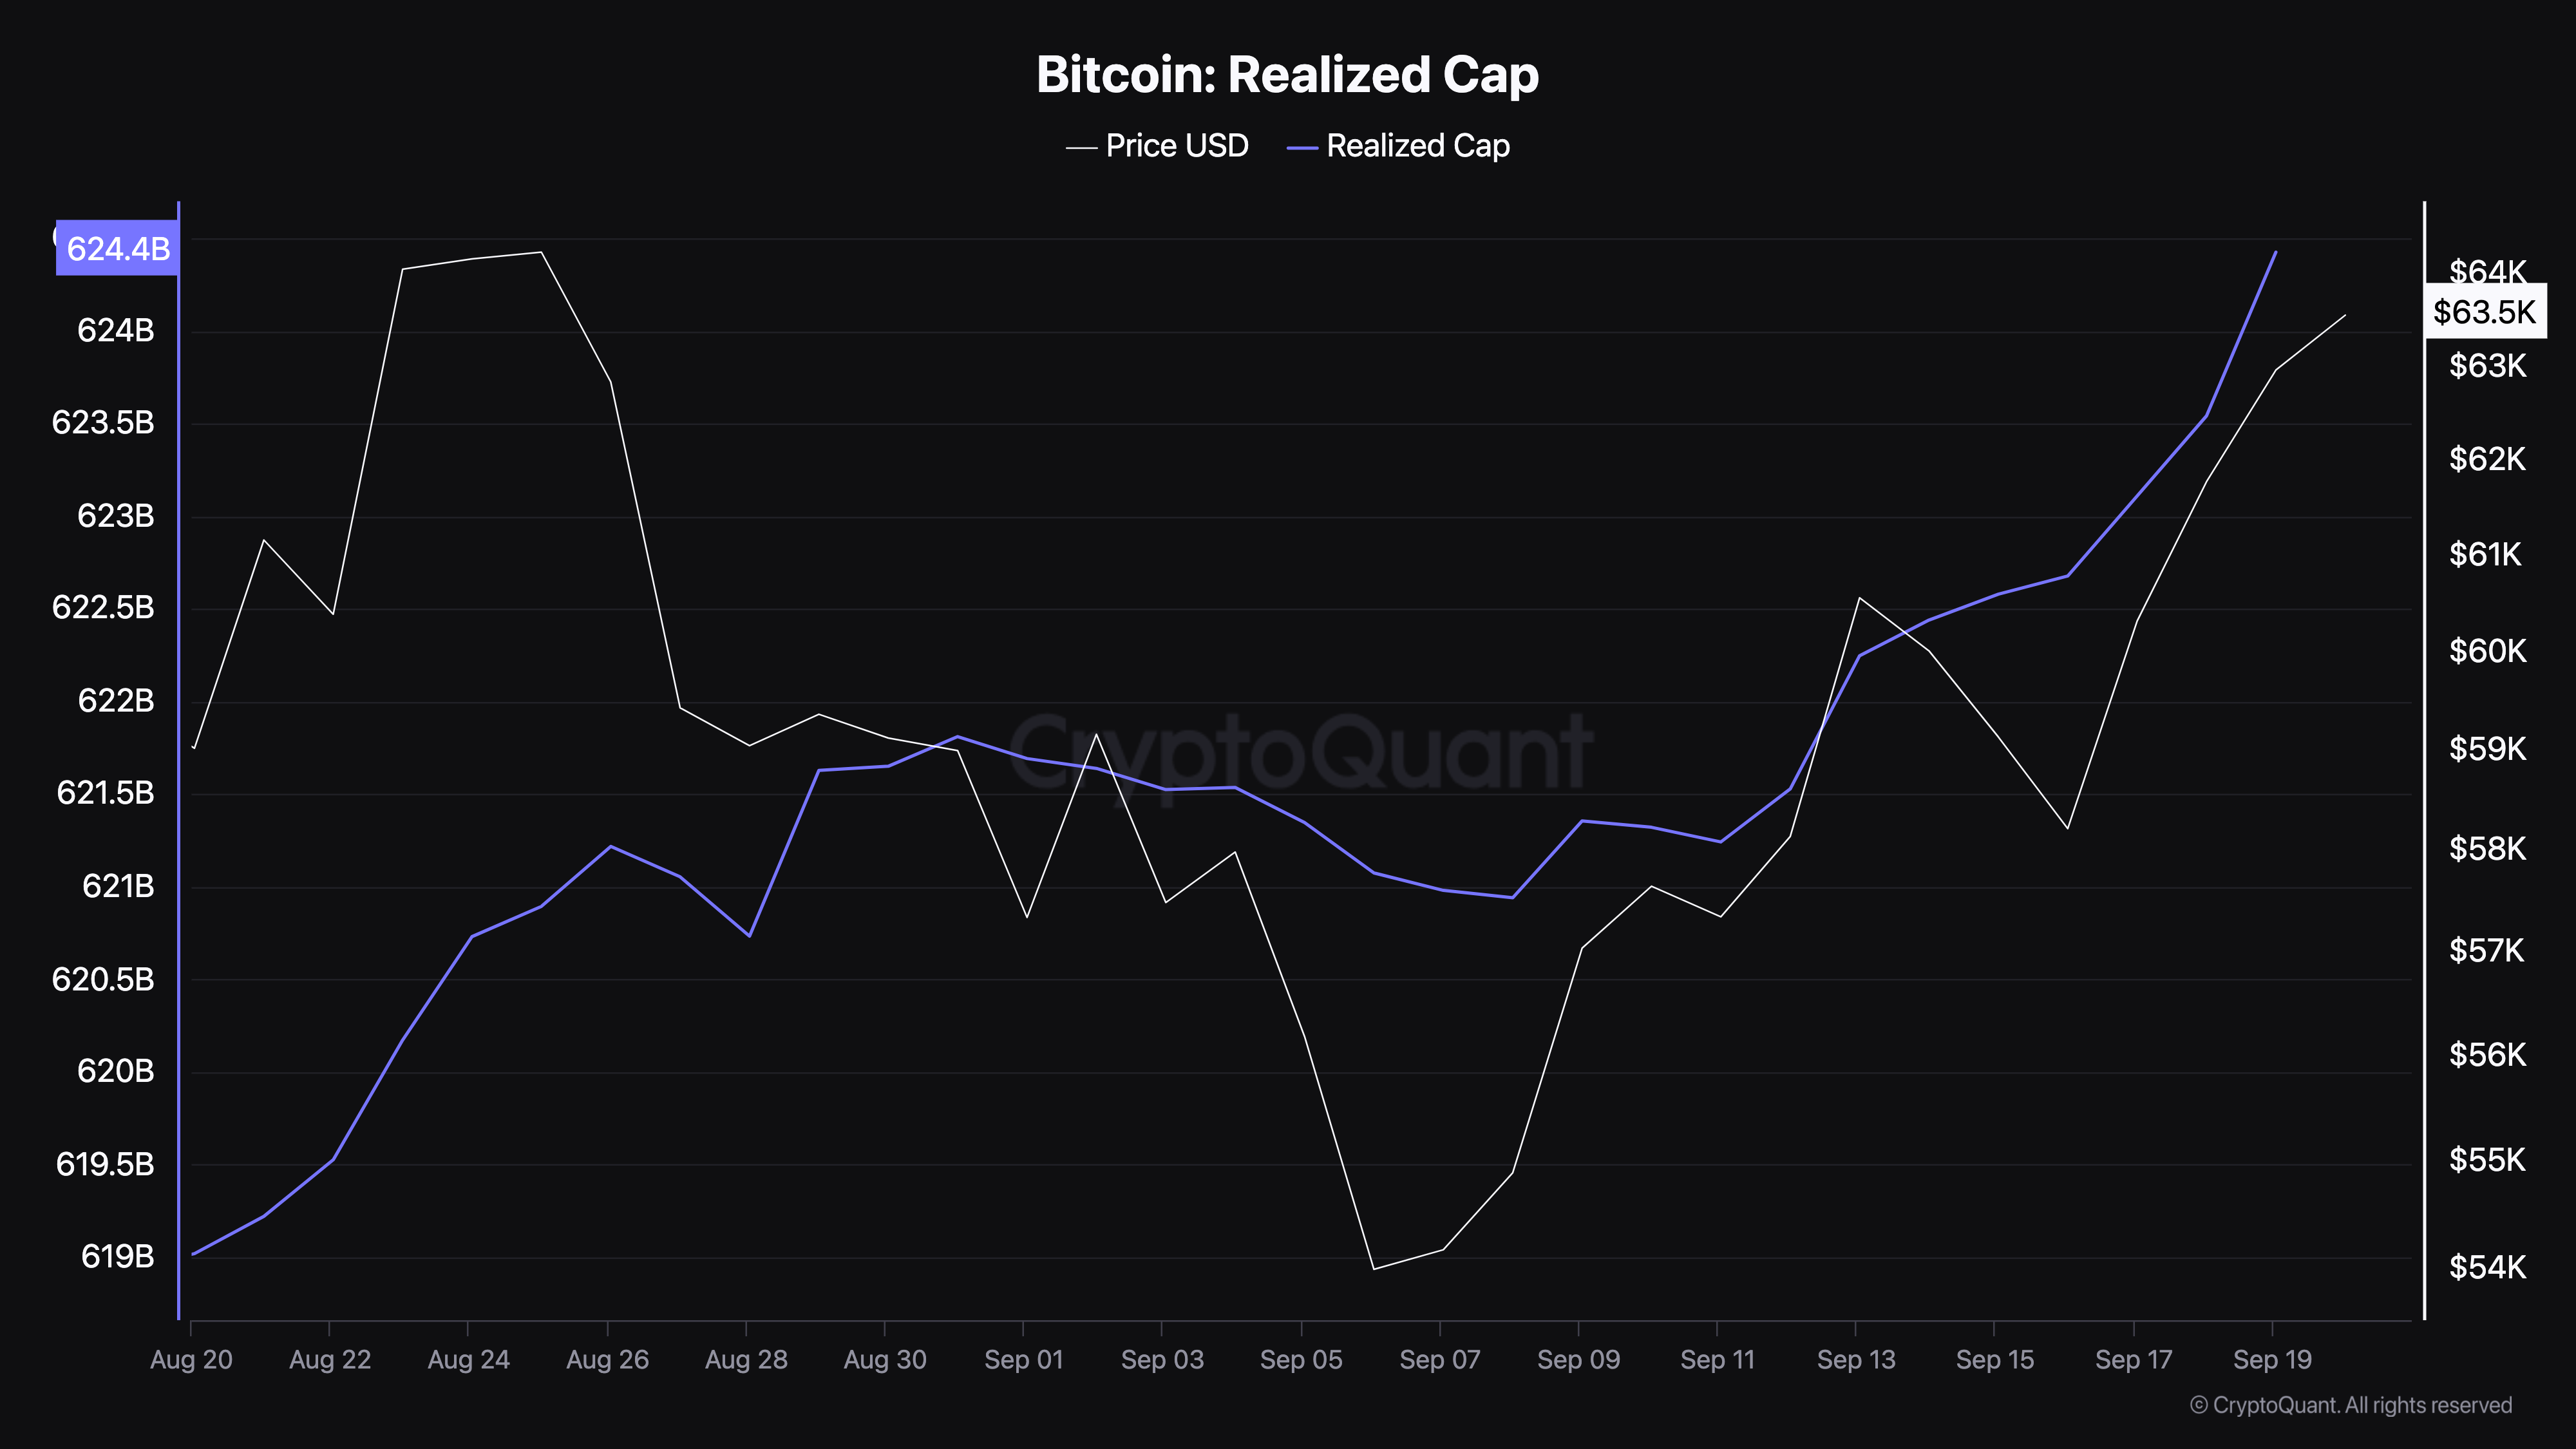 Bitcoin Realized Cap. Source: CryptoQuant
The Realized Cap, on the other hand, is $624.24 billion, as shown above. This indicates that BTC is undervalued and that the price has the potential to go higher.
If this remains the same, then Bitcoin could hit a new all-time high before 2024 ends. Interestingly, crypto analyst Michaël van de Poppe thinks the new ATH might come earlier.
“Bitcoin is following the plan! I’m looking to see whether $66K is the next resistance and a pullback afterward. Overall, I assume we’ll see a new ATH in October,” van de Poppe wrote on X.
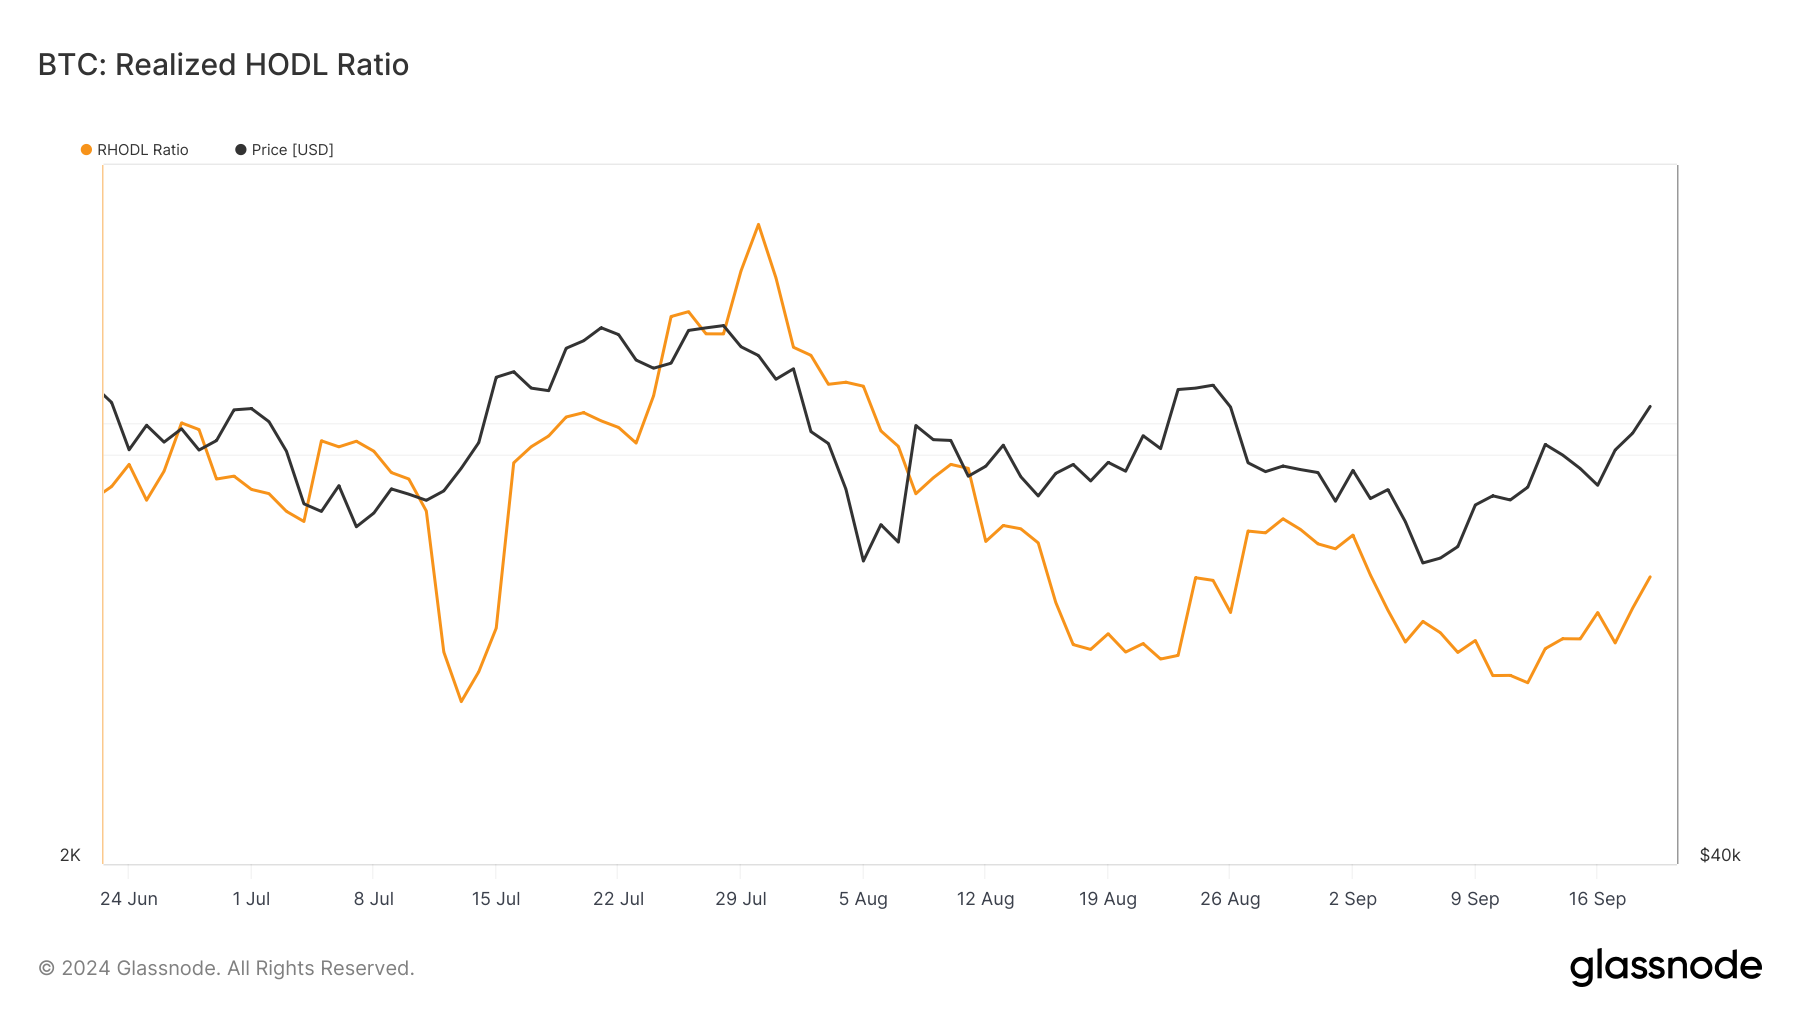 Bitcoin RHODL Ratio. Source: Glassnode
Furthermore, the Realized HODL (RHODL) ratio has recently increased. The RHODL ratio shows whether Bitcoin’s price has reached the top or is at the bottom. An extremely high ratio indicates that the cryptocurrency has reached the top, and correction could be next.
However, as of this writing, the ratio is nowhere near an overheated. As such, the recent price increase might continue, bringing BTC closer to a new ATH.
BTC Price Prediction: $70,000 First, Higher Prices Later
Based on the daily chart, BTC price has risen above the short and long Exponential Moving Averages (EMAs) for the first time since August. As seen above, the 20 EMA (blue), 50 EMA (yellow), and 200-day EMA (purple) are all below BTC, which is trading at $63,038.
Whenever this happens, Bitcoin’s price could swing higher. Interestingly, this position coincides with a potential break of the 20 EMA above the 200 EMA. In addition, the Relative Strength Index (RSI) has risen above the resistance last seen in July. The recent milestone suggests a strong bullish momentum for the coin.
Read more: 9 Best Crypto Platforms To Buy Bitcoin With PayPal
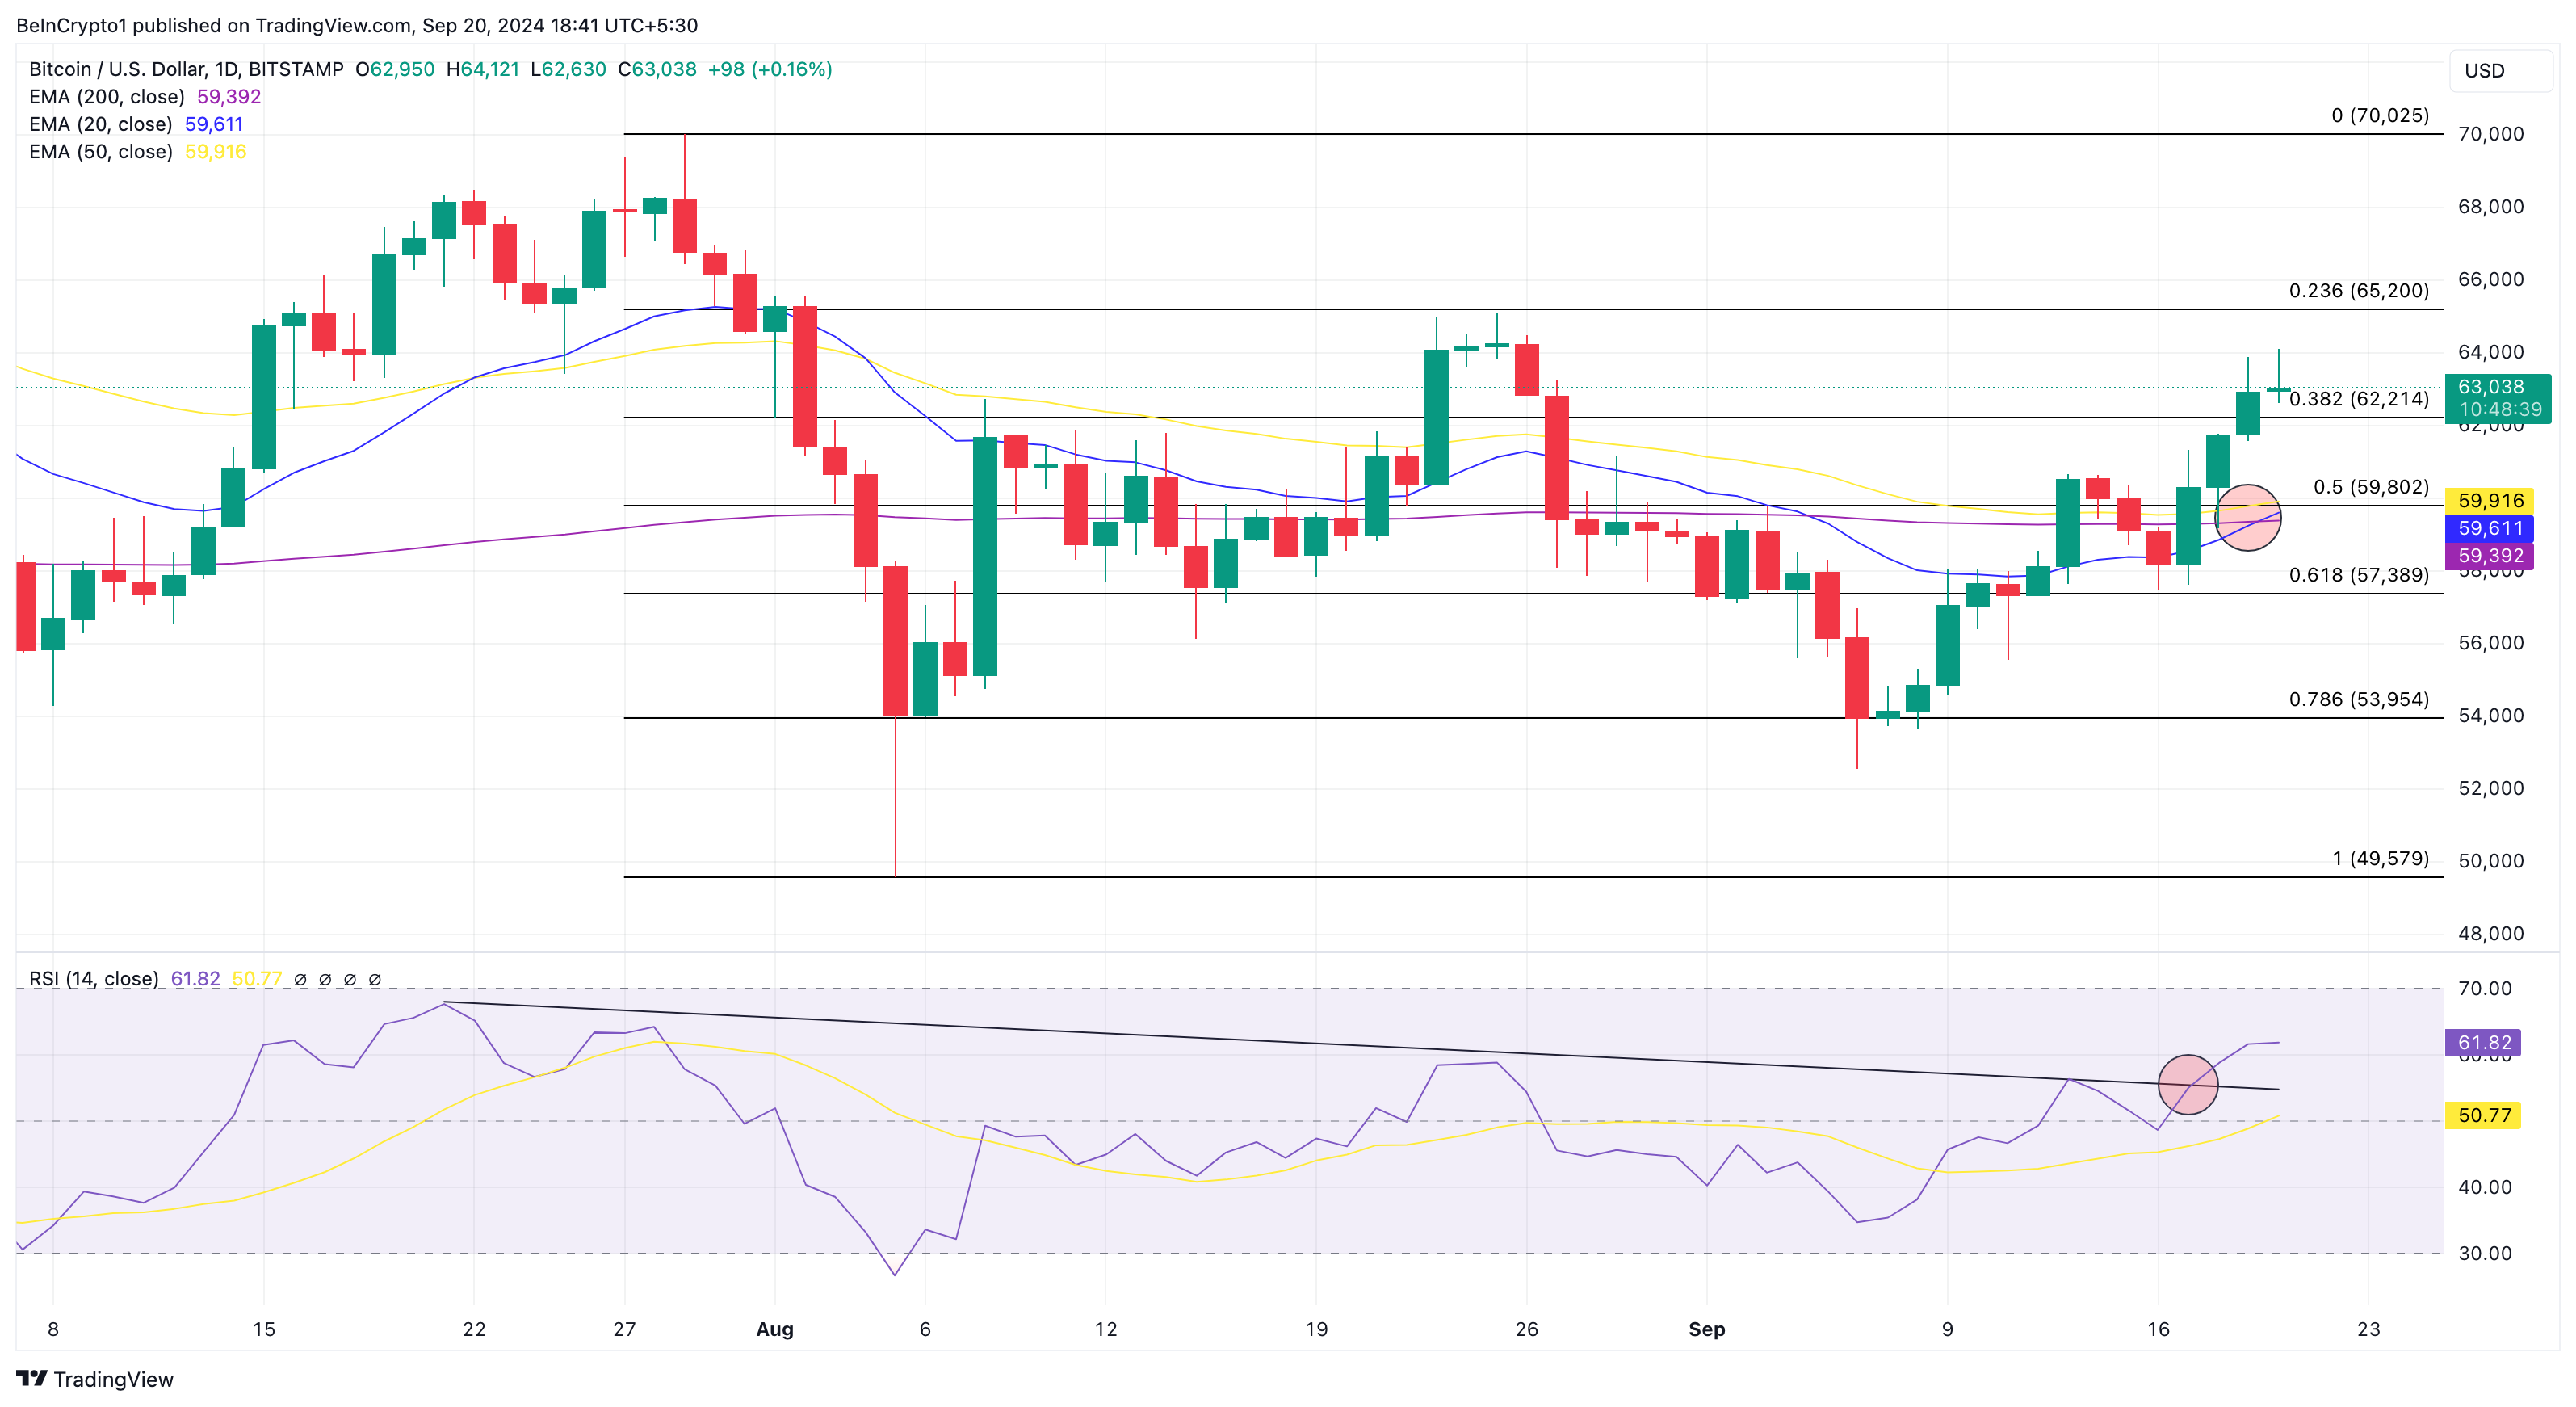 Bitcoin Daily Analysis. Source: TradingView
As long as this continues, BTC might hit $70,025 within a few weeks. If validated, Bitcoin could surpass $73,750 and head toward a new ATH before the year ends.
The coin might, however, fail to hit a new ATH if BTC faces rejection at $65,200. If this happens, Bitcoin will decline to $57,389
Recommended Articles


